MEASUREMENT OF ACOUSTIC IMPEDANCE OF THE POROUS WOVEN
HOSES IN ENGINE INTAKE SYSTEMS IN THE PRESENCE OF MEAN FLOW
PACS Nr.: 43.20.Ye
Ih, Jeong-Guon1; Park, Chul-Min1,2; Nakayama, Yoshio3 1
Korea Advanced Institute of Science and Technology; 3 Nihon Sekiso Ind. Co., Ltd. 1
Center for Noise and Vibration Control, Department of Mechanical Engineering Korea Advanced Institute of Science and Technology (KAIST), Science Town Yusung-gu, Taejon 305-701, Korea
Tel: +82.42.869.3035; Fax: +82.42.869.8220 e-mail: ihih@sorak.kaist.ac.kr
2
Now working at Visual Display Division, Samsung Electronics Co., Ltd. 416 Maetan-3-dong, Paldal-gu, Suwon 442-742, Korea
Tel: +82.31.200.5499; e-mail: dyboon5@chollian.net
3
Nihon Sekiso Ind. Co., Ltd., 1-3 Hinakita-cho, Okazaki, Aichi, Japan Tel: +81.564.25.2121; e-mail: nakayama@sekiso.co.jp
ABSTRACT
For the prediction of acoustic performance of an engine intake system with porous woven hose, the wall impedance of the hose must be known in the presence of mean flow. Here, the acoustic impedance is inversely estimated from an overdetermined set of measured pressure transmission coefficients for specimens of different lengths and the reflection coefficient of end termination. The method involves only one measurement, and, as a result, it is very simple. The measured TL for samples with arbitrary conditions, arbitrary porous frequency, arbitrary length, and arbitrary mean flow condition, agree very well with values predicted from curve-fitted impedance data.
1. INTRODUCTION
Recently, wire-reinforced porous tubes of woven fabric coated with acrylic resin have been introduced into the intake systems of many internal combustion engines for purposes of reducing noise radiated from the snorkel opening. Resonators in an intake system, for suppressing acoustic resonances and adverse effects due to installing a resonator for a frequency, can be replaced by one section of a porous woven hose [1]. An added advantage of a porous woven hose is its flexibility, which permits the system layout and isolation of transmitted vibration to be readily achieved. Because of this, the porous woven hose is now considered to be a very promising and efficient silencing component in spite of its relatively high cost. It should be noted that the overall physical characteristics of a porous woven hose have been rated by a single-figure parameter, viz., porous frequency, which is mainly affected by the length, radius, material, weaving quality, and coating conditions [2].
2. THEORETICAL BACKGROUND OF MEASUREMENT
A. Transfer matrix
Consider a sound field within a porous woven hose with a mean flow as depicted in Fig. 1. An acoustic source exists at one end of the duct and a linear passive termination is located at the opposite end. The duct walls at regions A and B are assumed to be rigid and no active source exists inside the whole duct system except the source speaker. The sound pressure and particle velocity of the plane waves propagating axially inside the duct can be written as [5]
( )
exp(
)
exp( )
p p z p z
P z =P+ −jk z+ +P− jk z− , (1)
( )
(
)
(
)
(
)
( )
0 0 0 0 0 0
1 1
exp exp
z z
p p z p z
z z
k k
u z P jk z P jk z
c k Mk c k Mk
ρ ρ
+ −
+ + − −
+ −
= − −
− + , (2)
( )
0p A A
P =P++P−,
( )
(
)
0 0 0
p A A
p
S
u P P
c S
ρ + −
= − , (3, 4)
( )
p B B
P L =P++P−,
( )
(
)
0 0
p B B
p
S
u L P P
c S
ρ + −
= − , (5, 6)
where
(
)
(
) ( )
2 0 2 20 0 0 0
2 z
n
i z z
k k M
Z j
c k r k k M k
ρ ± ± ± = − m m
,
(
k0 k Mz) ( ) ( )
2 kz 2 kr 2± = ± + ±
m . (7, 8)
Here, the subscripts A, B, p refer to duct A, duct B, the porous tube, respectively, the superscripts '+' and '-' denote the incident and reflected pressures, respectively, kz± and kr±
denotes the forward and backward complex propagation constants in the axial and radial direction, respectively. P(z) denotes the acoustic pressure at position z, u(z) the particle velocity at position z, k0=ωc0, c0 the speed of sound, ρ0 the density of the fluid medium, ω the angular frequency,
r
i the inner radius of porous woven hose, Zn the normal impedance ati
r =r, i.e., at the inner wall of porous woven hose, M the mean flow Mach number, S indicates the cross sectional area of the duct A and B. By adopting the acoustic pressure and velocity as two state variables, the relation between the upstream and downstream parameters can be obtained as follows:
L z p p p z p p p S u P T T T T S u P = = = 22 21 12 11 0
. (9)
Here, the four-pole parameters in Eq. (9) can be expressed as
(
) (
) (
) (
)
(
)
0 0 11 0 exp expz z z z z z
z z
k k Mk jk L k k Mk jk L
T
k k k
− + + + − −
+ −
− + + −
=
+ , (10a)
(
)(
)
(
)
(
)
(
)
0 0 0 0 12 0 exp expz z z z
p z z
k Mk k Mk jk L jk L
c T
S k k k
ρ − + + −
+ −
+ − + − −
=
+ , (10b)
(
)
(
)
(
)
21
0 0 0
exp z exp z
p z z
z z
jk L jk L
S k k T
c k k k
ρ + − + − + − + − − =
+ , (10c)
(
) (
) (
) (
)
(
)
0 0 22 0 exp expz z z z z z
z z
k k Mk jk L k k Mk jk L
T
k k k
+ − + − + −
+ −
+ + + − −
=
+ , (10d)
where SP (=πr2i) is the sectional area of the porous woven hose.
B. Relation between four-pole parameters and pressure transmission coefficient
The pressure transmission coefficient τ is defined as the ratio between the incident and transmitted acoustic pressure. For a porous woven hose section, the pressure transmission coefficient τ can be described in terms of the foregoing four-pole parameters as
0 1 , , , , A B z B B P P
F k L k M
P P τ + − ± + + = =
where
0 0 0 0
0 11 12 21 22 11 12 21 22
0 0 0 0
1 , , , ,
2
B B
z
B B
c c
P S P S
F k L k M T T T T T T T T
c S c S
P P
ρ ρ
ρ ρ
− −
±
+ +
= + + + + − + −
. (12)
Ignoring the radiation impedance, the relation between normal impedance Znand impedance of porous woven hose Zp can be written as [1]
0 0 0
0
2
c Z
r r
r
c
Z n
o i
o p
ρ ρ
β
+ ≈
≡ , (13)
where ro is the outer radius of the porous woven hose.
Note that the pressure transmission coefficient τ can be expressed by the measurable quantities such as the measured transfer function, Htrelating the sound pressures at two sides,
A and B, and the pressure reflection coefficients at the upstream and downstream side, respectively, which are defined as RA =PA− PA+, RB =PB− PB+:
1
1 1
1
A B
t A
B
P R
H R
P
τ +
+
+
= =
+ . (14)
C. Inverse estimation of acoustic impedance
Using the same experimental setup for the measurement of transmission loss, τand RB can
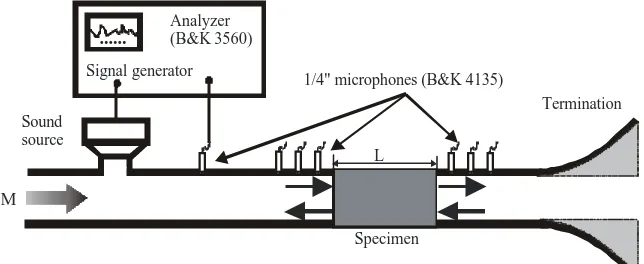
be measured. Figure 2 shows the measurement setup, performed for an overdetermined set of
N porous woven hose samples which differ in lengths but have the same porosity or weaving/coating structure. In this study, the multiple microphone method [6] was adopted for the direct measurement of in-duct acoustic properties such as TL,τ, RB. Substituting these
measured in-duct acoustic properties into Eqs. (7), (8), (11)~(13), the acoustic impedance can be obtained by using the following least-square technique. It should be recalled that kz is a
function of β, i.e., τis a function of the impedance of porous woven hose. If each of the N data can be expressed by the following data format as
(
1τi,k M L R0, , i, B i)
(i=1,2,L,N), (15)then the problem is to estimate the values of the parameters, which are subject to minimize the following quantity:
(
0)
21 1
; , , , N
i i B i
i i
F βk M L R
τ =
Φ =
∑
− , (16)Here, the parameterβrefers to the ‘population value’ as defined in Eq. (15) and the value of 1/τi=Fi(β;k0,M,Li,RB|i) of the ith specimen refers to the ‘expected value’.
By using the Taylor series expansion near β=β0 and truncating to the linear terms, one obtains
Aδ=Y, (17)
where
0
1
N
F
A
F
β β β
β =
∂
∂
= ∂
∂
M ,
( )
( )
1 0 10 1
1 N N
F
Y
F
β τ
β τ
−
=
−
M , δ β β= − 0. (18a,b,c)
the population value β, indicating the normalized acoustic impedance of porous woven hose, can be obtained [4].
3. RESULTS AND DISCUSSION
Because the range of porous frequency, fp, typically employed in an automotive intake system
is about 100-600 [2], the experiments were performed with samples within this practical range. In the intake system of a typical engine, the mean flow Mach number is usually below 0.1M. Therefore, the experiments were performed using M=0, 0.034, and 0.081 in an anechoic chamber. Figure 2 shows the measurement setup. A signal analyzer (B&K3560) was used to feed the stationary random signal for the acoustic driver mounted at one end of the duct and to calculate the spectra from the measured signals. The acoustic transfer functions were measured with flush mounted 1/4-inch microphones (B&K 4135). The Reynolds number of the flow was of the order of104 at the measurement conditions used and the correlation technique was adopted to suppress the flow-generated noise from the turbulent flow. [6] The reference sound pressure, measured at the microphone position located 1.5 m upstream to the actual measurement sensors, was used as the reference signal, for implementing the correlation technique.
Figure 3 shows the measured impedance by using the aforementioned method with mean flow conditions of M=0, 0.034, and 0.081. These values were measured in the frequency range of 180-1500 Hz because the source power was not sufficient below 180 Hz. In this measurement, two specimens with different lengths of L=300, 393 mm were selected. As can be easily expected, the variation of impedance becomes large, with increasing mean flow velocity. The effect of mean flow on the resistance is significant, particularly in cases of low frequencies, long tube, and high flow velocity. In the presence of mean flow, the resistance becomes small as the frequency increases, whereas the resistance is nearly constant with a change in frequency in the absence of mean flow.
The acoustic impedance for an arbitrary porous frequency can be estimated by curve-fitting the measured impedance data, such as the data in Fig. 3, as a database [1], which makes use of measured impedance data for the conditions of M=0, 0.034, and 0.081, and fp=200, 400, and
600. The fitting function is assumed to have the linear relation among frequency, porous frequency, Mach number, and impedance [1]:
(
)
(
)
{
1 2 3 4}
(
5 6)
(
7 8)
0 0
Re Zp a M a fpREF a M a f a M a fpREF a M a c
ρ
= + + + + + + +
, (19a)
(
)
(
)
{
1 2 3 4}
(
5 6)
(
7 8)
0 0
Im Zp b M b fpREF b M b f b M b fpREF b M b c
ρ
= + + + + + + +
. (19b)
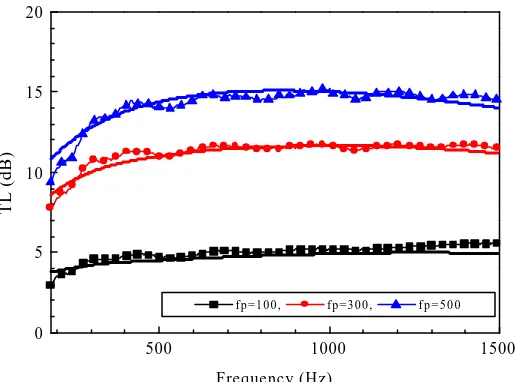
Figure 4 show a comparison of the measured and predicted impedances under arbitrary parameter conditions. A comparison between the predicted and measured TL is shown in Fig. 5 to demonstrate the effectiveness of the proposed technique. As can be observed in Fig. 5, the predicted TL agrees very well with the measured TL, for porous woven hoses at arbitrarily given conditions of length (L=480 mm), porous frequencies (fp=100, 300, 500), and Mach number
(M=0.058).
4. CONCLUSION
This study has focused on improving the inverse estimation method [4] for the acoustic impedance of a porous woven hose in the presence of mean flow. In the inverse estimation method, the acoustics impedance was iteratively estimated in the least-square sense from the overdetermined set of the measured pressure transmission coefficients of the specimens and the reflection coefficient of termination. The other advantage of this measurement method is that the measurement setup could be also used for the direct measurement of transmission loss.
frequency, Mach number, and porous frequency of the porous woven hose is specified, one can easily obtain the acoustic resistance and reactance of a given hose. It was noted that the predicted TL for porous woven hoses of an arbitrary length, arbitrary porous frequencies and arbitrary mean flow condition are in reasonably good agreement with the measured TL values. It is thought that the proposed measurement techniques can be applied to the general acoustic duct system having a compliant wall or having a sound-absorbing wall.
ACKNOWLEDGMENTS
The authors would like to thank Nihon Sekiso Co., Japan, for financial and experimental supports. This work has been also partially funded by the BK21 Project and NRL.
REFERENCES
1. C.-M. Park, J. -G. Ih, Y. Nakayama, and S. Kitahara, Measurement of acoustic impedance and prediction of transmission loss of the porous woven hose in engine intake systems, Applied Acoustics 63, pp.775 794.
2. C.-M. Park, J.-G. Ih, Y. Nakayama, and S. Kitahara, Single-figure Rating of Porous Woven Hoses Using a Nonlinear Flow Resistance Model, To appear in the Journal of Sound and Vibration, 2002.
3. A. Cummings and R. Kirby, Low-frequency sound transmission in ducts with permeable walls, Journal of Sound and Vibration 226, 237-2521, 1999.
4. J.-G. Ih, C. -M. Park, Y. Nakayama, S. Kitahara, and H. Takao, “An inverse measurement of acoustic impedance of porous woven hoses in engine intake systems,” To be presented at the Inter Noise 2002, August 2002, Detroit, USA.
5. M. L. Munjal, Acoustics of Ducts and Mufflers, John Wiley & Sons, New-York, 1987.
6. S.-H. Jang and J.-G. Ih, On the multiple microphone method for measuring in-duct acoustics properties in the presence of mean flow, J. Acoust. Soc. Am. 103, 1520-1526, 1998.
PB +
PB -Pp
+
Pp
-A A' B' B
z=L
2ri 2r
Porous woven hose Connected pipe
"Region A"
Connected pipe "Region B"
PA +
PA
-z=0 z
[image:5.596.147.451.416.515.2]M
Fig. 1. The sound field in the porous duct system. Pressures designated with the superscript '+' denotes the positive-going (i.e., downstream) waves and those with '-' denotes the negative-going (i.e., upstream) waves. M denotes the flow Mach number.
L
Termination Sound
source
M
1/4" microphones (B&K 4135) Analyzer
(B&K 3560)
Signal generator
Specimen ...
[image:5.596.137.459.586.718.2]( a ) ( b )
Fig. 3. An example of measured acoustic impedance of porous ducts varying the mean flow conditions (fp=300). (a) Resistance, (b) reactance.
[image:6.596.89.508.302.456.2]( a ) ( b )
Fig. 4. A comparison of the measured impedance and the predicted one by using the curve fitting model. Symbol and thin line, measured impedance; thick line, predicted impedance for
M=0.058. (a) Resistance, (b) reactance.
Fig. 5. A comparison of the measured and predicted transmission loss (TL): Prediction was made by employing the calculated impedance from the the curve fitting model. Symbols, measured TL; thick solid lines, predicted TL (M=0.058, 2ri=55 mm, L=480 mm).
500 1 0 0 0 1 5 0 0
0 5 10 15 20
M = 0
M = 0 . 0 3 4 M = 0 . 0 8 1
Re(
Zp/
ρ0 c0
)
F r e q u e n c y ( H z )
5 0 0 1 0 0 0 1 5 0 0
0 2 4 6 8
M = 0
M = 0 . 0 3 4 M = 0 . 0 8 1
Im(
Zp/
ρ0 c0
)
F r e q u e n c y ( H z )
500 1 0 0 0 1 5 0 0
0 5 10 15 20 25
30 , f p = 1 0 0
, f p = 3 0 0
, f p = 5 0 0
Re(
Zp/
ρ0 c0
)
F r e q u e n c y ( H z )
500 1 0 0 0 1 5 0 0
0 2 4 6 8 10
12 , f p = 1 0 0 , f p = 3 0 0
, f p = 5 0 0
Im(
Zp/
ρ0 c0
)
F r e q u e n c y ( H z )
500 1000 1500
0 5 10 15 20
f p = 1 0 0 , f p = 3 0 0 , f p = 5 0 0
TL (dB)
[image:6.596.171.432.518.709.2]