Contents lists available atScienceDirect
Energy Strategy Reviews
journal homepage:www.elsevier.com/locate/esr
Dynamic Energy Return on Energy Investment (EROI) and material
requirements in scenarios of global transition to renewable energies
Iñigo Capellán-Pérez
a,b,∗, Carlos de Castro
a,c, Luis Javier Miguel González
a,baResearch Group on Energy, Economy and System Dynamics, Escuela de Ingenierías Industriales, Paseo del Cauce s/n, University of Valladolid, 47011 Valladolid, Spain bDeparment of Systems Engineering and Automatic Control, Escuela de Ingenierías Industriales, Paseo del Cauce s/n, University of Valladolid, 47011 Valladolid, Spain cDeparment of Applied Physics, Escuela de Arquitectura, Av Salamanca, 18, University of Valladolid, 47014, Valladolid, Spain
A R T I C L E I N F O
Keywords:
Energy return on energy investment Transition to renewable energies Energy trap
Green growth
Integrated assessment modelling
A B S T R A C T
A novel methodology is developed to dynamically assess the energy and material investments required over time to achieve the transition from fossil fuels to renewable energy sources in the electricity sector. The obtained results indicate that a fast transition achieving a 100% renewable electric system globally by 2060 consistent with theGreen Growthnarrative could decrease the EROI of the energy system from current ~12:1 to ~3:1 by the mid-century, stabilizing thereafter at ~5:1. These EROI levels are well below the thresholds identified in the literature required to sustain industrial complex societies. Moreover, this transition could drive a substantial re-materialization of the economy, exacerbating risk availability in the future for some minerals. Hence, the results obtained put into question the consistence and viability of theGreen Growthnarrative.
1. Introduction
The transition from fossil fuels to Renewable Energy Sources (RES) is an indispensable condition to achieve sustainable socio-economic systems. Despite their indisputable environmental and social benefits (e.g. lower pollution [1]) and the possibility to be managed at local, participative level [2], the technical performance of RES technologies can be, in some cases, worse than those of fossil fuels. In fact, fossil fuels are characterized by favourable physical-chemical properties (e.g. high power density, storable, inert at standard ambient conditions, etc.) that allow manageable, high-quality energy flows to easily supply human societies on demand. In contrast, RES technologies generally require more land surface (i.e. lower power density [3–5]), their use competes with other processes of the biosphere, while those with a higher po-tential (i.e. wind, solar) are critically affected by their intermittence and variability [4,6,7] and have been generally found to have lower Energy Return on Energy Invested (EROI), the energy delivered from a process divided by the energy required to get it over its lifetime, than fossil fuels [8,9] (see eq.(1)).
=
EROI energy returned
energy invested (1)
=
Net energy energy returned
EROI
• 1 1
(2) Hence, in the context of the forthcoming energy transition, considering the energy investments related with the construction and operation of the new RES power plants, as well as the implications on the full system, represents a number of advantages in energy system analysis in relation to the conventional approach disregarding this factor [10]:
•
From a societal/metabolic point of view, the relevant dimension is the energy available to the society (Net energyin eq.(2)), not the energy produced by power plants (energy returnedin eq.(2)). In fact, a favourable EROI over the long-term (energy surplus) has been associated in fields such as biology or anthropology as a key driver of increasing complexity and evolution for plants, animals and hu-mans [11–14].•
From a technical point of view, the EROI metric includes factors that affect the whole energy system that are not captured by the mone-tary costs of individual power plants (such as the additional costs for the system related with distribution, intermittency of RES, etc.). In fact, the energy transition to new energy resources and new energy conversion and storage devices will affect the fraction of energy reinvestment, which may have significant economic impacts [10,15–21].https://doi.org/10.1016/j.esr.2019.100399
Received 26 September 2018; Received in revised form 23 July 2019; Accepted 30 July 2019
∗Corresponding author. Research Group on Energy, Economy and System Dynamics. Escuela de Ingenierías Industriales, Paseo del Cauce s/n, University of Valladolid, 47011 Valladolid, Spain.
E-mail address:[email protected](I. Capellán-Pérez).
•
Computing the EROI of each technology endogenously and dyna-mically makes it possible to detect potential harmful situations of increasing gross energy output while decreasing the net energy de-livered to the society, i.e. the so-called “energy trap” [21–23]. The relationship of EROI to net energy is non-linear, and consequently its impact can potentially be misjudged. In extreme cases, a too low EROI, even if the gross energy consumption is increasing, may even trigger a collapse of the full system. In this sense, the net energy approach makes it possible to endogenize the concept of minimum EROI for maintaining the level of prosperity of a given society [19,24].Much work has been carried out to estimate the EROI of individual RES technologies (e.g. Refs. [9,25–31]); however important differences exist depending on the technology, system design and location, and the field is plagued with methodological discrepancies related with the functional units (e.g., a megajoule of heat energy versus a megajoule of grid electricity) or the boundaries of the analysis (i.e. mine-mouth vs end use or energy technology vs energy system) [27,30,32–36]. In re-lation to the boundaries of the analysis, different EROI categories have been defined [9]1:
•
Standard EROI (EROIst): it includes the on-site and offsite (i.e., energy needed to make the products used on site) energy require-ments to get the energy (e.g. build, operate and maintain a power plant). This EROI calculation is applied to fuel at the point where it leaves the extraction or production facility (well-head, mine mouth, farm gate, etc.). This approach allows for the comparison of dif-ferent fuels even when the analysts do not agree on the rest of the methodology that should be used [37].•
Point of Use EROI (EROIpou): it includes the energy costs to get anddeliver the fuel to the point of use of society (e.g. refinement, transportation, etc.).
•
Extended EROI (EROIext): it considers the energy required to get, deliver and use a unit of energy, i.e. the energy required to produce the machinery and devices used to build, operate and maintain a power plant or a transportation facility (tank truck, pipeline, etc.) as well as the energy required for exploration, investment, commu-nication, labour, etc. in the energy system.As the boundaries of the analysis are expanded, the energy cost of getting it to that point increases, resulting in a reduced EROI (EROIst > EROIpou > EROIext). In parallel, the complexities and uncertainties to estimate each EROI category also increase by ex-panding the boundaries.
Thus, it is of key importance to understand both the socioeconomic and technical consequences of the large-scale replacement of fossil fuels with RES. In this sense, it is important to properly estimate the future trends in the EROI of future energy fuels, and in particular of renewable energy systems, which will be affected by factors of opposite sign: on the one hand, the EROI may increase due to technological innovation (not to confound with learning rates (e.g. Ref. [38])) or improved mi-neral recycling rates. On the other hand, different factors will tend to decrease the future EROI of the system, such as the need for increased back-up generation, grids and storage [8,31,39,40], the increase in energy requirements due to the ore decrease of minerals [41,42], the need to allocate increasing resources as defensive expenditures to adapt and overcome climate change impacts [43,44], etc.
The literature review reveals that recent work has been directed to estimate the historic evolution of EROI of existing national energy systems and fossil fuel extraction. A diversity of methodologies is being applied. In relation to the estimation of the historic evolution of the EROI of national energy systems, Lambert et al. [45], developed a proxy method to estimate the standard EROI of a country including all do-mestic and imported energy fuel sources that a nation uses, considering that there is a relation between EROI and fuel prices. The method was then applied to numerous countries, finding a wide range between 5:1 and 40:1. Brand-Correa et al. [46], estimated the evolution of the EROI Abbreviations
BAU Business-as-usual
CED Cumulated Energy Demand CF Capacity factor
CSP Concentrated Solar Power Dmnl Dimensionless
EnU Energy Used
EROI Energy Return On energy Invested EROI FC EROI system feedback factor ESOI Energy Stored On energy Invested EV Electric Vehicle
FEI Final Energy Invested GCF Grid correction factor GDP Gross Domestic Product
GDPpc Gross Domestic Product per capita GG Green Growth
GHG Greenhouse gas
HVDC High-voltage Direct Current
IPCC Intergovernmental Panel on Climate Change LCA Life-cycle analysis
MEDEAS-W MEDEAS-World model OEU Own-energy use
OG Overgrids
O&M Operation and maintenance PHS Pumped hydro storage
PV Photovoltaic
RCP Representative Concentration Pathway RES Renewable Energy Source
SC Self-consumption
SSP Shared Socioeconomic Pathway TFEC Total Final Energy Consumption TFEI Total Final Energy Investment TFES Total Final Energy Supply USGS United States Geological Service WIOD World Input-Output Database
Glossary
Capacity factor (CF) the ratio of the actual electrical energy output over a given period of time to the maximum possible electrical energy output over the same period.
Energy Used (EnU) energy use throughout the life cycle of a pro-duct, including the energy consumed during the extrac-tion, manufacturing, and disposal of the raw and auxiliary materials
Energy return on energy invested (EROI) ratio between the energy delivered from a process divided by the energy required to get it over its lifetime.
Energy stored on energy invested (ESOI) ratio between the energy stored in a storage device divided by the energy required to get it over its lifetime.
1Charles Hall, the originator of the term if not the concept of EROI, believes
of UK developing a novel method combining physical and monetary data using Multi-Regional Input-Output data and an energy extension, finding that the EROIext of the country has declined from ~14:1 in 2000 to below 6:1 in 2012 (with an equivalent EROIst of 17:1 and 9:1, respectively). Court & Fizaine [47] applied a price-based methodology to assess the historical global EROI of fossil fuels' production finding for oil and gas it is declining since the in the 1930s–40s and for coal it is still increasing. Celi et al. [48], estimated the EROI of large oil and gas corporations from their legally-mandated estimates of CO2 released. All of these methods give broadly similar results and all indicate that at the point of production fossil energies tend to be declining but still higher than renewables [9,36,49,50].
In relation to the estimation of the EROI of the system associated to high RES penetration scenarios, Trainer [51], considering usual EROIst values by technology from the literature, estimated at 5.9:1 the EROI of the electricity system of Australia associated with the 100% renewables electricity mix proposed by Lenzen et al., [52]. Limpens & Jeanmart [53] developed a novel and more sophisticated approach in which the maximization of the EROI of the Belgian electricity system allows them to find an optimal mix of generation and storage technologies (pumped hydro storage, batteries and power to gas) with 1 h resolution. The found values for the EROI of the system range 9.7:1 (“net EROI” fol-lowing their nomenclature) for a penetration of RES of 20%, and de-crease to 5.4:1 for 100%. Palmer [20] developed a framework for es-timating EROI of energy systems including storage options, and Barnhart et al. [15], included both storage and curtailment. The GEMBA model [54] considers a dynamic function over time of the EROI of each renewable and non-renewable resources, assuming a peaking function which is a product of two components: one technological that serves to increase energy returns as a function of production (which may serve as a proxy measure of experience), i.e. technological learning; and the other diminishing energy returns due to declining physical resource quality (for more details see Ref. [55]). The main finding of the GEMBA model is that growth of the renewable energy sector may impact investment in other areas of the economy and thereby hinder economic growth.
The aforementioned studies typically apply the EROI as a static concept, i.e. assuming that the energy invested is proportional to the energy obtained along the lifespan of the functioning power plant. This assumption holds only if the system is in “steady state”, which by de-finition does not correspond with energy transition contexts. New power plants require upfront energy investments, providing energy returns only over the lifespan of the facility. Hence, this representation captures the negative implications of potential “energy trap” scenarios. In this sense, different works have focused on the dynamic integration of EROI to obtain more realistic results [21,22,56–58]. Sgouridis et al. [58], build a global energy model dynamically accounting for the up-front energetic costs of solar CSP, solar PV and wind based on standard EROI values from the literature, and focused on the estimation of the optimal growth rate of these technologies to achieve system dec-arbonisation and providing a certain level of per capita net energy available to society. Sers and Victor [21] construct a model that in-cludes the EROI metric (considering a decline with cumulated installed capacity) and the energy characteristics of renewable generation into a macroeconomic framework, finding that renewable investment rate has the potential to crowd out other forms of investment leading to a de-clining economic growth rate in scenarios of strong emissions mitiga-tion as the ones required to avoid dangerous climate change (in ac-cordance with GEMBA's [54] results). King and van den Bergh [59] analysed the implications in terms of net energy use of the scenarios proposed by the IEA & IRENA [60] (framed in gross energy), con-sidering a range of EROI for energy technologies, identifying a potential “energy trap” scenario when considering EROI of technologies from the lower range of the literature. Additionally, they analysed the additional growth of solar and wind to maintain the present net energy returns, concluding that these power sources should grow two to three times
faster than in other proposals not considering these energy investments. This paper describes the methodology applied to represent the im-plications that the future energy investments to achieve the transition to RES may have for the full system in the simulation model MEDEAS-World (MEDEAS-W). This model is a global energy-economy-environ-ment system dynamics model focused on the biophysical and economic dimensions and interactions arising during energy transitions [61,62]. The proposed approach includes 3 key novelties which go beyond the current state-of-the-art of the field by including:
1. Dynamic and endogenous calculation of the EROIst of each RES variable technologies for electricity generation computing the re-quired up-front energetic costs taking as a starting point the mate-rials required in the construction, operation, maintenance and dis-mantling phases and combining this data with the energy consumption per unit of material consumption from Life Cycle Analysis (LCA). For RES dispatchables, i.e., those can be used on demand, a static approach considering the EROI over the lifetime is taken.
2. Dynamic and endogenous computation of the EROIst of the whole energy system. Given that in energy systems the operating tech-nologies are complementary and dependent, it is not possible to allocate accurately the requirements of overgrids, storages and overcapacities to any specific technology given that they are af-fected by different variability patterns [51]. Hence, it is not totally correct to estimate the EROI of full energy systems by using esti-mates of “buffered” EROIs for each individual renewable technology (as done for example by Refs [3,27,31] including works from some authors of this paper, although this approach may be useful for other purposes such as identification of the implications for intermittency management that these technologies introduce in the system). In this work a step further is performed in relation to previous works by jointly considering the implications of complementarity and in-termittence of different RES sources for the EROI of the system. This way, the required overcapacities, storage and overgrids are not as-signed to a particular technology but to the whole energy system. 3. Incorporation of the implications of the variations in the EROI of the
system for the whole system due to the use of an energy-economy-environment model with interlinks between different dimensions allowing to account for the net energy actually available for the society.
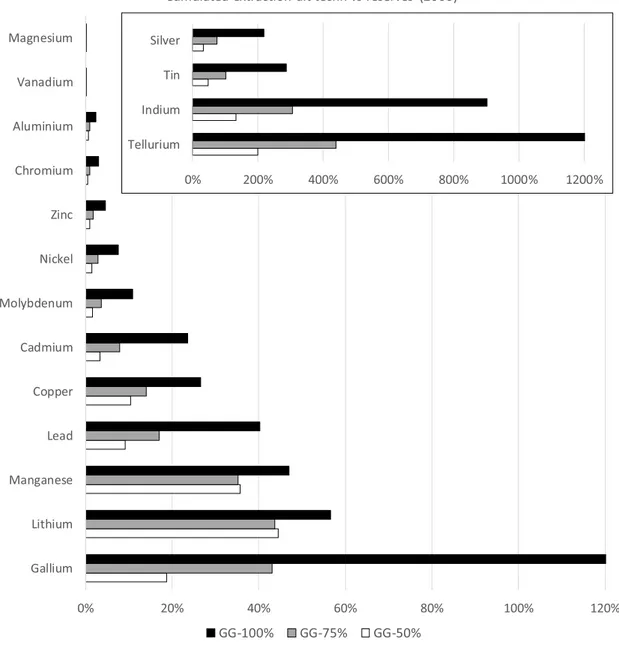
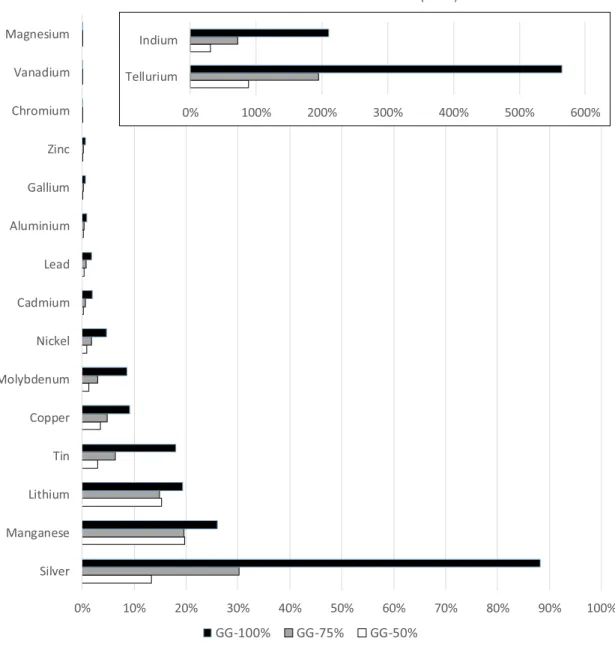
related with the expansion of alternative energy technologies. This as-sessment is of great importance given recent works highlighting the dependence of the current economic system and alternative technolo-gies on minerals [64–67,72–75]. In particular, García-Olivares et al. [74], proposed a global alternative mix to fossil fuels based on proven RES technologies, power transport and for some future transport sys-tems not relying on scarce materials. They found that the proposed alternative would still be strongly constrained by the availability of metals such as lithium, nickel, zinc and platinum; requiring 60–70% of the copper reserves. Valero et al. [64], analysed potential bottlenecks for 31 raw materials in the 2016–2050 time period under a business as usual scenario for wind power, solar photovoltaic, solar CSP and pas-senger electric vehicles, identifying 13 elements having very high or high risk: cadmium, chromium, cobalt, copper, gallium, indium, li-thium, manganese, nickel, silver, tellurium, tin and zinc. Although this work is focused on the implications of the energy transition on the EROI of the system, it also contributes to this emerging research topic high-lighting the vulnerability due to the potential scarcity of some minerals. The importance of dynamic and endogenously computing the en-ergy and material investments is illustrated by the simulation within the integrated assessment model MEDEAS-W of three scenarios with different targets of penetration of renewables in the electricity mix to 2060 under a Green Growth narrative (GG), which is an alternative paradigm frequently assumed to avoid the adverse impacts on human societies of the global environmental change [76–81].
The remaining of the paper is structured as follows: section2 de-scribes the applied methodology to integrate the material and energy investments related with renewable for electricity generation in ME-DEAS framework; section3describes the scenarios applied and section 4reports and discusses the obtained results. Section5concludes.
2. Methodology
MEDEAS dynamically computes the EROI2of the full energy system and its feedback to the energy demand, acknowledging that the system boundary also varies along the temporal dimension [22,37,56]. The EROI of the system is estimated using information from literature re-view and LCA to dynamically account for the up-front costs of the en-ergy investments and the delayed return of enen-ergy generation for the renewable technologies for electricity generation (taking as starting point the level of materials required in the construction, operation, maintenance and dismantling phases), and assuming constant the EROI of the rest of fuels (non-renewables and non-electric RES).
Section2.1documents the methodology to compute the EROIst of the system, section 2.2documents the dynamic expression of EROIst applied, together with the specification of factors required for its cal-culation. Section 2.3is focused on the methodology to feedback the EROI variation into the rest of the MEDEAS-W model, which is over-viewed inAppendix A.
2.1. EROI of the energy system
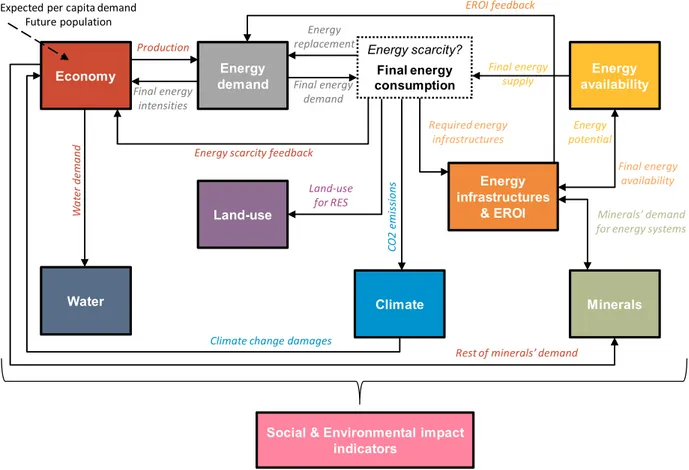
Fig. 1represents the energy metabolism of our society with different energy flows and conversions, from primary sources to the energy de-livered to society. Each arrow fromFig. 1represents:
(0) Primary sources of energy available to society (1) Useful energy used by society
(2) On-site and offsite (i.e., energy needed to make the products used on site) energy requirements to build, operate, maintain and dis-posal the plant of energy generation.
(3) Additional energy requirements so the system properly manages RES intermittency
(4) Energy used for the distribution of energy
(5) Energy requirements to build the machines and infrastructure re-quired to construct the machines and infrastructure which allows to make the energy investments (2), (3) and (4) (i.e., indirect energy costs [36,37,46,47]).
The dynamic EROIst of the system is defined in this work following eq.(2)of Murphy et al. [37], as the ratio between the final energy delivered to society and two factors: the energy requirements to build, operate, maintain and dispose the plant of energy generation; and the energy requirements so the system properly manages RES intermittency (EROIsystemst , eq.(3)). Our dynamic approach shortens the time step of the calculations significantly (in the order of months), with relation to conventional EROI studies, where the lifetime of the technology is the usual operational unit of the analysis:
= +
EROI (1)
(2) (3) systemst
(3) Note that for an individual technology, its EROIst is usually defined in the literature as (1)/(2) (e.g. Refs. [27,35]).
If extending the boundaries, i.e., including more factors such as the energy required for the distribution of the final energy to the point of use, the EROI of the system from a “point of use” approach (EROIsystempou ,
eq.(4)) can be defined as follows: =
+ +
EROI (1)
(2) (3) (4)
systempou
(4) A step further would be to account for the total energy requirements (5, seeFig. 1) to make the energy investments (2), (3) and (4). This way we would arrive to an “extended” definition of the EROI of the system:
=
+ + +
EROI (1)
(2) (3) (4) (5)
systemext
(5) The resulting net energy available (pou) to society can be obtained as shown in eq.(6):
= + +
Net Energypou (1) (2 3 4)) (6)
Discretionary uses of the energy, i.e., the uses of energy not related with the energy system, are:
=
= + + +
Discretionary energy uses Net energy (5) (1) [(2) (3) (4) (5)]
pou
(7) To be viable, any system requires that Net Energy > 0. Additionally, any complex system requires that discretionary energy uses > 0 in order to allow for the system to have energy available for other uses than self-maintaining the system.
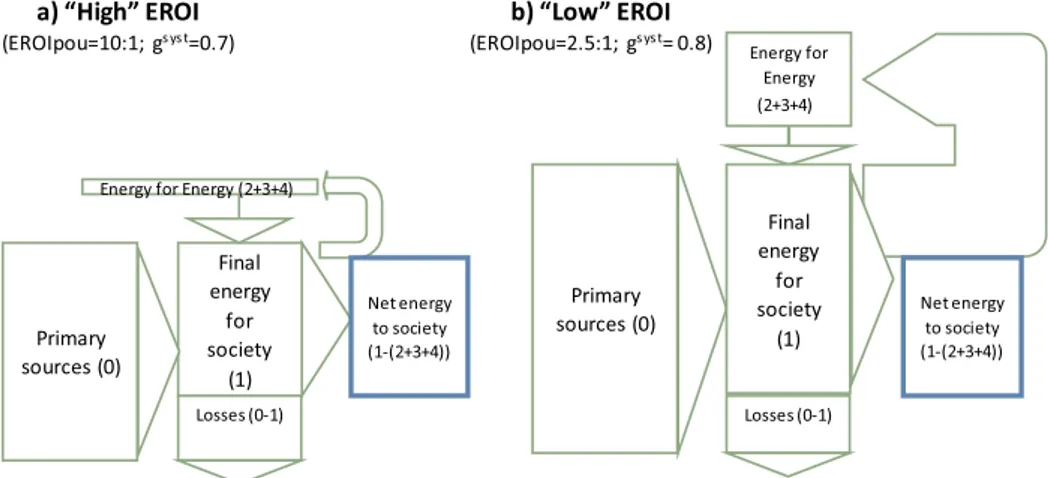
What are the implications of different EROI of the system levels for the net energy and discretionary uses delivered to society?Fig. 2 re-presents at scale the energy flows to deliver the same net energy to society associated to a “high” (EROIpou = 10:1) and “low” (EROIpou = 2.5:1) EROIpou of the system, respectively. At “high” EROI system levels, the energy investments for delivering energy to the consumers are relatively small, and there is not a large difference be-tween final and net energy delivered to society. However, maintaining the same level of net energy delivered to society at “low” EROI system levels, the energy investments have reached such a relative size that the primary energy supply has to increase substantially (hence increasing the associated environmental impacts), even if the losses decrease. In
2Note that dynamically accounting for energy magnitudes corresponds with
the case of accounting for (5), the discretionary energy uses for society would be even smaller.
As aforementioned, ideally, the concept of EROIext should be used when assessing systemic implications of the variation of EROI over time. However, the practical estimation of EROIext is very complex and subject to many uncertainties. To date, few studies have attempted to evaluate it estimating the economic costs associated with the con-struction of the energy system, and using average energy intensities to transform monetary costs to energy inputs (e.g. Refs. [30,32]). This methodology and their results are disputed by other authors given the uncertainties in these calculations [35,83]. The EROIpou of the system also faces methodological challenges given the difficulties to con-sistently estimate the energy investments associated with the trans-portation of energy vectors, such as pipelines, electric grids, fuels for tank trucks, oil tankers and gas tankers, but also the share attributable to energy distribution of energy investments to build and maintain roads, railways and other transportation methods which have double uses [19]. Acknowledging the difficulties to compute the EROIext based solely in physical terms (i.e. avoiding the controversy of the energy intensities methodology) as well as the EROIpou, a first step, con-servative approach, is taken in this work estimating the EROI of the system from a standard (EROIsystemst ) approach.
The following assumptions are taken to compute theEROIsystemst in this work:
•
The EROIst of non-renewable energy sources (oil, gas, coal and ur-anium) is assumed to be constant over time. Given that in the long term the EROI of these fuels will tend to decrease due to geologicaldepletion (as recent analyses are pointing out that it is already the case for fuels such as oil and gas, trends exacerbated by the growing exploitation share of unconventional fuels characterized by lower EROI [9,49,50]), this simplification can be considered as con-servative.
•
The EROIst is dynamically estimated for renewable technologies for the generation of electricity (see section2.2). The EROIst of other renewables such as liquid biofuels or technologies for heat genera-tion is considered to be constant over time.•
Option of allocation of technologies based on their relative EROIst buffered with energy investments to manage intermittency (RES technologies with a higher EROI tend to cover a larger share of the energy demand) (see Supplementary Online Material).•
Overcapacities and overgrids3related to the increasing penetration of variable renewable technologies in the system are endogenously computed in the model (see Supplementary Online Material). Overcapacities reduce the effective capacity factor of each tech-nology (CF, i.e., the ratio of the actual electrical energy output over a given period of time to the maximum possible electrical energy output over the same amount of time), which also reduces its EROI. The demand of materials for overgrids (high power and HVDC) is Fig. 1.Representation of the energetic metabolism of our society. Grey arrows refer to energy flows that are useable by human societies. The black arrow on the left-hand side (0) is a flux of materials with potential energy which can be transformed into useable energy. Dashed vertical arrows represent energy losses at each phase of the chain (transformation, storage and distribution losses). An exo-somatic intermediary (arrows 2, 3, 4 and 5 representing energy investments) is always required to transform the poten-tial energy into useful exosomatic energy useable by the society (1) (excluding non-energy uses). White colour refers to the anthroposphere and black colour to the biosphere which encompasses it. The thin arrow between “Intermittency RES” and “Transport of energy vectors” represents the fact that the electricity transmission and distribution losses are dependent on the share of RES in the electricity mix. (Size of arrows is not to scale).Fig. 2.Representation at scale (vertically) of the energy flows associated to the same level of net energy delivered to the society in the case of: (a) “High” EROI (EROIpou = 10 and gsyst= 0.7); and (b) “Low” EROI (EROIpou = 2.5 and gsyst= 0.8). Numbers refer to nomenclature inFig. 1.
3Overgrids related to the increasing penetration of variable renewable
modelled as an additional component of the material intensity (kg/ MW) of the construction of new capacity for each RES variable technology (as described in section 2.4.4.1 in Capellán-Pérez et al. [61]).
•
Additional losses due to storage use are modelled following Barnhart et al., [15]. The reduction of EROIst at grid scale depends on the ratio of electrical energy stored over the lifetime of a storage device to the amount of embodied electrical energy required to build the device (i.e. an analog to EROI for storage technologies, the Energy Stored on Energy Invested (ESOI)); the stored fraction ( ) energy that would have been curtailed without storage and the efficiency of the electric storage (η). The following eq.(8)represents the EROIst at grid scale for a given RES variable technology i.= +
+ EROIstigrid 1 i i c
EROIst ESOI 1
i i c
c (8)
ηcrepresents the combined storage efficiency of PHS and EV batteries and ESOIcrepresents the combined energy stored on electrical energy
invested of PHS and EV batteries. is fixed at 20% for the sake of simplicity4.
Points 1 and 2 are modelled assuming that the ratio of energy in-dustry own-energy use in relation to the total final energy consumption (excluding non-energy uses and the electricity generated by renewable technologies) is constant over time (data from IEA Balances [84]).
Summarizing, MEDEAS dynamically accounts for the EROIst of the system (dimensionless units) as follows (eq.(9)):
=
+ +
EROI t TFEC t
g t OEU t TFEI t TFEI t
( ) ( )
( )•( ( ) ( ) ( ) )
system st
syst
RES elec storage elec (9) TFEC: total final energy consumption (excluding energy materials for non-energy uses).
TFEIRES elec: total final energy investments for renewable
technolo-gies of electricity generation (construction, replacements, operation and maintenance, decommissioning and overgrids).
TFEIstorage elec: total final energy investments for storage of
elec-tricity.
OEU: Energy industry own energy use. For the historic period, it corresponds with the TOTENGY5category in the IEA World Energy Balances [84], of the total final energy consumption excepting the electricity generated by renewable technologies to avoid double accounting. For projections, the ratio between OEU and TFEC (ex-cepting the electricity generated by renewable technologies) for the year 2015 is maintained into the future (10.5%).
gsyst: final to primary energy ratio (1)/(0) (see Fig. 1). Different
authors use different criteria for the value of g depending on the assumption about the quality of the electricity in relation to the rest of the energy consumed [27,30,31,40]. However, all values con-sidered are static. Given that we are projecting the evolution of the EROI in changing energy mix, an alternative approach had to be developed. Since we start for the calculation of the EROI from the final energy (1) (see eq.(3)) and the electricity is not the only final form of energy in the system, it is inferred that to give the same energy services to the society, less final energy (1) will be required as the system evolves towards sources of greater exergy (e. g. the share of electricity in the full energy mix increases). To be able then to compare between evolving energy systems, we follow the
approach developed by de Castro and Capellán-Pérez [27] and compute gsyst(t) as the dynamic ratio between the total final energy
consumption and the total primary energy supply (excluding the energy dedicated to non-energy uses) in the whole system. Hence, the dynamic implementation in a full energy model allows to en-dogenize the gsystfactor dynamically, given that the transformation
of primary energy to final energy will change during the transition to renewables. gtechn= 1 is defined for the computation of the EROI
of each of the renewable technologies for the generation of elec-tricity (see section2.2).
SeeAppendix A for an overview of the modelling framework of MEDEAS.
2.2. Modelling of the dynamic EROIst of RES technologies for electricity generation
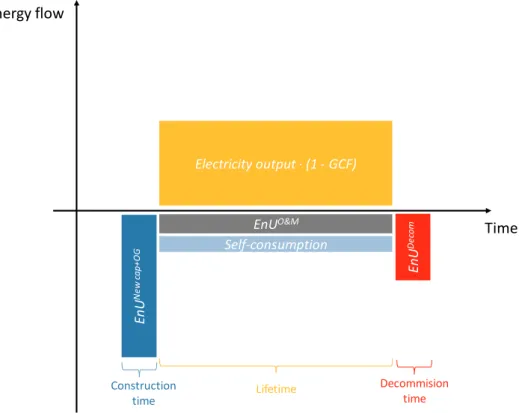
The construction of power plants requires a large upfront energy investment, providing energy returns only over the lifespan of the fa-cility partially compensated by the energy requirements of the opera-tion and maintenance (O&M) activities, which is ultimately followed by another phase of energy investment for decommissioning of the facility. In cases where the information about the energy required in each phase is available, a dynamic approach can be applied for the estimation of the EROI of the technology [22,56,58]. Otherwise, a static approach assuming that the energy invested is proportional to the energy ob-tained along the lifespan of the functioning power plant has to be adopted.
Given the difficulty and time-intensiveness to estimate the energy and material requirements for all the alternative energy technologies, a selection was performed. This way, the scalable RES for electricity generation were selected (solar PV, solar CSP, wind onshore, wind offshore; note that these are variable intermittent RES), as well as the electric storage and overgrids requirements. The energy requirements for the construction of the rest of RES technologies for electricity gen-eration (which correspond to the dispatchable technologies: hydro-electricity,6geothermal, biomass&waste and oceanic7) as well as other storage systems such as pumped hydro storage were also included but in a simplified (static) manner. For the sake of simplicity, all the esti-mates considered have been derived from physical inputs excluding indirect estimates based on associated economic costs.
To estimate the EROI of RES technologies for electricity generation we apply the classic definition of standard EROI [9] assuming gtechn= 1. Eq.(10)shows the EROI (dimensionless units) for a given
energy supply infrastructure of technology i over its whole lifetime (L) defined from a “static” perspective. Eq.(11)shows the expression of the annual electricity output:
=
=
+ + + +
+ + + +
EROIi Annual elec outputi GCF Li
EnUiNew cap OG EnUiDecom wear cap EnUiO M Li gtechn Annual elec outputi Li SCi Annual elec outputi GCF Li
EnUiNew cap OG Decomm EnUiO M Li gtechn Annual elec outputi Li SCi
• (1 ) •
& • • • •
• (1 ) •
• (1 ) & • • • •
(10)
4This factor is exogenously set ad hoc to 0.2 in all simulations. Sensitivity
analysis showed that results are not sensitive to this factor. Sgouridis et al. [58], consider a similar (ad hoc) value of 10% for this parameter.
5TOTENGY covers the amount of fuels used by the energy producing
in-dustries (e.g. for heating, lighting and operation of all equipment used in the extraction process, for traction and for distribution).
6The intermittence and seasonal variability of the rains, as well as the
re-quirements of other water resources such as irrigation, may limit the capacity of hydroelectric energy to be considered as 100% dispatchable. This limitation has not been considered.
7A great diversity of marine technologies exists and some of them could be
=
Annual elec output CF Installed new cap h
yr
• •8760
i i i (11)
i: electricity generation technology.
Annual elec output: Annual electricity output. CF: capacity factor.
Installed new cap: installed new capacity. L: lifetime of the installed infrastructure.
EnUNew cap+OG: energy used in the construction of new capacity and
overgrids for RES variables (EnU in this work corresponds to “Cumulative Energy Demand” (CED) in most EROI-related litera-ture, see section2.2.2.2for clarification).
EnUDecom wear cap: energy used for decommissioning those
infra-structures that have ended their lifetime. We assume a fixed share in relation to the EnU of the energy required for the construction of each power plant of 10% following Hertwich et al., [86], i.e. De-comm = 0.1.
GCF: Annual losses due to the Joule heating within each power plant (grid-correction factor) as a share of total annual electricity output. This is endogenously calculated by the model as distribution and transmission losses (see Supplementary Online Material).
EnUO&M: annual energy used for the operation and maintenance.
SC: electricity self-consumption of the power plant as a share of the electricity output.
Eq.(11)can be simplified removing the annual installed electricity capacity and expressing the EnU as energy per installed capacity (eq. (12)):
= =
+ +
+
+
EROI CF GCF L
EnU per TW Decomm EnU per TW L
g CF L SC
•(1 )•8760 •
( •(1 ) • )
• •8760 • •
i
i yrh i
iNew cap OG iO M i
techn
i yrh i i
&
(12)
2.2.1. Static expression of EROIst for RES dispatchable technologies
Eq.(12)can be directly applied for those technologies of electricity generation for which the material requirements for both new installed capacities and O&M are explicitly modelled since MEDEAS dynamically estimates their EnUNew cap+OGand EnUO&M(see section2.2.2).
How-ever, given that these data are not available for the dispatchable tech-nologies, the static approach of EROI has to be applied instead for hydroelectricity, geothermal, biomass&waste and oceanic.
For this, some assumptions have to be made in order to adapt eq. (10)(in combination with eq.(11)): that the O&M are independent of the CF and the self-consumption losses are negligible. The current total EnU per capacity (EJ/TW) for each technology i over the lifetime of the infrastructure is then (eq.(13)):
=
Total EnU per TW over lifetime CF L EJ per TWh
EROI g
• •8760 • •
i
iinitial i yrh
iinitial techn
(13) CFinitialrefers to the initial (current) capacity factor for each
tech-nology (without accounting for eventual decreases due to over-capacities).
EROIinitialis the initial (current) EROI level associated to the initial
(current) capacity factor. This EROI level is conservatively considered constant8(seeTable 1).
Thus, once estimated the current total EnU per TW for each tech-nology, and assuming that its value will remain constant during the
timeframe of MEDEAS, the evolution of EROI over time of the dis-patchable electricity generation sources can be expressed by eq.(14). Note that, despite being defined following a “static” approach, the EROI can still evolve over time considering the evolution over time of the capacity factor of each technology CFi(t) (which depends on the level of
overcapacity, see Supplementary Online Material):
=
EROI t CF t L EJ per TWh
Total EnU per TW over lifetime g
( ) ( )• •8760 •
• i
i i yrh
i techn (14)
2.2.2. Dynamic expression of EROIst for RES variable technologies
Eq.(12)can be directly applied for those technologies of electricity generation for which the material requirements for both new installed capacities and O&M are explicitly modelled since MEDEAS dynamically estimates their EnUNew cap+OGand EnUO&M(see section2.2.2).Fig. 3
shows the conceptual representation of the energy inputs and output for power plants for variable renewable electricity generation considered in MEDEAS framework which correspond with the RES variables: solar PV, solar CSP, wind onshore and wind offshore.
Hence, the EROI for these technologies the EROI can be en-dogenously and dynamically estimated in the model for each time period t (i.e. independently of the lifetime of the infrastructure), see eq. (15):
=
+ +
+
+
EROI t Annual elec output t GCF t EJ per TWh
EnU t EnU t EnU t
g Annual elec output t SC
( ) ( )•(1 ( ))•
( ( ) ( ) ( ))
• ( )•
i i
iNew cap OG idecom wear cap iO M techn
i i
&
(15) EnUNew cap+OG(t) and EnU
O&M(t) depend on the recycling rates of
the minerals.
EnUdecom wear cap: assuming that the energy used for
decom-missioning electricity plants is 10% of the energy required for its con-struction [86], the dynamic expression of the EnU for decommissioning power plants would thus be:
= +
EnU t EnU t wear cap t
Installed new cap t
( ) 10%• ( )• ( )
( )•
idecom wear cap iNew cap OG i
i
(16)
2.2.2.1. Demand of materials for each technology. The demand of materials in MEDEAS-W is split in 2 categories: (1) materials demanded by alternative technologies for the energy transition (which is the focus of this section), and (2) materials demanded by the rest of the economy (seeAppendix B.1).
A literature review was performed in order to identify the material intensity (kg/MW) required by the key modelled technologies for the transition towards fully RES-based energy systems: solar PV, solar CSP, wind onshore, wind offshore, electric vehicle batteries and electric grids. For the electricity generation technologies, both new installed capacity and O&M activities are considered.
We reviewed a total of 58 materials, of which 19 minerals (alumi-nium, cadmium, chromium, copper, gallium, indium, iron/steel, lead, lithium, magnesium, manganese, molybdenum, nickel, silver, tell-urium, tin, titanium, vanadium and zinc). Selection criteria was made Table 1
Assumed EROIst levels over lifetime for each of the RES dispatchable technol-ogies for electricity generation.
Technology EROIst (static definition) Reference
Hydroelectricity 50:1 [89]
Geothermal 7:1 [61]
Biomass 1.5:1 [26]
Oceanic 3.25:1 [61]
8In fact, there is a relationship between cumulative use and EROI of RES (e.g.
on the basis of considering all relevant materials to accurately estimate the embodied energy for the EROI estimation, as well as potential cri-tical materials identified in the literature (e.g. Refs. [64,72–75]), as well as on specific assessments (see Ref. [61]). A comprehensive lit-erature review was performed in order to collate the most robust and accurate data about material requirements for each technology. This approach differs from published meta-analyses which tend to focus on the average values of the range of parameters found in the literature [9,25,28,51,90]. In the cases where published data for an element/ phase of the manufacture/installation of the technology was not found, the material requirements have conservatively been estimated from available data from other technologies (instead of being assumed 0 as most commonly performed in the literature). For example, since no data about the material requirements for fences for CSP power plants were found, the data estimated by Prieto and Hall [30] for fences for PV were used; similarly, since no data about land clearing for PV were found, so data for land clearing for CSP was applied instead [27,91], etc. In re-lation to the electric grids, the additional requirement of grids (i.e.
“overgrids”) were estimated considering that the RES reach a high penetration in the electric mix, the losses due to Joule heating and the maintenance of grids. For the sake of simplicity, no energy inputs were derived from monetary costs, and in the case of uncertainty about po-tential double accounting, material requirements were not included. Hence, our estimations can be considered underestimates of the EROI of each technology.
A “representative” technology was selected for each alternative technology on the basis of their current and future expected perfor-mance.Table 2shows the selected representative technologies as well as the main references considered in this work for their material in-tensities. Supplementary Material collates the material intensity for each technology for the 5 most energy intensive inputs (for more details see section 2.4.1.1 and Table 27 in Ref. [61]). Modelled mineral re-cycling rates correspond to the share of recycled content (RC) in the fabricated metal, current levels being taken from Ref. [92] (see Sup-plementary Online Material). The impact of recycling on primary pro-duction is assumed as one-to one displacement for the sake of Fig. 3.Conceptual representation of the energy inputs and output for power plants for variable renewable electricity generation considered in MEDEAS framework (see eq.(15)and adapted from Murphy et al. [37], not to scale).
Table 2
Representative alternative technologies and main references considered for their material intensities. See Supplementary Material for details.
Alternative technology Representative technology Main references for material intensities
Solar CSP CSP with molten-salt storage without back-up: most efficient and used technology [27]. Back-up option is not considered since it is usually powered by non-renewable fuels such as natural gas. [27,61] Solar PV Fixed-tilt silicon PV: better performance in terms of EnU and EROI [30] and subject to less mineral
availability constraints [93] although current share of thin-film technologies in global PV mix is considered. [27,30,61,89,94–96] Onshore wind 2 MW onshore wind turbines: currently the global average wind onshore installed capacity per turbine is
~1.4 MW [97]. [61,98]
Offshore wind 3.6 MW offshore wind turbines taking as reference the current average size in Europe [97] [61,98–100] Electric vehicle battery LiMn2O4electric vehicle batteries: although they are less efficient than other alternatives (e.g. LiCoO2), the
simplicity, however in reality reprocessing generally entails material and quality losses.
2.2.2.2. Energy used (EnU). The energy used (EnU)9 for the construction of new capacity, overgrids and O&M activities (O&M) for each RES variable technology for which the material requirements are explicitly modelled (solar PV, solar CSP, wind onshore, wind offshore) is estimated for virgin and recycled materials from an open LCA database [105] data not available were conservatively estimated, e.g., assuming the same energy requirements per unit of material consumption for by-products than for the main mineral (e.g. Ga and Te). This part of their EnU is estimated multiplying the material intensity of each technology (assumed constant) by the energy consumption per unit of material consumption (MJ per kg, average between virgin and secondary materials considering current recycling rates), whose current values constitute a starting point for the dynamic analysis. Data are cradle to gate or at most to point of use (most data are from Hammond and Jones [105], for the rest see Table 29 in Ref. [61]). Supplementary Material collates the EnU for the 5 most energy intensive inputs for the construction phase of each technology; these 5 inputs explain > 85% of the total EnU for all considered technologies. The change of recycling rates makes them evolve dynamically. Thus, the EnU of each technology i evolves endogenously for each material j (eq.(17)):
=
EnU t Material intensity kg MW
Energy consumption per unit of material consumption MJ
kg t
( )
•
( )
i ij
j
(17) For the sake of simplicity, it was decided not to model the increase in energy requirements due to ore grade decrease of minerals in this analysis, although we acknowledge this effect may be important for some minerals in the future [41,42,106].
2.3. Modelling of the feedback of the variation of the EROI of the system
The variation of the EROI of the system implies a variation in the energy intensity of the economic sectors linked to the generation, transformation and transport of energy. This feedback effect between the energy system and the economic system has also been modelled in MEDEAS-W, but it has been necessary to do so indirectly, due to the grouping of economic sectors used in WIOD [108] (see Refs. [61,107] for a full description of the Economy module of MEDEAS).
Our adopted solution to model the change of the EROI of the system has been to consider it as an additional effect on the total final energy required and consumed by the system in relation to a reference year (2015). This way, a decrease (increase) of the EROI of the system in relation to the reference year will induce an increase (decrease) of the demand of total final energy. The application of this approach assures that the final net energy initially demanded is maintained after ac-counting for the EROI of the system dynamic feedback. We judge that the potential double accounting due to the combination in this work of the LCA of renewable energy technologies with national accounts (WIOD input-output tables) is more than compensated by using the EROIst metric instead of EROIpou or EROIext.
After some reworking of equations (see Supplementary Online
Material), and assuming that the total energy returned (flow (1) in section2) corresponds to Einv+ Neds(being Eingthe energy invested to
supply Neds), we obtain the EROI feedback factor (EROI FC), which
corresponds to the additional effect on the total final energy required by the system in relation to the reference year (t0= 2015) to satisfy the
same level of net energy as if the EROI of the system would have not changed (eq.(18)):
=
EROI FC t EROI t
EROI t
EROI t EROI t
( ) ( )
( ) 1 •
( ) 1 ( ) 0
0 (18)
Eq.(19)shows the resulting demand by final fuel k accounting for the variation of EROI of the system and over the original demand D0:
=
D tk( ) D t EROI FC tk0( )• ( ) (19)
Hence, if EROI FC > 1, there would be an overdemand w.r.t. the initially final energy demanded, and the contrary would hold if EROI FC < 1.
3. Scenarios
We simulated three scenarios with different penetration of renew-ables in the electricity mix in MEDEAS-W model to 2060 under aGreen Growthnarrative (GG), which is the alternative paradigm assumed by the establishment to avoid the adverse impacts on human societies of the global environmental change [76–81]. The GG narrative focuses on successfully combining economic growth with the increase in en-vironmental protection by achieving an absolute decoupling between economic activities increase and the consumption of energy and ma-terials through a diversity of measures, such as a substantial increase in efficiency improvements, the electrification of the system, the trans-formation of the transportation sector and the rapid transition to low-carbon energy sources (renewables, nuclear and not discarding future technologies such as advanced biofuels and bioenergy combined with carbon capture and storage). These goals are expected to be achieved with a so-called ‘inclusive economic growth’. The more or less explicit objective is to undertake a global modernisation process widely based on the path previously followed by developed countries, but including a technology-based transition to RES and large efficiency improvements [109–112]. In this scenario, we progressively activate policies in the period 2020–2025, which given current time (June 2019) it may be considered as an optimistic assumption.
RES currently contribute over 20% of the electricity generation at global level, with hydro dominating the renewable mix with > 70% of the global RES electrical generation. Three scenarios based on the GG narrative are simulated considering different growth rates of the RES technologies for electricity generation:
•
GG-50%: ~50% of RES in electricity mix in 2060,•
GG-75%: ~75% of RES in electricity mix in 2060,•
GG-100%: ~100% of RES in electricity mix in 2060.The targets are approximated given that MEDEAS-W is a simulation model. These scenarios allow us to assess the implications of RES in-creasing contribution in the electricity system for the whole system. For the sake of simplicity, in this work, the EROI-based allocation method of renewable energy technologies is not activated.
The quantification of the GG storyline applied in this work has been performed on the basis of a detailed literature review of scientific pa-pers and reports from international institutions, as well as on our as-sessment. In general, a business-as-usual (BAU) scenario (a narrative which broadly assumes the extrapolation of current trends into the future) is required as an implicit reference, given that the GG narrative is built on alternative assumptions such as a higher Gross Domestic Product per capita (GDPpc) increase and a lower population growth due to higher education levels in this scenario. In particular, data from the
9CED is a term with origin in the LCA community, where it is defined
Shared Socioeconomic Pathways (SSPs) quantifications' are considered for population (SSP1) and GDPpc (SSP2) evolution ([111,113,114]), a more equitable share of income, as well as an economic structure which tends towards a modern economy such as Denmark (see Ref. [107] for details on the method for its implementation). GG also assumes effi-ciency improvements 2x faster than historical trends both at productive sectors and households, a global afforestation program based on [115] as well as a very high increase in recycling rates (RC) of minerals as-sumed to reach 85% by 2060 in line with other works in the literature [116–118] (same target for alternative technologies and the rest of the economy). The role of nuclear energy in a global GG scenario is chal-lenged by the fact that different countries and organizations/institu-tions have a different view. In this work, given the challenges that the nuclear industry faces [119], a slight increase in nuclear capacity is considered in accordance with the most optimistic prospects of alter-native scenarios published by the IEA [110]. Different views also exist on the role of biofuels in a GG scenario. Similarly as for nuclear, for the sake of simplicity in this paper we take as reference the alternative IEA ETP scenarios [110], which assume a slow growth (half of historical trends) for conventional biofuels on cropland given their environmental impacts in parallel with a significant contribution of advanced biofuels in the future. For the renewables dedicated to heat generation we as-sume a doubling of the annual historic short-term averaged growth rates of installed capacity (with a maximum of +20%/year to avoid unrealistically high growth rates). With relation to inland and
households transport, a transition towards electric and hybrid vehicles is assumed in light vehicles and public transportation, however for the case of heavy vehicles and air and water transport, we consider there will not be a substantial replacement of conventional fuels by electric alternatives given the involved technological challenges which remain unresolved [61,120–122].
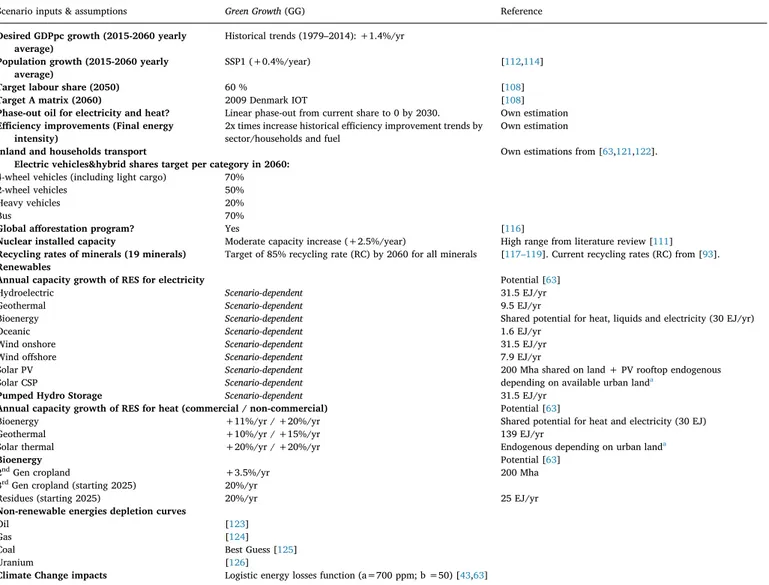
Table 3shows the most relevant variables and hypotheses set in MEDEAS-W for simulating the GG scenario in this work.
4. Results and discussion
This section reports and discusses the results obtained with MEDEAS-W under the scenarios described in section3. Section4.1 fo-cuses on the energy investments associated to the transition to RES, including the resulting EROI of the system, its systemic implications and a comparison with the literature. Section4.2reports the main re-sults in relation to the material requirements associated to the transi-tion to alternative technologies.
4.1. Energy investments
4.1.1. Transition to RES and dynamic EROI of the system
Fig. 4shows the dynamic evolution for the three scenarios con-sidered in this work of the EROIst of the variable RES technologies for electricity generation whose EROI has been dynamically modelled: Table 3
Overview of the most relevant scenarios inputs for simulating theGreen Growth(GG) scenario.
Scenario inputs & assumptions Green Growth(GG) Reference
Desired GDPpc growth (2015-2060 yearly
average) Historical trends (1979–2014): +1.4%/yr Population growth (2015-2060 yearly
average) SSP1 (+0.4%/year) [112,114] Target labour share (2050) 60 % [108]
Target A matrix (2060) 2009 Denmark IOT [108]
Phase-out oil for electricity and heat? Linear phase-out from current share to 0 by 2030. Own estimation
Efficiency improvements (Final energy
intensity) 2x times increase historical efficiency improvement trends bysector/households and fuel Own estimation
Inland and households transport
Electric vehicles&hybrid shares target per category in 2060: Own estimations from [63,121,122].
4-wheel vehicles (including light cargo) 70%
2-wheel vehicles 50%
Heavy vehicles 20%
Bus 70%
Global afforestation program? Yes [116]
Nuclear installed capacity Moderate capacity increase (+2.5%/year) High range from literature review [111]
Recycling rates of minerals (19 minerals) Target of 85% recycling rate (RC) by 2060 for all minerals [117–119]. Current recycling rates (RC) from [93].
Renewables
Annual capacity growth of RES for electricity Potential [63]
Hydroelectric Scenario-dependent 31.5 EJ/yr
Geothermal Scenario-dependent 9.5 EJ/yr
Bioenergy Scenario-dependent Shared potential for heat, liquids and electricity (30 EJ/yr)
Oceanic Scenario-dependent 1.6 EJ/yr
Wind onshore Scenario-dependent 31.5 EJ/yr
Wind offshore Scenario-dependent 7.9 EJ/yr
Solar PV Scenario-dependent 200 Mha shared on land + PV rooftop endogenous
depending on available urban landa
Solar CSP Scenario-dependent
Pumped Hydro Storage Scenario-dependent 31.5 EJ/yr
Annual capacity growth of RES for heat (commercial / non-commercial) Potential [63]
Bioenergy +11%/yr / +20%/yr Shared potential for heat and electricity (30 EJ)
Geothermal +10%/yr / +15%/yr 139 EJ/yr
Solar thermal +20%/yr / +20%/yr Endogenous depending on urban landa
Bioenergy Potential [63]
2ndGen cropland +3.5%/yr 200 Mha
3rdGen cropland (starting 2025) 20%/yr
Residues (starting 2025) 20%/yr 25 EJ/yr
Non-renewable energies depletion curves
Oil [123]
Gas [124]
Coal Best Guess [125]
Uranium [126]
Climate Change impacts Logistic energy losses function (a=700 ppm; b =50) [43,63]
wind onshore, wind offshore, solar PV and solar CSP (see section2.2.2). It is found that wind technologies generally provide more net energy over time to the system than solar ones. In particular, in GG-100% solar technologies would be a clear net contributor to the system only by the end of the simulation period (Fig. 4c). The low dynamic EROIst values in the past (such as < 1:1 for solar technologies) are due to the high energy investment costs as a consequence of the combination of the high material and energy intensities with very fast growth of these technologies in the last two decades. All dynamic EROIst levels tend to increase over time. This is mainly due to the progressive reduction of
the growth rate of new RES power plants as their cumulative capacity builds up, which thus increases the instantaneous energy returns; and, to a lesser extent, to the assumed increase of mineral recycling rates within the GG paradigm (i.e., secondary minerals are generally less energy intensive than processing primary minerals from the mine [105]). However, other factors such as the need of overcapacities due to RES intermittency management tend to reduce the EROIst when ap-proaching the 100% RES target (see Supplementary Material). The EROIst of a given technology reaches its maximum value when the full techno-sustainable potential of a resource is under exploitation and then energy investments are dedicated only to infrastructure replace-ment and O&M, and while the penetration of variable RES has not reached critical levels. This is the case for example of wind onshore in scenarios GG-75% (~2055) and GG-100% (~2040). When RES in the GG-100% scenario achieve to replace non-renewables by the end of the simulation period, the EROIst of all the RES technologies increase substantially, although with a delay due to the inertias in the energy system, given that the fast growth rates of capacity installation of the transition are not any longer necessary (Fig. 4c).
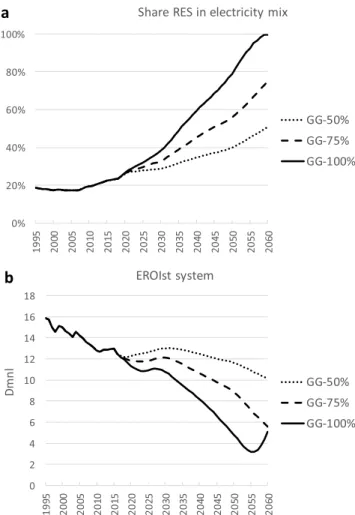
Fig. 5a shows the penetration level of RES in the electricity mix for the 3 scenarios considered, which matches with the targets selected by 2060: ~50%, ~75% and ~100%.Fig. 5b shows the dynamic evolution of the EROIst of the system, which is found to have decreased from ~16:1 in 1995 to ~12:1 in 2015 mainly due to an increase in the en-ergy industry own-enen-ergy use as reported by the IEA Balances [84], and to a lesser but increasingly important extent during this period of the penetration of RES electric in the global electricity mix. As expected, Fig. 4.Dynamic EROIst of the RES variable technologies for the scenarios
GG-50% (a), GG-75% (b) and GG-100% (c). CSP starts at a constant ~12:1 level given that no capacity was installed in the period 1995–2005 (required energy investments correspond just with O&M). Dmnl: Dimensionless.
the EROIst of the system decreases faster in those scenarios where the penetration of RES in the electricity system is faster. This way, the EROIst for each scenario in 2060 is ~10:1 (50%) and ~5:1 for GG-75% and GG-100%, respectively. The fact that for the latter two sce-narios the same EROIst of the system is obtained in the target year is due to the dynamic nature of the transition to renewables: as seen in Fig. 5b, the EROIst for the GG-100% scenario decreases faster than the GG-75% reaching a minimum of ~3:1 at ~2055, increasing thereafter. This behaviour is due to the fact that the EROIst in a given year depends by definition on the energy investments being performed during that year. By 2055, the transition to RES in the electricity sector is almost achieved in the GG-100% scenario and due to this reason the rate of energy investments decreases thereafter thus allowing the EROIst of the system to partially recover (seeFig. 6) until ~5:1. Similarly, scenarios GG-75% and GG-50% also show a “rebound” (although of lower mag-nitude) during the second half of the 21st century if the timeframe of the analysis is expanded to 2100. The magnitude of this “rebound” depends on the interaction of different factors which are scenario de-pendent such as the level of electricity demand, the growth rate of new RES facilities, the availability of storage, etc.
The EROIst of the system decreases over time10 even while the EROIst levels of the individual RES variable technologies have an in-creasing trend. This is due to the fact that the EROIst levels of the latter are lower than the current EROI of the full system (dominated by high EROI fossil fuels and hydroelectricity), and their share increases over time in the simulated scenarios. Hence, the effect of exponential in-crease and cumulated capacity of RES for electricity drive the EROI of the system to lower levels.
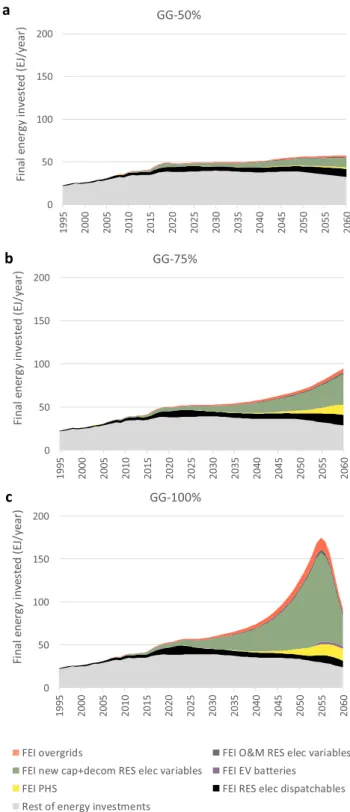
Fig. 6shows the total final energy invested by factor for each sce-nario. From current energy investments < 40 EJ/yr, total final energy invested increase in all scenarios reaching ~60 EJ/yr (GG-50%), ~90 EJ/yr (GG-75%) and ~110 EJ/yr (GG-100%) by 2060. The energy investments associated with the construction and operation of variable renewable technologies for electricity generation (wind, PV and CSP) is the factor contributing most to the increase of total final energy in-vested during the simulation period. Its share over the total final energy investments increases from current ∼5% to ∼20% (~13 EJ/yr) in GG-50% and ∼40% (∼37 EJ/yr) in GG-75% by 2060. In GG-100% a maximum of 70% (~120 EJ/yr) is reached by 2055 followed by a drop to 55% (~40 EJ/yr) five years later. The maximum level of final energy investments in the scenario GG-100% (Fig. 6c) corresponds with the minimum in the EROIst of the system (see Fig. 5b). This is a vast amount of energy investments, amounting to 30% of the current TFEC. The installation of new capacities represents the majority of in-vestments related with variable renewable technologies for electricity generation (> 70% vs < 30% for O&M, decommissioning and over-grids). Energy storage investments depend on the penetration of vari-able RES in the electricity mix, requiring < 15% of the total final en-ergy invested for all scenarios. Dispatchable RES require enen-ergy investments of 5–10 EJ/yr in all scenarios.
4.1.2. Overdemand estimation and efficiency of the whole system
The decrease in the EROIst of the system has implications for the rest of the system: in order to satisfy the same level of final net energy consumption, the system needs to process more energy and materials. As reported in section2.3, this phenomenon is modelled in MEDEAS-W through a function of overdemand (EROI FC).Fig. 7shows the increase in total final energy demand to compensate for the decrease of EROIst of the system up to 2060 for the three simulated scenarios. In other
words, it shows the implications for the demand of the necessity to divert energy from the rest of the economy to “just” getting energy. In GG-50% scenario, the overdemand increases softly surpassing +2% by 2060 (i.e., EROI FC = 1.02). In GG-75%, there is a faster increase in the
Fig. 6.Final energy invested (FEI) by factor for each scenario (50%, GG-75% and GG-100%): new capacity, overgrids and decommissioning RES vari-ables for electricity generation (new cap + OG + decom RES elec var), op-eration and maintenance of RES variables for electricity genop-eration –including electricity self-consumption- (O&M RES elec variables), electric vehicle bat-teries (EV batbat-teries), pumped hydro storage (PHS), RES dispatchables for electricity generation (RES elec dispatchables) and the rest of energy invest-ments (related to non-electric renewables and non-renewable energies).
10The EROIst of the system increases slightly for scenarios 50% and
overdemand which reaches +11% by 2060. Finally, in GG-100% the effects are very large: there is a maximum of around +35% by 2055, which corresponds with the aforementioned maximum in final energy invested and the minimum in the EROIst of the system. This means that, in order to satisfy the same final net energy demand in GG-100%, the system would need to process 35% more of energy with relation to the case of not accounting for the EROI variation feedback. In the case of assuming no improvement in the recycling rates of minerals during the timeframe studied, the overdemand would reach a peak of +45% (EROIst of the system of 2.8:1 vs 3.2:1).
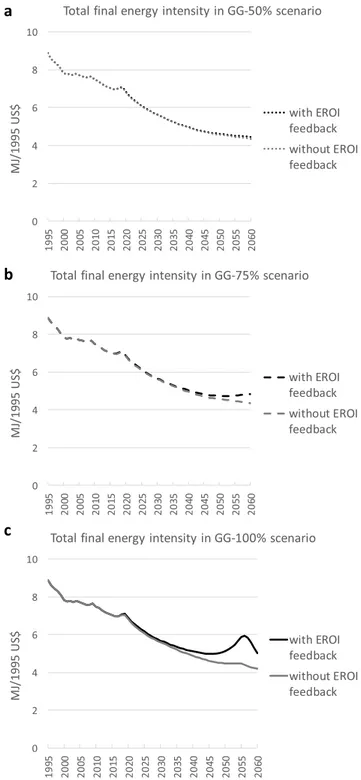
Hence, the decline in the EROI of the system negatively affects its efficiency. Fig. 8shows that by 2055 the total final energy intensity (defined as TFEC/GDP) in the GG-100% scenario would reach the level attained in the mid-2020s, while in the case of not accounting for the EROI variation feedback, the total final energy intensity steadily de-creases over the simulated period (cumulated reduction of ~40% be-tween 2020 and 2060). For the scenario GG-75%, the total final energy intensity starts to increase by 2050 and by 2060 it reaches the levels of 20 years before (Fig. 8b). These results point to a strong re-materi-alization of the system during a fast transition to renewable energies which counters the assumed exogenous efficiency improvements for the productive sectors and households assumed within the GG narrative as implemented in this study (seeTable 3).
4.1.3. Dynamic EROI of the system: comparison of obtained results with the literature
As aforementioned in the Introduction, few studies have up-to-now analysed projections of 100% RES scenarios from a net energy per-spective. Among the exceptions are the following studies: [51,54,58]. Of those, only Sgouridis et al. [58], considers the up-front costs of the energy investments dynamically and the delayed return of energy generation over the lifetime of the infrastructures. Those works ap-plying a “static” approach for EROI integration downplay the transitory reduction in the net energy delivered to the society during the transi-tion to RES.
Also, all previous works have focused on the estimation of a “composite” EROIst of the system obtained as the weighted average of the static EROIst of the different technologies in the energy mix. This approach misses the dynamic nature of the problem as well as the ad-ditional infrastructure to manage the intermittency of RES (overgrids, overcapacities and storage). In fact, the intermittency of variable RES in these previous works is represented poorly, most focusing on average annual power. Sgouridis et al. [58], considers additional losses due to the storage of a share of variable generation; however given the spe-cifications considered (ESOI = 125 and storage of 10% of average an-nual generation), its inclusion does not noticeably affect the results. Trainer [51] does take into account indirectly the overcapacities re-quired in a scenario of 100% electricity for Australia [52]. Further
differences between studies are also highly dependent on the estimates of EROIst for each technology considered, given the wide ranges re-ported in the literature. In this sense, it should be emphasized that the EROIst of the individual electric RES technologies in this study are in the lower range of the literature (see Capellán-Pérez et al. [61]).
Re-running the scenarios GG-50%, GG-75% and GG-100% while
Fig. 7.Variation (%) of total final energy demand due to accounting for the EROI feedback.
Fig. 8.Comparison of the total final energy intensity in scenario GG-100% accounting for the EROI feedback (black line) and without accounting for its effect (grey line). Total final energy intensity is the ratio between the total final energy consumed in an economy and the total value added (GDP) generated by this economy in a given time period. The EROI feedback factor corresponds to the additional effect on the total final energy required by the system in relation to the reference year (t0= 2015) to satisfy the same level of net energy as if the
![Fig. 9 represents the evolution of the EROIst of the system obtained in this work for each scenario and the different levels of systemic-risk as identified in the literature [ 19 , 24 , 127 ]](https://thumb-us.123doks.com/thumbv2/123dok_es/6147105.180974/14.892.65.556.758.1108/represents-evolution-obtained-scenario-different-systemic-identified-literature.webp)