Determination of the hoop fracture properties of unirradiated
hydrogen-charged nuclear fuel cladding from ring compression tests
M.A. Martin-Rengel
a*, F.J. Gomez Sanchez
b l, J. Ruiz-Hervias
a, L. Caballero
3A B S T R A C T
In this work, a n e w methodology is devised to obtain the fracture properties of nuclear fuel cladding in the hoop direction. The proposed method combines ring compression tests and a finite element method that includes a damage model based on cohesive crack theory, applied to unirradiated hydrogen-charged ZIRLO™ nuclear fuel cladding. Samples w i t h hydrogen concentrations f r o m 0 to 2000 p p m w e r e tested at 20 °C. Agreement b e t w e e n the finite element simulations and the experimental results is excellent in all cases. The parameters of the cohesive crack model are obtained f r o m the simulations, w i t h the fracture energy and fracture toughness being calculated in turn. The evolution of fracture toughness in the hoop direction w i t h the hydrogen concentration (up to 2000 p p m ) is reported for the first t i m e for ZIRLO™ cladding. Additionally, the fracture micromechanisms are examined as a function of the hydrogen con-centration. In the as-received samples, the micromechanism is the nucleation, g r o w t h and coalescence of voids, whereas in the samples w i t h 2000 ppm, a combination of cuasicleavage and plastic deformation, along w i t h secondary microcracking is observed.
1. Introduction
Zirconium alloys are used as nuclear fuel cladding due to their outstanding combination of properties, i.e. low neutron absorption, corrosion resistance and remarkable mechanical properties at oper-ating conditions. As they are the first structural barrier that contains the fuel and fission products, their structural integrity and durability must be assured along the different steps of the fuel cycle.
There are a number of phenomena that may degrade the mechanical performance of cladding, such as those associated with hydrogen absorption. During the operation of light water nuclear reactors, the oxidation reaction that takes place at the cladding surface produces hydrogen, which is absorbed and diffuses inside the cladding. As the terminal solid solubility of hydrogen in zirco-nium is quite low (even at operation temperatures), brittle hy-drides will be formed when the solubility limit is reached. It has been demonstrated that these hydrides may embrittle the cladding and reduce its mechanical properties, with the resulting embrittle-ment being dependent on the concentration and geometrical dis-tribution of the hydrides [1-4].
not allow the machining of standard samples for fracture testing. In addition, due to the manufacturing process, the cladding is quite anisotropic [5], i.e. the mechanical and fracture properties will depend on the sample direction. Consequently, loading must be applied along the hoop direction of cladding, where the highest stresses occur during the fuel cycle. As it is very difficult to perform fracture tests along the hoop direction, some authors have used the Pin-Load Tension test (PLT) to study the fracture toughness of clad-ding in the axial direction [6], Others have used zirconium alloy plates to investigate the fracture properties as a function of hydro-gen content [3],
In this paper, for the first time, the ring compression test is used to study the fracture properties of nuclear fuel cladding in the hoop direction. From the available tests, this particular one was selected because stable crack propagation is observed after the maximum load, and this allows the calculation of the fracture energy by using the cohesive crack theory [7]. In addition, both machining and test-ing are relatively easy, what makes it very attractive for irradiated material. Hydrogen is introduced in the samples by cathodic charg-ing in a KOH solution. Non-irradiated ZIRLO™ claddcharg-ing samples with different hydrogen contents (0, 150, 250, 500, 1200 and 2000 ppm) were tested at 20 °C. A finite element model is developed to simulate the experimental results. Material damage is incorporated by means of the cohesive crack model. The varia-tion of the calculated fracture toughness with the hydrogen con-centration is reported. In addition, a fractographic analysis is performed to assess the effect of the hydrides on the fracture micromechanisms.
2. Experimental
2.3. Material and testing
The material employed is unirradiated ZIRLO™ cladding in the stress-relieved condition [8], The cladding dimensions are 9.5 mm outer diameter and 0.57 wall thickness. The samples were cut in the shape of rings with a height of 10 mm, in order to ensure a plane strain state during ring compression testing.
Hydrogen was introduced in the samples by means of cathodic charging in a KOH aqueous solution. After charging, the hydrogen
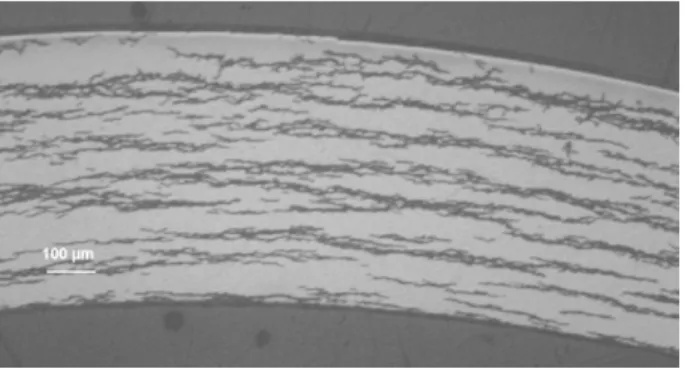
Fig. 1. Hydride distribution in a sample with 500 ppm of hydrogen.
concentration was measured with a HORIBAJOBIN YVON analyser EMGA-621-W. Further details of the hydrogen charging procedure are given in [4,9]. Samples with controlled amounts of hydrogen (150, 250, 500,1200 and 2000 ppm) were obtained by this process. The resulting hydride distribution was homogeneous through the cross-section, with hydrides oriented along the hoop direction of the samples, as shown in Fig. 1. The diffraction patterns indicated that the hydrides have a typical 5-ZrH166 phase [4],
Mechanical tests were performed at 20 °C with a universal testing machine. The load was measured with a load cell of 5 kN capacity. Compression load was applied by means of two steel plates (plane and parallel), as shown in Fig. 2. The relative displacement of the load-ing plates was measured with a capacitive transducer of ±5 mm travel. Tests were carried out by applying a constant displacement rate of 0.3 mm/min. At the end of the test, the cross-section of the sample was deformed in the shape of an eight, as can be seen in Fig. 2.
The fracture surfaces of the as-received samples and those with 500 and 2000 ppm of hydrogen were observed by scanning elec-tron microscopy (SEM), in order to ascertain the fracture micro-mechanisms. For this purpose, a JEOL JSM-6300 scanning electron microscope was used.
2.2. Finite element model
A 2D finite element model was developed to simulate the ring compression tests. Only one fourth of the sample was employed
Displacement (mm)
due to geometry and loading symmetries. The ABAQUS v.6.7-5 commercial code was used for the calculations.
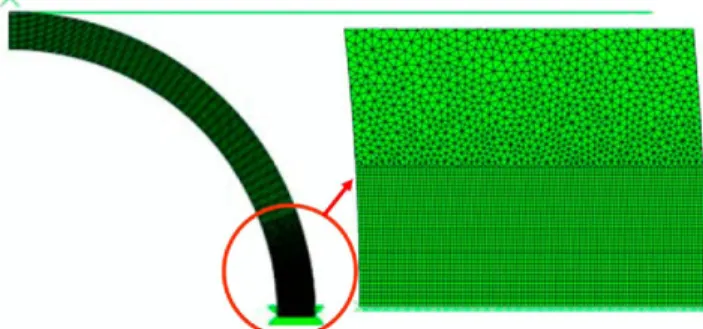
A detail of the mesh employed is shown in Fig. 3. It should be noted that it is a semi-structured mesh, structured in the damage zone and the region where load was applied. The elements in the structured zone are quadrilaterals with eight nodes, with the ele-ment size being five micrometers.
The specimen was modelled as a deformable mesh and the loading system as an analytical rigid surface. A standard hard con-tact with 0.125 friction coefficient was introduced between the two elements [1 ] with the displacements perpendicular to the ver-tical symmetry plane being restricted. The cohesive elements are located along the horizontal symmetry plane. As regards the mate-rial, the constitutive equation was taken from the numerical simu-lations of the ring tensile tests performed on the same cladding material [4,8,10] and the von Mises yield criterion employed [1].
The damage was simulated by means of cohesive crack theory. In such a way, the unloading after the maximum load observed in the experiments (associated with stable crack propagation in the sample) could be reproduced (see the steps in a typical ring com-pression test in Fig. 2). A special user element subroutine was pro-grammed to model the cohesive behaviour because ABAQUS v.6.7-5 only provides cohesive elements for small deformations (i.e. without geometric non-linearity). A cohesive element of three nodes is defined in the subroutine to model the interface, where large deformations are considered. Bilinear elements with three and four sides (with nodes in the corners and at the mid-length of each side) were employed in the rest of the mesh, with volumetric locking problems being avoided. Here the calculations are performed by controlling the displacement of the critical cohe-sive node where the real crack is formed, in order to achieve convergence.
The cohesive strength ft and the critical displacement wc are material constants introduced by the cohesive crack model. The area under the softening curve is the fracture energy, GF. This is
also a material property and may be obtained by simply integrat-ing the softenintegrat-ing curve [11]:
,-wc
G f = / f(w)dw (1)
Jo
The authors have shown that for metallic materials, a rectangu-lar softening curve (shown in Fig. 4) is a good choice [7]. Further details about the implementation of the cohesive crack model are given in [12].
As explained above, the unloading portion of the curve after the maximum load was employed in the cohesive crack model. Both parameters of the softening curve ( ft and wc) were determined by trial and error from the experimental ring compression test results. The procedure consisted of generating a family of curves for every hydrogen concentration and then selecting the best match with experiments. The cohesive strength was varied between 800 (i.e.
Fig. 3. Mesh employed in the model.
f,
w w <D W Displacement WcFig. 4. Sketch of a rectangular softening curve and constants of the cohesive crack model.
slightly above the yield stress) and 1100 MPa (smaller than the fracture stress) [4]. Two calculations were performed for each ft value. The first one was carried out with a large value of Gf to avoid unloading. Therefore, the point of separation between the numer-ical and experimental curves may be found and is considered as the critical displacement value. A second calculation is performed with the obtained value in order to have the unloading at the cor-rect point. A family of curves for different values of the cohesive strength ft obtained by repeating this method, with each curve hav-ing a different unloadhav-ing slope. From the comparison between the numerical and experimental load-displacement curves, the best matches were selected.
Once the fracture energy, Gf, is calculated under the hypothesis of the model, the fracture toughness may be obtained through Eq. (2) (Irwin's equation):
KIC = ^ECe (2)
where K/c is the fracture toughness, and E is given by Eq. (3) in plane strain:
where E is the Young's modulus and v is the Poisson's ratio.
3. Results and discussion
Ring compression tests were carried out in the as-received and pre-hydrided samples. The examined hydrogen concentrations were 150, 250, 500, 1200 and 2000 ppm, and at least three differ-ent samples were tested for each condition. The experimdiffer-ental load vs. displacement data at 20 °C are shown in Fig. 5 for all hydrogen concentrations.
As may be seen in the experimental results from Fig. 5, the load is proportional to the displacement at the beginning of the test. Later, the load continues to increase with a smaller slope, until the maximum load is reached, and then a gradual load decrease oc-curs. It is observed that around the maximum load value a crack is initiated at the external surface of the sample which then propa-gates along the axial direction, while the load is decreasing. The fi-nal load increase is due to the fact that each side of the deformed sample come into contact with each other. The different stages of the test are shown in Fig. 2.
The results show that even a small hydrogen concentration (i.e. 150 ppm) produces noticeable changes in the load vs. displace-ment data, which means that the test is quite sensitive to the pres-ence of hydrides inside the sample. However, the observed behaviour is practically the same as the one corresponding to the as-received samples, with the only difference being the smaller maximum load achieved by the pre-hydrided sample. The same pattern is observed for higher hydrogen concentrations, with the maximum load being very similar for 250 and 500 ppm and decreasing from 500 to 1200 ppm. Finally, the experimental curves for 1200 and 2000 ppm hydrogen are very similar.
2
2000 LJm
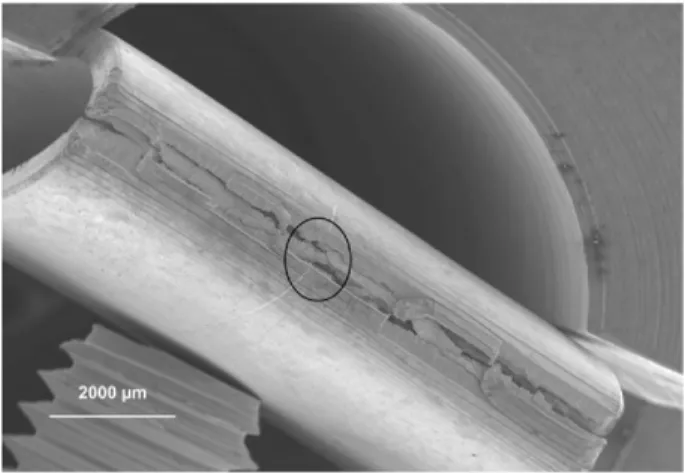
Fig. 7. Sample with 500 ppm of hydrogen after RCT.
Fig. 5. Experimental load vs. displacement results in RCT for different hydrogen concentrations.
4 6 8 10
Displacement, mm
Fig. 8. Sample with 2000 ppm of hydrogen after RCT. The analysis of the fracture surfaces gives additional clues to the
effect of hydrogen on the fracture micromechanisms. The Figs. 6 - 8 show as-received and pre-hydrided samples with 500 ppm and 2000 ppm, respectively, after a ring compression test. In all cases, a long crack is observed along the axial direction of the sample. In the as-received sample, the crack does not extend to the cylinder basis (see Fig. 6), whereas both pre-hydrided samples are broken open (see Figs. 7 and 8).
In the as-received sample (see Fig. 6), short and shallow isolated cracks may be seen close to the main crack. The zigzagged and stepped shape of the main crack suggests multiple initiation sites and coalescence to a single crack by a shear mechanism. The fact that the crack is stopped at the cylinder basis is probably due to the characteristics of the local stress state.
In the sample with 500 ppm (see Fig. 7), it is noticeable that the proportion of secondary shallow cracks is significantly higher and that they are longer than in the as-received samples. In the case of the sample with 2000 ppm (Fig. 8), it would seem that the num-ber of secondary cracks is smaller, although they grow consider-ably longer, covering practically the whole length of the sample. In both of the pre-hydrided samples, the secondary cracks are asso-ciated with the fracture of the oxide layer. As happened in the as-received samples, the shape of the main crack in the pre-hydrided samples suggests multiple initiation sites followed by coalescence due to shear. It may be observed that the higher the hydrogen tent, the smaller the number of steps in the main crack. This is con-sistent with an easier propagation in the axial direction of the samples.
The Figs. 9-11 show representative views of the fracture sur-faces. They correspond to the encircled zones in Figs. 6-8. In the as-received sample (see Fig. 9), the fracture micromechanism is the nucleation, growth and coalescence of voids, which may nucle-ate from second phase particles or precipitnucle-ates. This is associnucle-ated with ductility at the microscopic level. The characteristic features of the sample with 2000 ppm may be seen in Fig. 11. The fracture mechanism is ductile to some extent, with local orientations which
Experimental
Numerical
0 2 4 6 8 10
Displacement, m m
Fig. 13. Experimental vs. numerical load-displacement curves for RCT, 150 ppm hydrogen.
of
Experimental
Numerical
- - A - - Experimental
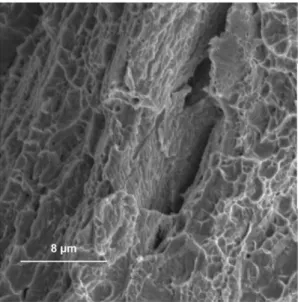
Numerical Fig. 10. Crack detail of a sample with 500 ppm of hydrogen.
Experimental
Numerical
0 2 4 6 8 10
Displacement, m m
Fig. 14. Experimental vs. numerical load-displacement curves for RCT, 250 ppm of hydrogen.
0 2 4 6 8 10
Displacement, m m
Fig. 15. Experimental vs. numerical load-displacement curves for RCT, 500 ppm of hydrogen.
suggest a possible relation w i t h the crystallographic planes and secondary cracking. It may be assimilated to a cuasicleavage frac-ture combined with plastic deformation. In the sample with 500 p p m (see Fig. 10), both fracture micromechanisms are mixed; zones with elongated voids alternated w i t h steps similar to those observed for 2000 p p m may be observed (Fig. 11).
Fig. 11. Crack detail of a sample with 2000 ppm of hydrogen.
4 6 8 10
D i s p l a c e m e n t , m m
Displacement, mm
Fig. 16. Experimental vs. numerical load-displacement curves for RCT, 1200 ppm of hydrogen.
Displacement, mm
Fig. 17. Experimental vs. numerical load-displacement curves for RCT, 2000 ppm of hydrogen.
Table 1
Constants of the cohesive crack model for the different hydrogen concentrations.
H concentration ( p p m ) f , (MPa) wc (|im) CF (kN/m)
0 930 41.0 38.13
150 928 36.6 33.96
250 922 34.4 31.72
500 915 34.0 31.11
1200 912 33.0 30.10
2000 906 32.4 29.98
The results of the numerical modelling are shown in Figs. 12-17, together with the experimental results. The whole load vs. dis-placement curve is correctly predicted, including the unloading after the maximum load, with the agreement with the experimen-tal results being excellent in all cases. From the numerical model, the parameters of the cohesive crack model, i.e. the cohesive strength/t and the critical displacement wc, which produce the best fit are obtained. The values of these parameters, along with the cal-culated fracture energy, are given in Table 1 as a function of the hydrogen concentration.
The results in Table 1 show that the cohesive strength ft,
decreases very slowly with the hydrogen content. Conversely, the critical displacement wc and consequently the fracture energy, Gf, show noticeable reductions when the hydrogen concentration is increased, with the corresponding values at 2000 ppm 30% being smaller than those for the as-received samples.
64 1 1 1 1
62
-60
_
LOO •
E 58
_
ro
CL •
2 56 •
b •
* •
54
52
50 1 1 1 1
0 500 1000 1500 2000 2500
Hydrogen concentration, ppm
Fig. 18. Calculated fracture toughness I(IC as function of the hydrogen concentration in the sample.
The fracture toughness may be calculated from Gf by applying Eqs. (2) and (3). The same values of the Young's modulus (£ = 88 GPa) and the Poisson's ratio (v = 0.37) were used in all cases because it was demonstrated that they are not affected by the hydrogen concentration in the samples [8]. As explained above, the constitutive equation of the material was taken from numerical simulations of ring tensile tests performed in the same material [4,8,9]. The excellent agreement between the numerical calcula-tions and the experimental results of the ring compression tests (see Figs. 12-17) serves also as a validation of the results obtained from the ring tensile tests. The evolution of fracture toughness with hydrogen concentration is shown in Fig. 18. In accordance with the experimental results, a remarkable decrease of the frac-ture toughness is found for 150 and 250 ppm of hydrogen, which shows the sensitivity of the ring compression test for small hydrogen contents. For concentrations in excess of 500 ppm, the fracture toughness decreases very slowly. Grigoriev et al. [13] estimated the fracture toughness ofZircaloy-2 cladding by means of the pin-loading (PL) tension test in the axial direction, and obtained a maximum-load fracture toughness of about 100 MPa^m for irradiated cladding at 573 K. Conversely, Desquines et al. [14] showed that the expected values of the fracture toughness of Zircaloy-4 should be lower to 60-90 MPa^m at a cladding temperature close to 350 °C in the hoop direction. Other authors measured the fracture toughness of recrys-tallised unirradiated Zircaloy-4 plates (6 mm thickness) as a function of the hydrogen concentration [3]. The calculated fracture toughness is approximately 70 MPa^m for samples with 200 ppm of hydrogen. Those values are similar to the ones obtained in this research. To the author's knowledge, this is the first occasion that the evolution of the fracture toughness in the hoop direction with the hydrogen content is reported for ZIRLO™ cladding.
4. Conclusions
The ring compression test was used to obtain the fracture prop-erties of unirradiated ZIRLO cladding at 20 °C in the hoop direction. The samples were charged with hydrogen by using a cathodic charging technique. In such a way, samples with hydrogen concen-trations from 150 to 2000 ppm were prepared. The experimental results showed that this test if very sensitive to low hydrogen con-centrations, for only 150 ppm of hydrogen produce a remarkable effect in the load vs. displacement curves.
the macrographs showed a long axial crack formed at the end of the ring compression tests. Its zigzagged shape suggests multiple initiation sites and coalescence by shear mechanisms. Secondary cracks are observed close to the main one, associated with the fracture of the oxide layer in the pre-hydrided samples. In the as-received samples, the dominating fracture micromechanism is the nucleation, growth and coalescence of voids, linked with ductility at the microscopic level. On the other hand, the fracture surface of the sample with 2000 ppm shows secondary microcracks and a combination of cuasicleavage and plastic deformation.
A novel finite element model, which incorporates a damage model based on the cohesive crack theory, was developed to sim-ulate the ring compression test. Hence, the whole experimental curve, including the unloading after the maximum load, could be reproduced. Agreement between the simulations and the experi-mental results is excellent in all cases. The parameters of the cohe-sive crack model are obtained from the simulations and fracture energy and fracture toughness duly calculated.
The evolution of the fracture toughness in the hoop direction with the hydrogen content (up to 2000 ppm) is reported for the first time for ZIRLO cladding. A remarkable decrease of the fracture toughness is observed for the samples with 150 and 250 ppm, whereas for concentrations in excess of 500 ppm, the fracture toughness decreases very slowly. The fracture toughness values obtained in this research agree with those obtained by other authors.
The ring compression test is attractive for irradiated cladding because it uses small samples, with both machining and testing being relatively easy to compare with other tests currently employed. In addition, the results from this investigation show that the ring compression test could be very useful to study the fracture properties of irradiated cladding in the hoop direction.
Acknowledgements
The authors wish to acknowledge the financial support received from Ministerio de Ciencia e Innovacion (project BIA2011-26486)
and ENUSA Industrias Avanzadas, ENRESA and Consejo de Seguri-dad Nuclear (CSN) for collaboration and support in the project. W e would like to thank Prof. A. Valiente for helpful discussions. One of the authors (M.A. Martin-Rengel) wishes to acknowledge CSN for awarding the fellowship to carry out this work. The present work was carried out within the framework of the project ESTRU-MAT supported by the Comunidad de Madrid.
References
[1] S. Arsene, J.B. Bai, Effet de la microstructure et de la temperature sur la transition ductile-fragile des Zircaloy hydrures, PhD dissertation, Ecole Centrale Paris, 1997.
[2] M. Grange, Fragilisasion du Zircaloy par l'hydrogene: comportement, mecanismes d'endommagement, interaction a vec la couche d'oxide, simulation numerique, PhD. dissertation, Ecole de Mines de Paris, 1998. [3] G. Bertolino, G. Meyer, J. Perez-Ipina, J. Nucl. Mater. 320 (2003) 272-279. [4] M.A. Martfn-Rengel, Integridad estructural de vainas de combustible nuclear
en condiciones de almacenamiento temporal en seco, PhD Thesis, Universidad Politecnica de Madrid, 2009. ENRESA technical publication 05-2010 (in Spanish).
[5] K. Linga, I. Charit, Prog. Nucl. Energy 48 (2006) 325-359.
[6] V. Grigoriev, B. Josefsson, A. Lind, B. Rosborg, Scr. Metall. Mater. 33 ( 1 ) (1995) 109-114.
[7] F.J. Gomez, A. Valiente, M. Elices, Nucl. Eng. Des. 219 (2002) 111-125. [8] Sabol, P. George, J. ASTM int. 2 ( 2 ) (2005). Paper ID JAI12942.
[9] M.A. Martin-Rengel, F.J. Gomez,J. Ruiz-Hervias, L. Caballero,A. Valiente,J. Nucl. Mater. 429 (2012) 276-283.
[10] M.A. Martfn-Rengel, F.J. Gomez, J. Ruiz-Hervfas, A.Valiente, N e w method to calculate the mechanical properties of unirradiated hydrogen-charged fuel cladding from ring tensile tests, 2009 Water Reactor Fuel Performance Meeting, September 6-10, 2009, Paris, France, paper no. 2111, 2009. [11] M. Elices, J. Planas, Mater models, in: L. Elfgren (Ed.), Fracture Mechanics of
Concrete Structures, Chapman and Hall, London, 1989, pp. 16-66.
[12] M.A. Martfn-Rengel, F.J. Gomez, J. Ruiz-Hervfas, A.Valiente, Obtention of fracture properties of unirradiated hydrogen-charged fuel cladding from ring compression test, 2009 Water Reactor Fuel Performance Meeting, September 6-10, 2009, Paris, France, paper no. 2212, 2009.
[13] V. Grigoriev, B. Josefsson, B. Rosborg, ASTM Spec. Tech. Publ. 1295 ( 1 9 9 6 ) 4 3 1 -447.