THICKNESS VARIATION AND NON UNIFORM
PLATE BEHAVIOUR USING MODAL TEST RESULTS
Jesús Alonso Álvarez1, Víctor de la Cruz Salmerón2, Álvaro Yañez González3, Antonia Pacios- Álvarez4 and Mª Consuelo Huerta5
1
Dept. Mechanical Eng. ETSII UPM, [email protected]
2
Dept. Mechanical Eng. ETSII UPM, [email protected]
3Dept. Mechanical Eng. ETSII UPM, [email protected] 4Dept. Mechanical Eng. ETSII UPM, [email protected]
5
Dept. Mechanical Eng. ETSII UPM, [email protected]
ABSTRACT
This paper presents a proposal to apply model updating to a simple structure, using single measured point to establish dynamic This can be interesting specially for reduced glass thickness because changes of 10% in thickness implies also a 10% on frequencies that could be detected with the proposed procedure. Plates of 1938 x 876 mm, tempered of 10mm and 5mm and annealed laminates 3+3, are selected to obtain free-free natural frequencies, and more than 15 modes are used to update a finite element model in order to study non uniform stiffness distribution due to the production process. Initially, classical modal test approach is used with the measurement of the force and acceleration response on only one point. Finally the possibility of operational modal test is checked using only the response of the structure for more than 15 modes with a measurement on one point. After the updating the FEM model is possible to analyze the similarity with a reference glass plate. This paper presents a first step for the use of Operational Modal Analysis for line quality control of glass plates, during the production process.
Keywords: Operational Modal Analysis, Glass Modal Test, Quality Control, Production line, Safety glasses
1. INTRODUCTION
1.1. General Description
Real time sounds and vibration analysis are detecting a wide range of mechanical defects and assembly faults in automotive, engine and glass construction industry. This method use the sound and vibration characteristics to identify common defects in the products.
The control of the thickness and flatness tolerances [1] can play an important role. In the production of thin glass solar cells, these kind of quality controls help to reduce the cost of processing defective parts. Typically, thickness, length and width of the glass are inspected at the end of the manufacture, and on delivery. In the case of thin glass with other purposes, geometrical variations could deteriorate the visual quality or change the glass behavior, reaching the fracture.
Most frequent techniques used in the product lines are based on non contact thickness measurement scanning by laser Doppler vibrometers [2], [3], or the measure of the dinamic response in multiple point [4]. All these methods are complex and time-consuming.
Finite element model updating is an inverse problem where experimental data are considered to be exact, and model parameters are updated to reduce differences between the model and the data. Model updating is commonly used in many engineering fields, helping to solve various problems such as structural damage detection, and the estimation of uncertain material parameters. The updating process requires knowledge of dynamic properties; natural frequencies and mode shapes are the most commonly used. Usually first natural frequency or up to four natural frequencies are considered. Measuring response in multiple points is also used frequently. To determine the elastic constants of isotropic materials [5], [6], and to determine elastic and viscoelastic material properties in composite [7], [8], have been studied different procedures.
In this work a proposal to apply model updating to a simple structure, using single measured point to establish dynamic parameters is studied. Complex mathematical procedures like those used for non linear transient phenomena should be applied with an updated model of the structure, which is typical based on modal testing. A fine characterization of a plate with non uniform stiffness properties (E, G) using the Frequency Response Function (FRF) of a single measurement point in a free-free modal test is proposed. Modal parameters obtained with operational modal test are compared with the previous ones in order to simplify the test method for manufacturing process.
The first step in the procedure is to define clearly the structural behaviour of the basic plate, in order to have a reference for comparison with new specimens. For this, a classical modal test is carried out with an adjustment of the FRF and, to avoid an excessive data measurement, a Finite element model is updated and used to identify the modes shapes. Because the structure itself is not complicated, simple geometry and no joints, the frequency and the corner point stiffness for several modes (more than 10) are used for the model updating process.
1.2. Studied Cases
The procedure is applied to tempered monolithic glass plates of 1938 x 876 mm dimensions and 5 and 10 mm thickness, that are slightly anisotropic. As it was mentioned previously, free modal test were carried out; plates were excited with an impact hammer at one of the corners in order to obtain a transfer function with all of the modes of the plate. Acceleration was measured at the same point. Frequency range varies from 0 Hz to 120 Hz.
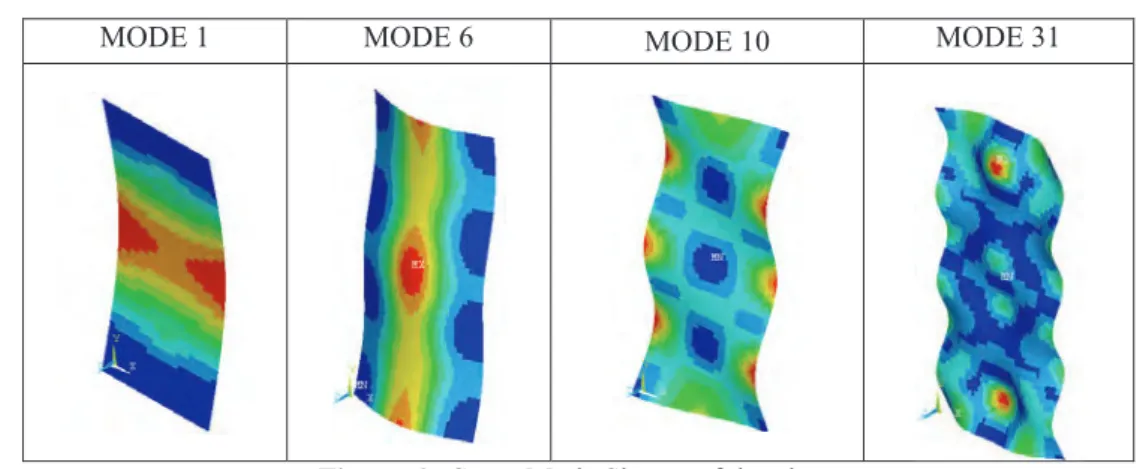
From the FRF natural frequencies, damping and modal stiffness are estimated. These last parameters allow the identification of the modes of vibration so that mode shapes do not need to be measured in the test. In addition, coupled modes can be identified, which is helpful in the following process. Then an optimization process and non-uniform pattern are established.
2. TEST DATA
2.1. Test and Results
The test data used on this work are part of the experimental work carried out with an impact pendulum designed following the UNE-EN 12600, and is detailed on references [9], [10]. Glass panes of different thicknesses and support conditions have been tested after an identification with two modal test: free-free conditions, used for the present work, and attached to the frame conditions. Figure 1 presents the free-free setup with two accelerometers located on the plate. More details on the test are presented in reference [10].
Figure 1. Accelerometer location on free - free condition modal test.
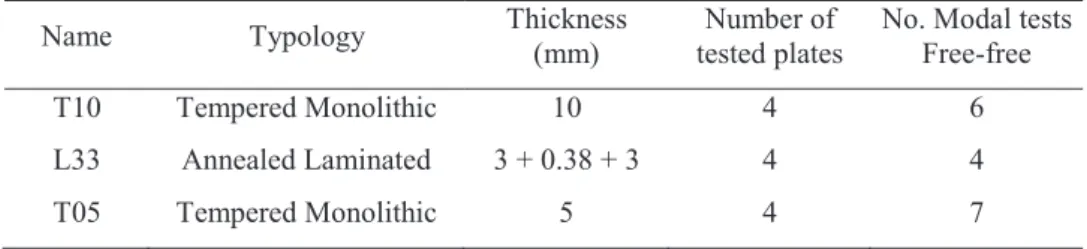
For the current study results of specimens T10, T05, and L33 are used. In order to check for the influence of different stiffness and glass configuration, two different typologies of glass (laminated with PVB, and monolithic), are used. The dimensions are 876 mm width and 1938 mm length with. The main characteristics, the number of plates used for each group, and the number of modal test performed on these typologies are summarized on Table 1.
Table 1. Test specimens selected for the study.
Name Typology Thickness
(mm)
Number of tested plates
No. Modal tests Free-free
T10 Tempered Monolithic 10 4 6
L33 Annealed Laminated 3 + 0.38 + 3 4 4
T05 Tempered Monolithic 5 4 7
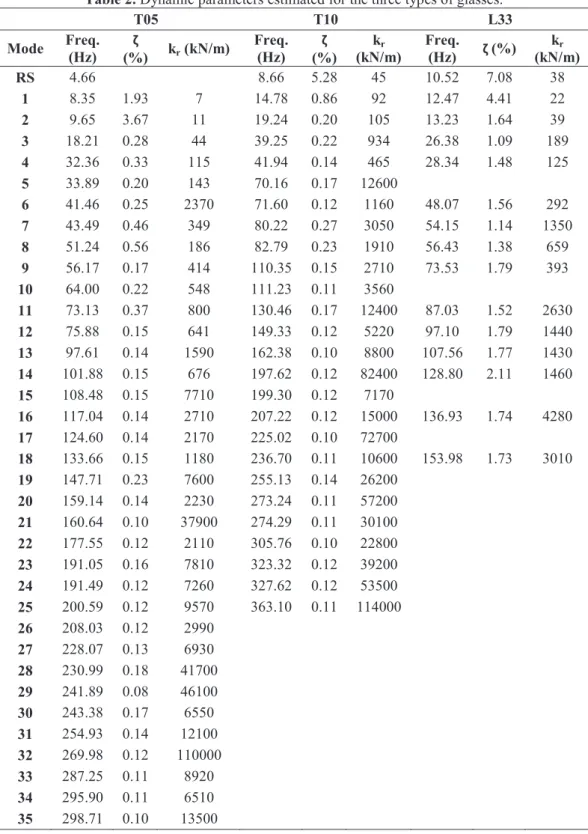
Table 2. Dynamic parameters estimated for the three types of glasses.
T05 T10 L33
Mode Freq.
(Hz)
ζ
(%) kr (kN/m)
Freq. (Hz) ζ (%) kr (kN/m) Freq.
(Hz) ζ (%)
kr
(kN/m)
RS 4.66 8.66 5.28 45 10.52 7.08 38
1 8.35 1.93 7 14.78 0.86 92 12.47 4.41 22
2 9.65 3.67 11 19.24 0.20 105 13.23 1.64 39
3 18.21 0.28 44 39.25 0.22 934 26.38 1.09 189
4 32.36 0.33 115 41.94 0.14 465 28.34 1.48 125
5 33.89 0.20 143 70.16 0.17 12600
6 41.46 0.25 2370 71.60 0.12 1160 48.07 1.56 292
7 43.49 0.46 349 80.22 0.27 3050 54.15 1.14 1350
8 51.24 0.56 186 82.79 0.23 1910 56.43 1.38 659
9 56.17 0.17 414 110.35 0.15 2710 73.53 1.79 393
10 64.00 0.22 548 111.23 0.11 3560
11 73.13 0.37 800 130.46 0.17 12400 87.03 1.52 2630
12 75.88 0.15 641 149.33 0.12 5220 97.10 1.79 1440
13 97.61 0.14 1590 162.38 0.10 8800 107.56 1.77 1430
14 101.88 0.15 676 197.62 0.12 82400 128.80 2.11 1460
15 108.48 0.15 7710 199.30 0.12 7170
16 117.04 0.14 2710 207.22 0.12 15000 136.93 1.74 4280
17 124.60 0.14 2170 225.02 0.10 72700
18 133.66 0.15 1180 236.70 0.11 10600 153.98 1.73 3010
19 147.71 0.23 7600 255.13 0.14 26200
20 159.14 0.14 2230 273.24 0.11 57200
21 160.64 0.10 37900 274.29 0.11 30100
22 177.55 0.12 2110 305.76 0.10 22800
23 191.05 0.16 7810 323.32 0.12 39200
24 191.49 0.12 7260 327.62 0.12 53500
25 200.59 0.12 9570 363.10 0.11 114000
26 208.03 0.12 2990
27 228.07 0.13 6930
28 230.99 0.18 41700
29 241.89 0.08 46100
30 243.38 0.17 6550
31 254.93 0.14 12100
32 269.98 0.12 110000
33 287.25 0.11 8920
34 295.90 0.11 6510
MODE 1 MODE 6 MODE 10 MODE 31
Figure 6: Some Mode Shapes of the plate.
In order to adjust the FEM with the test data for the frequencies, an optimization procedure has-been used.
The objective function used for the model updating is the root mean square (RMS) of the frequencies differences Eq.(4), and the design variables are the Young Modulus for two directions. Table 3 presents the results of optimizations performed for the three glasses. The first column indicates the
type of glass. The second and third columns are the updated values for the Young’s Modulus of each
model. The last column represents error in frequencies between experimental and model data.
ܴܯܵ ൌඨσ ൬ ೞǡ ǡ ೞǡ ൰ మ ಿ భ ே (4)
Table 3. Optimization process results for the glass plates.
Young’s modulus (GPa) Frequency error
Model Ex Ey RMS (%)
T10 67.8 70.0 4.19
T05 68.7 69.4 4.66
L33 71.7 73.6 1.01
4. OPERATIONAL MODAL ANALISYS
4.1. Operational Modal procedure
After determining the modal parameters of the frequency response for the considered plates by using the Classical Modal Analysis techniques, the next step consists on obtaining similar results by using an alternative method. The Operational Modal Analysis techniques are a good alternative, since it is necessary to measure only the response of the structure. The Stochastic Subspace Identification (SSI) methods are one of the most robust output-only identification techniques. Those methods are based on complex mathematical algorithms where the modes are extracted directly from time data samples.
Consequently, to apply this technique it has been necessary to develop a software tool able to compute all these complex mathematics in a fast way. This issue has been solved by using National Instruments LabView 9, which provides a library of Modal Analysis tools including the mentioned algorithm.
5. CONCLUSIONS
This paper proposes the first step of a method for measuring the thickness of a glass plate based on the use of modal stiffness at one single point.
The use of modal stiffness at one single point with FE model, is appealing as it can be easily used in simple structure models updating and using data from non-destructive modal test.
The natural frequencies of the plate changes in the same way that the thickness. This fact allows knowing geometrical differences between the test plate and the reference one.
Operational Modal analysis has been used to estimate the dynamic response of free-supported system. With operational modal test the natural frequencies can be determined as well as from the classical way. It can be said that operational modal analysis can be implemented as quality assurance.
Modal stiffness at one point provides all the information needed for the structural behavior of the plate. This fact allows detecting non uniform stiffness distributions due to manufacturing process.
Therefore, with this method, thickness and other manufacturing errors can be detected. This measuring procedure avoids the typical problems of excessive time consuming or the high cost of some measurement systems. For all these reasons, a more detailed study should be performed to incorporate this alternative methodology in the current quality control process.
ACKNOWLEDGEMENTS
The authors wish to thank to the Ministry of Science and Innovation for the founds received from the Subprogram of Fundamental Research to work on the project BIA 2011-28959-C02-02.
REFERENCES
[1] Kim, J.A., (2014). Vibration-insensitive measurement of thickness variation of glass panels using double-slit interferometry. Optical Society of America, Vol 22, No.6 Optics Express 6494.
[2] Roose, S., Stockman, Y., Rochus, P., Kuhn, T., Lang, M., Baier, H., Langlois, S., Casarosa, G. (2009). Optical methods for non-contact measurements of membranes, Acta Astronautica 65 1317-1329.
[3] Pagnacco, E., Moreau, A., Lemosse, D., (2007). Inverse strategies for the identification of elastic and viscoelastic material parameters using full-field measurements, Materials Science and Engineering A (452-453) 737-745.
[4] Lin, T.R., (2012). An analytical and experimental study of the vibration response of a clamped ribbed plate, Journal of Sound and Vibration 331 902-913.
[5] Alfano, M., Pagnotta, L., (2007). A non-destructive technique for the elastic characterization of thin isotropic plates, NDT&E International 40 112-120.
[6] Alfano, M., Pagnotta, L., (2006). Determining the elastic constants of isotropic materials by modal vibration testing of rectangular thin plates, Journal of Sound and Vibration 293 426-439.
[7] Barkanov, E. , Skukis, E., Petitjean, B., (2009). Characterisation of viscoelastic layers in sandwich panels via an inverse technique, Journal of Sound and Vibration 327 402-412.
[8] Rébillat, M., Boutillon, X. (2011). Measurement of relevant elastic and damping material
properties in sandwich thick plates, Journal of Sound and Vibration 330 6098-6121.
[9] Postigo, S. (2010). Estudio teórico experimental de impactos humanos contra vidrios de
acristalamientos de edificación. PhD Thesis , Universidad Politécnica de Madrid.
[11]Perera, R., Ruiz, A., Manzano, C., (2009). Performance assessment of multicriteria damage identification genetic algorithms, Computers and Structures 87 120-127.