This work is licensed under a Creative Commons Attribution-NonCommercial-NoDerivatives 4.0 International License (CC BY-NC-ND 4.0).
Experimental protocol to assess the tourism vehicles accessibility
based on heart rate and access time measurements.
Enrique Acalá Fazio
Dr. Industrial Engineer, INSIA-Universidad Politécnica de Madrid, Spain
Nuria Álvarez Fernández
Industrial Engineer, Universidad Politécnica de Madrid, Spain
ABSTRACT
The objective of the Project is to define an experimental protocol for the accessibility assessment of the transport vehicles, by analysing the evolution of the effort and time variables consumed by a target group –Persons of Reduced Mobility (PMRs). This protocol consisted in tests of accessibility on a sample of 6 passenger cars (class M1) by 8 elderly people carrying a heart rate monitor, and whose access manoeuvres were recorded by video cameras.
Based on the Hilloskorpi et al. [1] model and by developing a method of truncation of the heart rate (HR) tests records - eliminating the component of the work biologically needed by the organism to keep its basal metabolic rate from the work each person performed – it was possible to evaluate how much energy each individual invested in each access manoeuver. Immediately after each test, and after the whole round of vehicles, each participant was surveyed for a subjective assessment of the difficulty of accessing to the cars.
According to each of the above results, the HR objective measurements and the subjective opinion about the ease of access experienced by each individual, the vehicles were ranked by order of accessibility to the front and rear seats. The result of both rankings showed the orders of the similar vehicles, the potential of the method and a fair closeness between its results and the subjective, but real and unequivocal, judgments of the participants.
1. PURPOSE OF THE STUDY
1.1 Global perspective.
The global purpose of this study is designing a computer tool which allows any user to know the accessibility of any tourism vehicle. In this terms, this tool would have the same functionality as the well known Euro NCAP [2] tool but assessing the accessibility to each vehicle instead of its safety conditions.
Although this purpose can't be completely afford within the frame of this study, it is the constant guide of this investigation, and the achieved advances in this direction have been deeper than expected from the beginning, even more if taking into consideration the reduced resources to develop it.
1.2 Sense of the study.
This work is licensed under a Creative Commons Attribution-NonCommercial-NoDerivatives 4.0 International License (CC BY-NC-ND 4.0).
each time and have really important difficulties when talking about transport: People with Mobility Reductions (PMR). They already exist specific designed solutions for those people who have any specific mobility reduction which, for example, implies the use of a wheelchair. However, when talking about non-specific mobility reductions as, for instance, elderly people, disabled or pregnant, there is not any research about general solutions for them. There is no any conscious about how to ease the access to a vehicle to this kind of people and, by the way, to any passenger accessing to the vehicle.
This is the reason why 10 elderly volunteers from a Nursing Home were selected as the sample to analyze the maneuver event. In addition, all the access difficulties are more evident for these people, so easier to detect, and they would be benefit the most in case any improvement was achieve.
It is important not to get confused between accessibility and ergonomics into the vehicle once the passenger has finished the access maneuver, because in terms of ergonomics, lots of studies and investigations have been carried out.
2. METHODOLOGY
2.1 Process and challenges.
Along the process of this study, the main challenges have been:
1) Developing a mathematical method to analyze the access event and designing the access maneuver to define a control pattern to measure. For this purpose, lots of preliminary assays have been needed: Initial-Assays, to test the whole proposed protocol; Checking-Assays, to test the final protocol with an elderly person; Model-Assays, to get some values with a "pattern subject" to be considered as a reference to compare with all the results, Repetition-Assays, to assess the mathematical reliability of the designed mathematical method,
Accelerometer-Assays, to check the mathematical accuracy of the designed mathematical method, and the Definitive-Assays, to develop this study.
2) Assessing the criteria to choose the group of people participating in the assays as well as the sample of vehicles to be analyzed. Assessing the criteria to choose all the devices involved in the assays: HR meters and recording cameras. The vehicle's sample was composed of the following cars:
1) Familiar car.
2) Crossover SUV.
3) Hatchback.
4) Minivan.
5) Pickup.
6) Subcompact.
3) Designing the assays sessions plan in order to manage with all the involved parameters, devices and people participating in the assays sessions, not only the subjects sample, but also the needed working staff to coordinate the assays sessions.
4) Analyzing the access event in the properly mathematical way by working with all the experimental results.
This work is licensed under a Creative Commons Attribution-NonCommercial-NoDerivatives 4.0 International License (CC BY-NC-ND 4.0).
each of those influencing geometries.
2.2 Energy consumption calculation based on the heart rate (HR) measurement.
They way of measure the accessibility to any vehicle has been defined as the aggregate of spent time in the access maneuver and needed effort which has to be done by the person accessing to the analyzed vehicle so, at the end, the energy consumption made by this person. This measurement of the accessibility allows to compare measurements between vehicles and people, which is the first and main condition for the designed method to be considered as valid.
Based on previous medical studies [3], it was concluded that the most accurate way to calculate energy consumption was by registering heart rate behavior by wearing a HR meter to register the beats per minute (bpm) during the access maneuver and applying the properly equation in each case depending on the analyzed person in each assay.
Genre Physical activity
level
Equation
Female
Low Kcal/min= -4.70 + 0.0449 * HR - 0.0019
* weight + 0.00052 * HR * weight
High Kcal/min= -5.92 + 0.0577 * HR - 0.0167
* weight + 0.00052 * HR * weight
Male
Low Kcal/min = 4.56 - 0.0265 * HR - 0.1506
* weight + 0.00189 * HR * weight
High Kcal/min = 3.56 - 0.0138 * HR - 0.1358
* weight + 0.00189 * HR * weight
Table 1 – Ecuations from the Hilloskorpi et al. ¡Error! No se encuentra el origen de la referencia. model.
It is very important to note that this is one of the few models which supports the accuracy of the energy consumption calculation based on the HR when talking about non-intense physical activities, as it is the access maneuver, and the quite linear mathematical relation between heart rate and energy consumption per minute.
This work is licensed under a Creative Commons Attribution-NonCommercial-NoDerivatives 4.0 International License (CC BY-NC-ND 4.0).
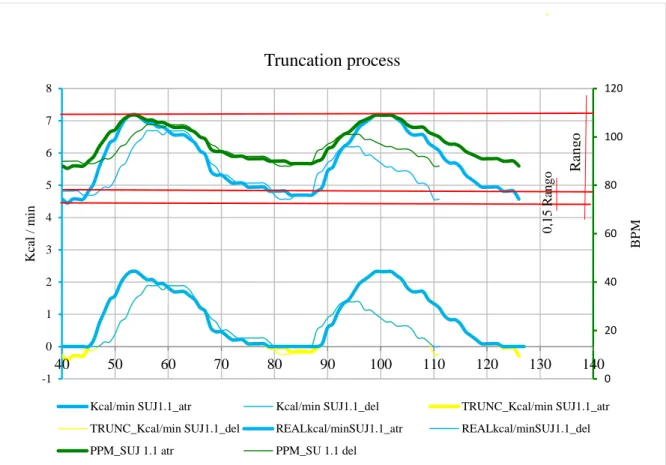
Figure 1 – BPM, Kcal/min based on HR and truncation process.
The control maneuver, as it is reflected in the previous graphic, began with the seated person in the front passenger seat; once his HR was stabilized and it did not go down any more, the person went out the car, walked 1.5m, turned back to the car and sat into the car again until the HR was stabilized again. This procedure was done twice in the front passenger seat and twice in the rear passenger seat (fig. 2).
0 20 40 60 80 100 120 -1 0 1 2 3 4 5 6 7 8
40 50 60 70 80 90 100 110 120 130 140
BP M Kc al / m in Truncation process
Kcal/min SUJ1.1_atr Kcal/min SUJ1.1_del TRUNC_Kcal/min SUJ1.1_atr
TRUNC_Kcal/min SUJ1.1_del REALkcal/minSUJ1.1_atr REALkcal/minSUJ1.1_del
PPM_SUJ 1.1 atr PPM_SU 1.1 del
This work is licensed under a Creative Commons Attribution-NonCommercial-NoDerivatives 4.0 International License (CC BY-NC-ND 4.0).
Figure 2: Test procedure.
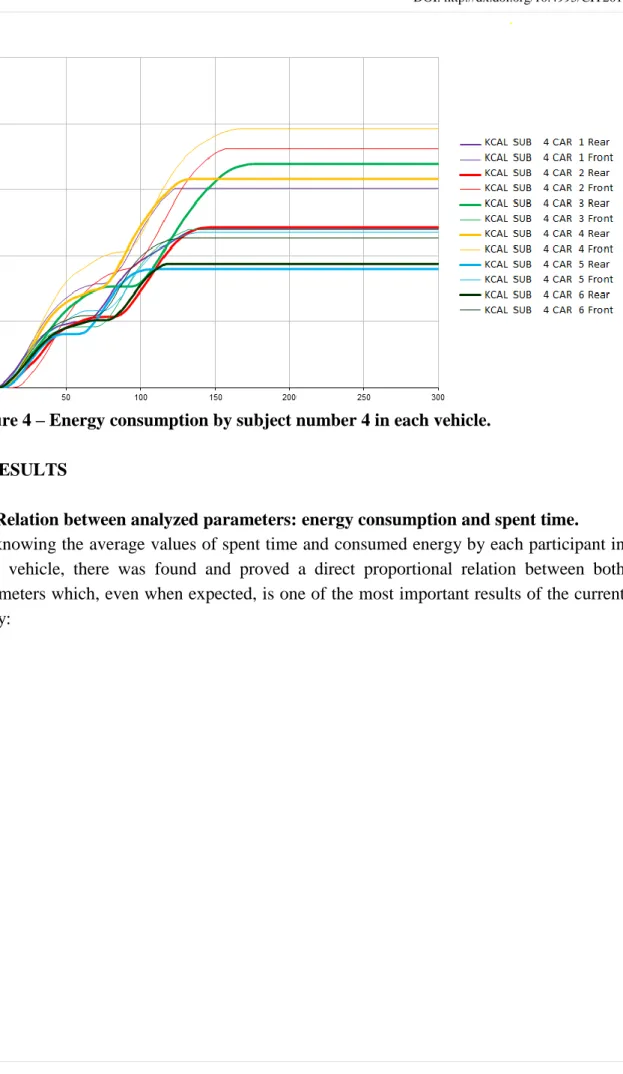
Integrating this energy consumption along the time, it is possible to have the final energy needed by each person to access to each car, and so, compare between cars and people. Set, as an example, the next graphics with the final energy consumption of each participant in the vehicle number 4, in the first one, and the total spent energy by the subject number 4 in each vehicle.
This work is licensed under a Creative Commons Attribution-NonCommercial-NoDerivatives 4.0 International License (CC BY-NC-ND 4.0).
Figure 4 – Energy consumption by subject number 4 in each vehicle.
3. RESULTS
3.1 Relation between analyzed parameters: energy consumption and spent time.
This work is licensed under a Creative Commons Attribution-NonCommercial-NoDerivatives 4.0 International License (CC BY-NC-ND 4.0).
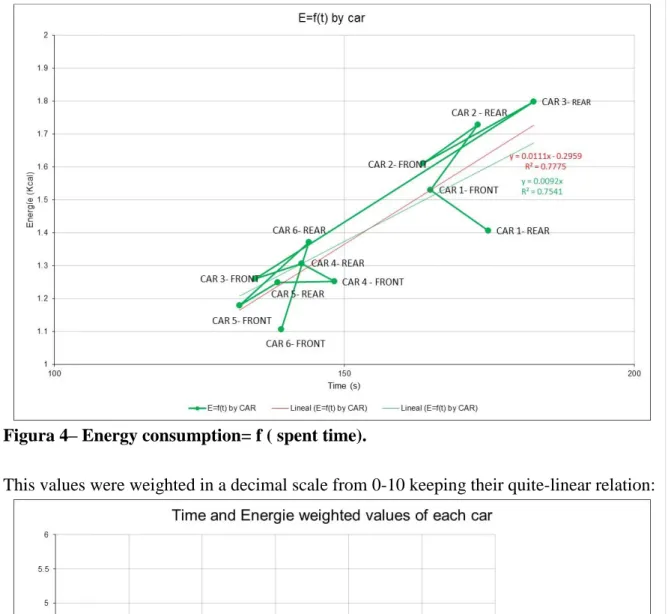
Figura 4– Energy consumption= f ( spent time).
This values were weighted in a decimal scale from 0-10 keeping their quite-linear relation:
Figure 5 – Linear weighting of energy consumption and spent time.
This work is licensed under a Creative Commons Attribution-NonCommercial-NoDerivatives 4.0 International License (CC BY-NC-ND 4.0).
as the representative parameter taking into account that spent time is already included in the first because of their linear relation and the integration of the energy consumption per minute along the time. Furthermore, to define an unique classification, it seemed obvious to use that one which represents the whole vehicle agglutinating front and rear seats. From the less accessible vehicle to the most accessible one, this classification is: 2, 3, 1, 4, 6, 5. Comparing this classification with the one arised from the treated surveys, the result is quite similar: 2, 3, 4, 5, 1, 6.
Only vehicle number 5 is two positions less valued in the surveys than it is positioned by numeric result but it is explained taking into account some considerations adopted along the study.
3.2 Influencing geometries.
By knowing around 70 measurements from each vehicle, and comparing them with the energy consumption in each one, it was found that some of the most influencing geometries are: height of the door in both front and rear pillars and door width, height and width of the entrance step both from the interior and the exterior, height and width of the passenger seat, distance between entrance line and seat medium line, width between passenger seat and front dashboard or front seat (in the rear passenger seat), front dashboard height or front seat height (in the rear passenger seat), ceiling height, door handle height, window lower line height. There was no chance to study the relation between different geometries, but by an extrapolation process, some values were proposed to each of these single geometries as the best construction-geometries to be implemented in the vehicles design.
4. CONCLUSIONS
It has been proven that it exists a good correlation between the time spent by a person entering and exiting the vehicles and the energy assessment proposed method based on heart rate monitoring. By accepting time as a good estimator of the access difficulty it can be concluded that the developed energy assessment protocol can be used for each person to help him decide “his personal” best vehicle configuration.
The method has shown to be robust and sensible to vehicle configuration and it is considered to be a potential tool for the assessment of the level of difficulty of a specific maneuver of a person, mainly an elder person.
ACKNOLEDGEMENTS
This article is based on the Project "Desarrollo de un protocolo experimental de evaluación de la accesibilidad a los vehículos turismo en base a mediciones de frecuencia cardíaca y tiempo de acceso", October 2015 in Madrid, Spain.
This work is licensed under a Creative Commons Attribution-NonCommercial-NoDerivatives 4.0 International License (CC BY-NC-ND 4.0).
[1] ALCALÁ E, ÁLVAREZ N, (2015). Desarrollo de un protocolo experimental de evaluación de la accesibilidad a los vehículos turismo en base a mediciones de
frecuencia cardíaca y tiempo de acceso. ETSII UPM. Madrid, España.
[2] Euro NCAP. EuroNCAP.com. [En línea] http://www.euroncap.com/en.
[3] HILLOSKORPI H.K, MÄNTTÄRI A.T, LAUKKANEN R.M, FOGELHOLM M.G,