Influence of the stop/start system on C0
2
emissions of a diesel vehicle
in urban traffic
Natalia Fonseca*, Jesus Casanova, Manuel Valdes
Universidad Politecnica de Madrid, Department of Energy Engineering and Fluid Mechanics, c/jose Gutierrez Abascal 2, 28006 Madrid, Spain
A R T I C L E I N F O A B S T R A C T
This paper presents measurements of C02 emission and efficiency of stop/start technology on a diesel vehicle in urban traffic. Two four-wheel-drive diesel vehicles with on-board exhaust emission and vehicle activity measurement systems were tested in two urban driving circuits representative of downtown Madrid. The vehicles had similar turbocharged and intercooled diesel engines fulfilling the same Euro 4 emissions regulation; but one had an improved engine incorporating stop/start technology. C02 emission reduction of more than 20% for the car equipped with the stop/start system was obtained. Regardless of the variability in driving style, the grade and type of streets, traffic congestion, and the engine operating temperature, the car equipped with the stop/start system has intrinsically a lower C02 emission factor.
1. Introduction
Reduction of carbon dioxide emission from light-duty vehicles is one of the priorities in most environmental policies. An agreement to reduce C02 emissions from light-duty vehicles (European Parliament, 2009) has been signed in Europe Union, limiting C02 emissions to 130g/km, with progressive implementation from 2012 to 2015.
To fulfil such requirements, vehicle manufacturers have been forced to incorporate technological improvements such as weight lightening, engine size reduction, low-rolling-resistance tires, improved aerodynamics and hybridisation and electri-fication of vehicles. The "stop/start" (S/S) technology is an easy and low-cost solution, in which the internal combustion en-gine is automatically powered off when the car is stopped and restarted upon driver's demand or when needed. Thus, it eliminates fuel consumption during idling, as in the case of stops at traffic lights or jams, which can account for up to 10% of total consumption (Rueger, 2008).
The influence of the S/S system on fuel economy and emissions has been studied mainly because of the current interest in hybrid vehicles. Henein et al. (2000) studied the effect of start transients on fuel consumption and hydrocarbon (HC) and NOx emissions using direct-injection diesel engines. They proved that stopping the engine reduces fuel consumption, even if some energy is consumed stopping and starting the engine. Moreover, they showed that the shutdown time had a consid-erable influence on NOx emissions. Bishop et al. (2007) performed chassis dynamometer tests to determine the fuel economy improvement of an S/S system, noting a 5.3% reduction in fuel consumption in the city FTP75 test cycle. Yu et al. (2008) con-ducted experiments on a gasoline engine coupled to an eddy-current dynamometer and showed that HC transient emissions are higher when the engine is quickly started in the original engine calibration mode.
By a subsequent signal processing, instantaneous mass emissions of each pollutant and fuel consumption could be determined.
When dealing with on-board measurements in urban traffic, the grade of the road plays a significant role in instantaneous emissions and fuel consumption, as well as in averaged values. Fuel consumption increase in upgraded streets could not be compensated by downgraded streets, thus it is an important parameter to be also registered. Also, average speed is a variable that affects significantly to fuel consumption.
To explain the fuel economy and pollutant emissions results, the instantaneous power at wheels (based on the tractive force in each moment) need to be measured. It could be calculated from vehicle specification data, vehicle speed and accel-eration, front wind speed and road grade. In this work, the vehicle specific power (VSP) has been computed from the car characteristics and real traffic collected data.
2. Methodology
Forty-one driving are evaluated over 300 km driven in real traffic conditions; equivalent to about 20 h of instantaneous emission, atmospheric condition and dynamic variable measurements. Two four-wheel-drive vehicles equipped with an on-board emission and vehicle activity measurement system are used and all tests were conducted with the air conditioning system turned off.
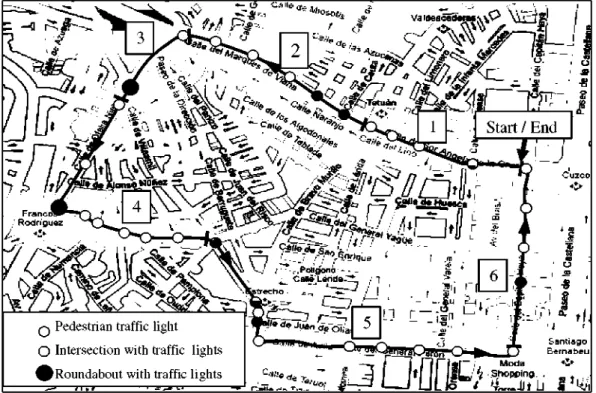
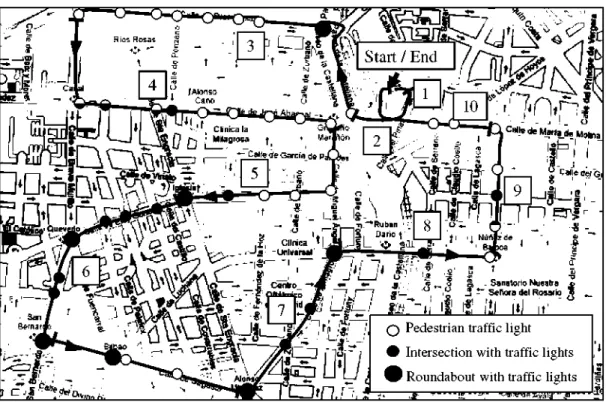
Two urban circuits were chosen to be representative of the congestion found in the city of Madrid, the "Tetuan" and the "Chamberi" circuits; both include streets with high average daily traffic. Each circuit has different types of streets, traffic light sequences and road grades. Figs. 1-4 show the characteristics of the circuits, including the locations of traffic lights and the orographic profile of the streets. Table 1 shows the characterisation of the circuits, including the speed without traf-fic recorded on a holiday morning.
The tests used two diesel Land Rover Freelander2 vehicles, one, a conventional 2009 year model (9MY) and the other one a 2010 model equipped with a stop/start system (10MY) that can be turned on and off (the latter designated as lOMY-eco off). The S/S system has some refinements over the original diesel engine as controlled smooth throttle closing and ramping down of fuel, an alternator that can be turned off during the shutdown procedure, modified engine calibration, a heavy-duty starter motor, a strengthened dual-mass flywheel and a special absorption glass mat battery.
A non-intrusive, universal on-board portable emission measurement system, MIVECO-PEMS and a portable global activity measurement system, PGAMS, were installed in the cars. The systems are designed and developed, based on commercial analysers and self designed components to be installed on-board. At the frequency of 10 Hz they measure CO, HC, NOx, X and exhaust gas flow, as well as other activities such as vehicle speed, engine speed, engine temperatures and atmospheric
?
7 2°
-M 7 1 5 " •53 710-S3
'i
™
5"
< 700 695
-Zone
0
0 \
0
/ 0
0 ^
^0
1 2 3
Distance (km)
Fig. 2. Orographic profile of the Tetuan circuit (LR1).
' Start /End ^ !
Y4»^t
IP
. Sanatorio Nuestra v _3 ^~ Sefiora del Rasaria m
^ic°*;^&v.
O Pedestrian traffic light
• Intersection with traffic lights
^ Roundabout with traffic lights
I--HT-;M-J.;.'.I-J)--' J J-lt
Fig. 3. Map of the Chamberi circuit (LR2).
3 4 5 6 Distance (km)
7 8 9
Fig. 4. Orographic profile of the Chamberi circuit (LR2).
Characteristics of the urban circuits. Circuit name Tetuan Chamberi LRl LR2 Distance (km) 5.1 8.7 Number of intersect. 33 47 Intersect, per km 6.5 5.4 Speed without traffic (km/h) 25.6 27.6 Average daily occupation (vehicles/ day) 12,402 25,632 % Local streets 11 % Secondary streets 69 38 % Main streets 31 29 % Arterial streets 23
_ 2,0
-1,48 1,53 1,54
lOMY-on lOMY-off 9MY
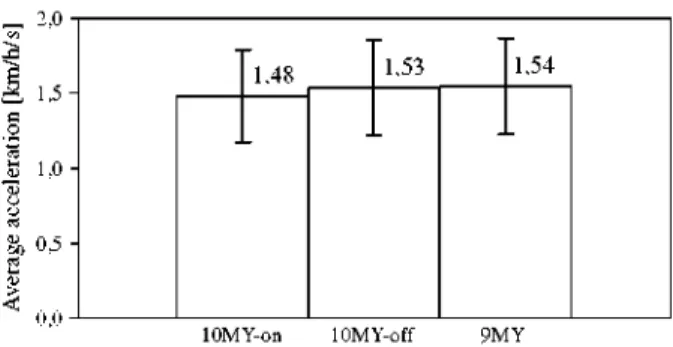
Fig. 5. Positive mean acceleration for version 2009 (9MY) versus version 2010 (10MY) with the S/S system on and off.
As part of the signal post-processing (synchronisation of real-time recorded signals and thermodynamic and fluid mechanics calculations), the instantaneous mass emissions, total emissions and emission factors are calculated for each tests and for the sectors in the two circuits. The on-board instrumentation set, including the energy supply system, had a weight of 110 kg, corresponding to a vehicle loaded of 110 kg plus a driver and passenger.
A professional driver instructed to use the same pattern and driving style in all tests drove both vehicles. A "normal" driv-ing style was used, in which acceleration and deceleration are varied accorddriv-ing to the classification of Casanova et al. (2009). Fig. 5 shows average and standard deviation of the positive mean acceleration of all tests for each car.
3. Results
The tests were performed on weekdays for different levels of traffic congestion, therefore, travel times, average speeds, and stop/start times varied between tests. The results are presented as plots of trends as a function of speed, the most rep-resentative variable in traffic conditions. For example, Fig. 6 shows the trend of C02 emissions versus average speed based on total emissions for each test and shows the strong influence of this variable. The average speeds for all tests were between 9 and 20 km/h, whereas the average speeds without congestion were 25.6 km/h on the Tetuan and 27.6 km/h on the Chamberi circuit.
Fig. 7 shows the average and standard deviation values of C02 emission factors for each vehicle for all tests of both urban circuits. Compared with the conventional car (9MY), the figure shows that, in congested urban traffic (average speed of
400
=* Si] ^^ r j
0
u
s-(1 U u. c q ••/> E inm
300 250 200 150 0^ ^ « lOMY-off
•
lOMY-on
i i i
«9MY c10MY-off
, 9MY • i •lOMY-on • i
13 15 17
Average speed (km/h)
19 21
9MY
-lOMY-off
-lOMY-on
i 1 i
H - M
1 1 1
50 100 150 200 250 300 350
C 02 Emission factor (g/km)
Fig. 7. Average and standard deviation values of C02 emission factor. Version 2009 (9MY) and version 2010 (10MY) with the Start/Stop system on and off. Madrid urban traffic, average speed 15.5 km/h.
15.5 km/h), the C02 emission is reduced by more than 20% when using the car equipped with the S/S system (lOMY-on). From these results, it can be estimated that a 12.2% fuel consumption reduction (lOMY-off versus lOMY-on) can be attrib-uted to idle consumption and 8% (9MY versus lOMY-off) to engine calibration and optimisation of the version 10MY with the S/S system.
To better understand the reasons for such fuel economy improvements, a multivariable modal analysis has been per-formed to analyse the influence of the new engine calibration of the stop/start version on C02 emission factor in real urban traffic. It is known that in real urban traffic, fuel consumption and pollutant emissions depend mainly on specific engine characteristics, but the variability observed is due to the influence of factors related to traffic congestion (average speed:
SVa in km/h) (De Vlieger et al., 2000), driving style, street configuration and engine operating conditions. Each circuit was
divided into different zones (six zones in the Tetuan circuit and 10 zones in the Chamber! circuit), as shown in Figs. 2 and 4.
For the multivariable analysis, average acceleration (Av in km/h/s) was included in order to represent the driving style.
Although the average acceleration is quite similar in all tests, small differences caused by the randomness of traffic strongly influence the C02 emission factor (eVC02 in g/km).
The variables related to the configuration of the streets are road grade (G in %) and type of street (ts). ts is an index that
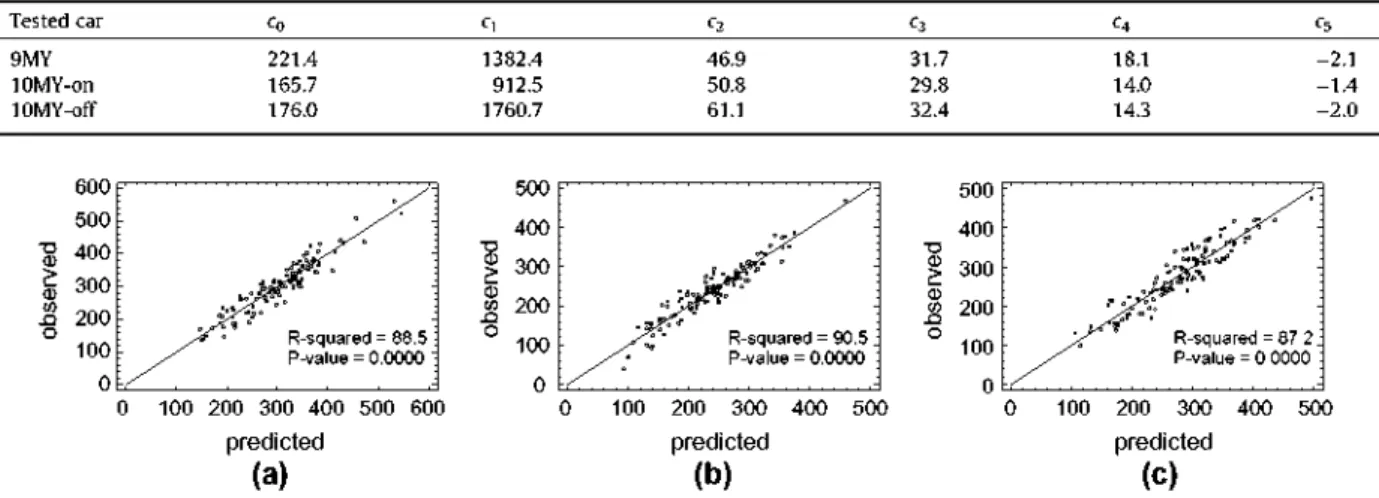
evaluates the flow of traffic for which the street was designed, being 0 for streets with very low traffic flow and 1 for those with very high traffic flow. The values used are as follows: 0.15 for local streets, 0.30 for secondary streets, 0.45 for main streets, 0.6 for arterials, 0.75 for bypass streets and 0.9 for highways. The most important variable related to the engine oper-ating conditions is the average engine oil temperature (TE in °C), because C02 emissions increase when the engine is cold due to reduced mechanical efficiency. The general mathematical expression for each vehicle is
Sva
SVC02 = Co + 7; h C2 • Ay + C3
^
c5 • TE (1)Coefficients for the tested vehicles are shown in Table 2 and the fitting values in Fig. 8.
The regressions indicate that regardless of the variability imposed by external factors such as traffic congestion, driving style, configuration of the streets and engine operation conditions, the vehicle equipped with S/S system has the lower intrinsic C02 emission factor (c0[10MY-on] = 165.7 g/km), showing a significant improvement over the conventional model
Table 2
Coefficients of the
Tested car
9MY lOMY-on lOMY-off
empirical models.
Co 221.4 165.7 176.0
Cl
1382.4 912.5 1760.7
c2
46.9 50.8 61.1
c3
31.7 29.8 32.4
Q 18.1 14.0 14.3
c5 - 2 . 1 - 1 . 4 - 2 . 0
100 200 300 400 500 600
predicted
(a)
100 200 300 400 500
predicted
(b)
R-squared = 87.2j P-value = 0.0000
100 200 300 400 500
predicted (C)
consumption in the three cases; nevertheless its influence is less critical for a car equipped with the S/S. For example, for the same driving style, engine temperature, type of street and a grade of 0%, a reduction in the average speed from 25 km/h to 15 km/h implies an increment of 37 g/km of C02 in a normal diesel vehicle, whereas for the vehicle equipped with S/S system the increment is only 24 g/km.
Fig. 9 shows that the slope and the type of street affect in a similar way to the two vehicles tested. An increase in the street gradient of only 1% can cause an increase in C02 emissions of approximately 30 g/km when maintaining the same speed pro-file in the three cases. Also C02 emissions may increase by 20% in local streets over secondary streets because of the higher frequency of stops. In contrast, Fig. 10 shows that the engine temperature and driving style do not affect in the same way to both tested vehicles. The vehicle with the S/S system (lOMY-on) is less affected by low engine temperatures; therefore, C02 emissions during a cold start are much lower than in the conventional version (LR-9MY). Furthermore, aggressive driving (about 3 km/h/s) can result in an increase of more than 76 g/km of C02 emissions in the vehicle with S/S system turned on and almost 92 g/km in the vehicle equipped with S/S system turned off.
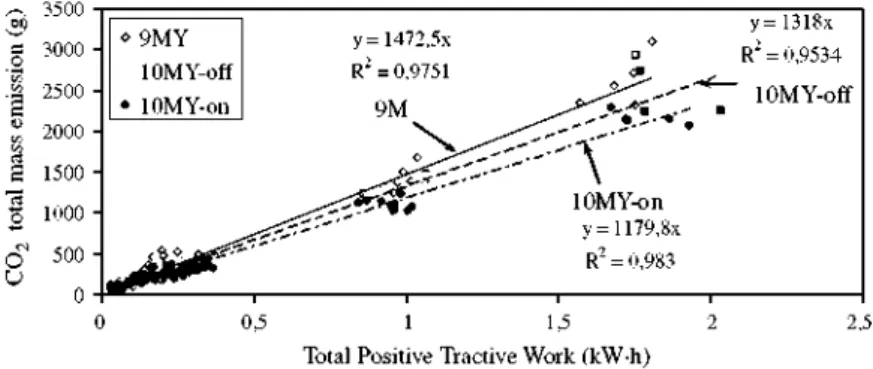
To calculate the energy C02 emission factor (e£C02 [g/kWh]) for each vehicle, instantaneous tractive power (Pt [kW]) is calculated based on the dynamic variables recorded in real-time, including road grade and wind speed. Thus, e£C02 is calcu-lated as the ratio between mass emission of C02 (calculated by summation of the instantaneous mass emission values mC02 averaged for each At period) and positive tractive work (PWt) for each zone and for each overall test, as shown in Eq. (2). PWt
was calculated as the integral of the positive areas of the curve of instantaneous tractive power.
SEC02
Z>C02 [g/h] • At
PWt [kWh] (2)
^ 4 0 0
-e
=S350-g 300 £
250.2 200
-'Si <si
'§ 1 5 0
-•A « 1 0 0 -U 5 0 0
-9MY
10MY -off
L
(5
—J"j
10IV
treet_Typ=0,15)
s - = -s-s-=": a-s^ — • — '
Secundary streets (Street_Typ=0,35) [Y-on
sf^-°^
-1,5 -0,5 0 0,5 Road grade (%)
1,5
Fig. 9. Trends of C02 emission factor versus road grade (%) for local and secondary streets. Version 2009 (9MY) and version 2010 (10MY) with the start/stop system on and off.
60 70 Average engine oil temperature (°C)
-Agressive lOMY-on
-Normal lOMY-on
-Agressive lOMY-off
-Normal lOMY-off
- Agressive 9MY
-Normal 9MY
—, 3500 -i •39
g 3000
.1 2500
" 2000
1 1500
| 1000
O 500
0
-o 9MY
• lOMY-off
• lOMY-on
< 3 .0- - M ^
y=1472,5x
R2 = 0,9751
9M
^s^F-'"""
y=1318x R2 = 0,9534 <*
~>^.-'' lOMY-off
lOMY-on
y=1179,8x R2 = 0,983
0,5 1 1,5 Total Positive Tractive Work (kW-h)
2,5
Fig. 11. Mass emission of C02 versus total positive tractive work (kW h) for version 2009 and version 2010 with the start/stop system on and off.
Fig. 11 shows the energy C02 emission factor as the linear relationship existing between mass emission of C02 and PWt for
each car. The factor is a measure of the overall efficiency of the vehicle because total positive tractive work represents the engine energy demand for kinetic energy, road grade, rolling resistance, and aerodynamic drag and mass emission of C02 represents the fuel consumption of the vehicle. It can thus be used to compare the vehicle's "global efficiency" and to predict the emission of C02 in urban traffic for a given circuit, based only on a characterisation of the road and the driving pattern. Therefore, following Fig. 11, there is an increase in overall efficiency due to integration of the S/S system in the vehicle (LR_10MY), even when driving with S/S disabled (LR_10MY-off). These results confirm the trend shown in Fig. 6 and the improvement in engine efficiency when it is operating in low-load conditions.
4. Conclusions
The three methods have been used to study the influence of the S/S on a four-wheel-drive diesel vehicle: measurement of average C02 emissions, modal statistical analysis and energy emission factor, show a significant reduction in C02 emissions in actual urban traffic; up to 20% at an average speed of 15.5 km/h. The reduction could be partly attributed to changes in the engine and partly to zero idling emissions. Additionally, modal statistical analysis explains the variability observed in the C02 emissions found in actual traffic flows. Finally, the energy emission factor analysis confirms that C02 emission reduction is due to better global energy efficiency of the vehicle with S/S system.
Acknowledgements
Part of this work was supported by the Spanish Ministry of the Environment. The authors acknowledge the contribution of Felipe Espinosa of the Universidad de Alcala for the development of the portable global activity measurement system, Land Rover Spain SL for providing the vehicles and undergraduate students Alfredo Fernandez, David Nieto, Emilio Cano, Vic-tor Criado and VicVic-tor Pozo for carrying out the tests.
References
Bishop, J., Nedungali, A., Ostrowski, G., Surampudi, B., Armiroli, P., Taspinar, E., 2007. An Engine Start/Stop System for Improved Fuel Economy, SAE Technical Paper 2007-01-1777.
Casanova, J., Fonseca, N., Espinosa F., 2009. Proposal of a dynamic performance index to analyze driving pattern effect on car emissions. In: Presented at 17th Transport and Air Pollution Symposium and 3rd Environment and Transport Symposium. Proceedings INRETS No. 122, Toulouse.
De Vlieger, I., De Keukeleere, D., Kretzschmar, J.G., 2000. Environmental effects of driving behaviour and congestion related to passenger cars. Atmospheric Environment 34, 4649-4655.
European Parliament, 2009. Setting Emission Performance Standards for New Passenger Cars as Part of the Community's Integrated Approach to Reduce C02 Emissions from Light-Duty Vehicles. Regulation (EC) No. 443/2009 of the European Parliament and of the Council of 23 April 2009, Official Journal of the European Union 5.6.2009 L140.
Fonseca, N., Casanova, J., 2009. Problemas asociados a la medida de emisiones masicas instantaneas en motores de vehiculos. Presented at VI Jornadas Nacionales de Ingenieria Termodinamica, JNIT2009, Cordoba.
Henein, N., Taraza, D., Chalhoub, N., Lai, M., Bryzik, W., 2000. Exploration of the Contribution of the Start/Stop Transients in HEV Operation and Emissions, SAE Technical Paper 2000-01-3086.
Rueger, J., 2008. Clean Diesel - Real Life Fuel Economy and Environmental Performance. Presentation SAE Government/Industry Meeting, Washington, DC. Yu, S., Dong, G., Li, L., 2008. Transient characteristics of emissions during engine start/stop operation employing a conventional gasoline engine for HEV