Inequalities in non communicable diseases and effective responses
13
0
0
Texto completo
(2) Series. Women. Europe and central Asia) of the total differences in agestandardised death rates between low-income and middleincome regions and high-income countries (figure 1). The contribution of NCDs to the all-cause mortality gap between these countries is more than 50% in all regions, except for sub-Saharan Africa and south Asia (for both sexes) and Latin America (men only). If adults in all regions had the same mortality from cancers, cardiovascular diseases, chronic respiratory diseases, and diabetes as did those in high-income countries, global mortality from these four diseases would be reduced by 27% for men and 29% for women, which would surpass the global NCD goal of a 25% reduction in mortality worldwide.. Men. Low-income and middle-income countries. Sub-Saharan Africa South Asia Central and eastern Europe and central Asia Middle East and north Africa Latin America and Caribbean East and southeast Asia and Pacific. NCD risk factors. High-income countries 0. 500. 1000 0 500 Death rate per 100 000 people. Cause of death Cardiovascular diseases Cancers Diabetes Chronic respiratory diseases. 1000. Other non-communicable diseases Communicable, maternal, perinatal, nutritional diseases Injuries. Figure 1: Age-standardised death rates by region in 2010 Data from Lozano and colleagues.2 Death rates are for all ages, and were standardised with the WHO standard population.27 Wellington, New Zealand (Prof T Blakely PhD); Department of Chronic Diseases and HealthPromotion, World Health Organization, Geneva, Switzerland (M J Cowan MPH); Noncommunicable Diseases Research Centre, Endocrinology and Metabolism Research Institute, Tehran University of Medical Sciences, Tehran, Iran (F Farzadfar MD); PROESA— Research Center for Social Protection and Health Economics, Universidad Icesi, Cali, Colombia (R Guerrero MSc); AXA Department of Health and Human Security, Graduate School of Medicine, University of Tokyo, Tokyo, Japan (N Ikeda PhD); African Population and Health Research Center, Nairobi, Kenya (C Kyobutungi PhD); World Health Organization, Malawi Country Office, Lilongwe, Malawi (K P Msyamboza PhD); The Ministry of Health, Phnom Penh, Cambodia (S Oum PhD); School of Population Health and Clinical Practice, University of Adelaide, Adelaide, SA, Australia (Prof J W Lynch PhD); School of Social and. 586. We provide an overview of global and within-country inequalities in NCD outcomes, risk factors, and interventions, with examples from countries at all stages of economic development and in different regions. Although we discuss NCDs in general, in examples we refer specifically to cancers, cardiovascular diseases, diabetes, and chronic respiratory diseases—four disease groups that together account for more than 80% of NCD deaths and are included in global goals.6 We then focus on effective actions to reduce NCD inequalities.. Global inequalities in NCDs NCD outcomes NCDs are often thought to increase with affluence and westernisation. In reality, this notion applies only to some NCDs, such as colorectal and breast cancers, which are more prevalent in high-income than in low-income countries. The rise in crude death rates from other NCDs as economic development progresses is mainly attributable to population ageing. The age-standardised death rate for most NCDs is lower in high-income countries than in low-income and middle-income countries (figure 1). Worldwide, the age-standardised NCD death rate in men is highest in eastern and central Europe and central Asia, mainly because of very high cardiovascular disease death rates; in women, this rate is highest in south Asia, mainly because of high cardiovascular and chronic respiratory disease death rates. NCDs account for between 8% (sub-Saharan Africa) and 85% (central and eastern. Major NCD risk factors are also increasingly concentrated in low-income and middle-income populations. Smoking prevalence in men is now highest in central and eastern Europe, and in parts of east and southeast Asia.1 Central and eastern Europe and parts of Latin America also have the highest NCD burden associated with harmful alcohol consumption.5 Blood pressure has decreased in high-income countries, but has stayed the same or increased in low-income and middle-income countries.28 Consequently, people in central and eastern Europe and sub-Saharan Africa have the highest blood pressure levels, which are at least 10 mm Hg higher than those recorded in high-income regions.28 Rates of overweight and obesity in Oceania, the Middle East, Latin America, and southern Africa now exceed those in most high-income countries.29 Raised cholesterol is now the only risk factor that is still highest in highincome countries.30 Additionally, low-income countries have the extra burden of substantially higher levels of NCD risk factors that are typically associated with poverty, including use of biomass fuels and coal for cooking and heating, which are risk factors for chronic obstructive pulmonary disease and lung cancer; fetal and early childhood under-nutrition, which are risk factors for cardiovascular and metabolic diseases in adult life; and infections that can lead to rheumatic heart disease, cardiomyopathy, heart failure, and cancers of the cervix, liver, stomach, and other sites.31. NCD healthcare People in low-income and middle-income countries have less access to NCD care and treatment, especially to primary care, which can effectively reduce some NCD risk factors and prevent advanced-stage disease and complications at relatively low cost by early detection and treatment. An overview of NCD care, management, and treatment through the health system is provided in WHO’s Global Status Report on Noncommunicable Diseases 20101 and in the reports on essential medicines for NCDs32 and health-system integration33 in this Series. One example of global inequality in primary care www.thelancet.com Vol 381 February 16, 2013.
(3) Series. A. Cambodia. Colombia. Iran. Malawi. South Korea. Community Medicine, University of Bristol, Bristol, UK (J W Lynch); and Institute of Health Equity, Department of Epidemiology and Public Health, University College London, London, UK (Prof M G Marmot MD). USA. 100. Diabetes treatment (%). Men. 75 50 25. Correspondence to: Prof M Ezzati, MRC-HPA Centre for Environment and Health, Department of Epidemiology and Biostatistics, Imperial College London, Norfolk Place, London, W2 1PG, UK [email protected]. 0 100. Women. 75 50 25 0. B 100. Men. 50 25 0 100 75. Women. Hypertension treatment (%). 75. 50 25 0 Lowest. Highest Lowest. Highest Lowest. Highest Lowest. Highest Lowest. Highest Lowest. Highest. Education. Figure 2: Diabetes and hypertension treatment coverage by education level in adults aged 25–64 years in selected countries This figure shows treatment coverage in all people with diabetes (A) or hypertension (B), irrespective of whether the disorders are diagnosed or undiagnosed, thus representing both under-diagnosis and under-treatment. Data are crude estimates; see appendix (pp 1–3) for results by age groups. In South Korea, and to a lesser degree in Iran, the age-specific associations of treatment coverage with education were a mix of direct, inverse, and no association. Education was categorised into three or four groups in each country, from lowest to highest. Cambodia: no formal schooling 23·1%; less than primary school 41·0%; primary school completed 20·2%; secondary school or higher 15·7%. Colombia: no formal schooling or less than primary school 23·9%; primary school completed 39·0%; secondary school completed 30·1%; university completed 7·0%. Iran: no formal schooling 27·4%; primary and middle school 40·7%; secondary school 21·9%; undergraduate and graduate 10·0%. Malawi: no formal schooling 22·3%; less than primary school 34·4%; primary school completed 27·7%; secondary school or higher 15·6%. South Korea: middle school or less 24·3%; secondary school 39·3%; college or higher 36·4%. USA: below secondary 17·2%; secondary/General Educational Development or equivalent 23·2%; college or higher 59·6%. Data are from an analysis of five nationally representative health examination surveys (Cambodia: STEPS 2010; Colombia: Encuesta Nacional de Salud 2007; Iran: Non-Communicable Disease Surveillance Survey 2005; Malawi: STEPS 2009; South Korea: three rounds of National Health and Nutrition Examination Survey between 2008 and 2010; USA: three rounds of National Health and Nutrition Examination Survey between 2005 and 2010).. interventions is that most European women undergo regular cervical cancer screening, compared with less than 10% of women in some countries in south Asia and sub-Saharan Africa.34 Similarly, analysis of nationally representative health examination surveys shows that two-thirds of people with diabetes and hypertension receive treatment in high-income countries such as South Korea and the USA, but coverage is less than 50% in low-income and middle-income countries, and lowest in sub-Saharan Africa (figure 2). Low access to treatment leads to poor prognosis and survival in patients with NCDs in developing countries. www.thelancet.com Vol 381 February 16, 2013. See Online for appendix. For example, patients with cancer in high-income countries have up to twice the survival rate of those in middle-income countries, and survival rates are even lower in India and Africa.35–37 The differentials are especially large for cancers that have good prognosis when diagnosed early, indicating that some treatment variation is caused by diagnosis inequalities.37 However, even diagnosed patients in low-income and middleincome countries receive less treatment than do their counterparts in high-income countries. For example, most European patients with coronary heart disease receive antiplatelet treatment, β blockers, and drugs to 587.
(4) Series. Panel: Non-communicable diseases in indigenous communities—inadequate response to large inequalities In 2001, when male life expectancy in the USA was more than 74 years, Native American men in southwest South Dakota had a life expectancy of 58 years, which was about the same as that of men in Eritrea.20 The excess mortality in Native Americans is partly attributable to higher mortality from road traffic accidents and other unintentional and intentional injuries, and partly to higher-than-average mortality from cardiovascular diseases, diabetes, liver disease, and a few other non-communicable diseases (NCDs). Native Americans who live on or near reservations also have some of highest mean body-mass index values, blood glucose concentrations, and prevalence of smoking and harmful alcohol use of all Americans.41,42 These trends exemplify the health and NCD status of indigenous populations in countries such as Australia, Canada, New Zealand, and the USA; in these countries, as in middle-income countries such as Mexico, the life expectancy of indigenous people is up to 20 years lower than that of non-indigenous populations.43,44 Health inequalities are inevitably affected by the fact that indigenous people are overwhelmingly poorer and receive less education than do non-indigenous populations.45 However, the health status seems to be worse even compared with non-indigenous groups with low socioeconomic status in the same country. For example, in the USA, the life expectancy of Native Americans living on or near reservations was about 2·5 years lower than poor white people in Appalachia, who also had low life expectancy. Elimination or reduction of these inequalities needs actions and policies in the social, economic, and health sectors. New Zealand and Canada have different approaches to management of NCDs and their risk factors in their indigenous populations. In New Zealand, the neoliberal reforms of the 1980s and early 1990s led to a larger increase in unemployment and poverty in Māori than in European populations, reduced health services, created a regressive consumption tax, and affected other social services including income and housing support and the introduction of user fees for other services.21 The health gap between Māori and non-Māori populations increased soon afterwards, with a rise in the contribution of cardiovascular disease and suicides to the overall mortality gap.21 The economic and social policies began to change in the mid-1990s, and became more pro-equity in 1999. Importantly, reduction of health inequalities and improvement of primary care became explicit goals of the government’s health policy, strengthened by high-quality evidence of their extent and trends.21 Challenges that remain include establishment of the most appropriate and effective strategies to reduce inequalities in risk factors such as smoking and to ensure that care is sought and delivered. Nonetheless, the more pro-equity policies and programmes seem to have helped to reduce health inequalities compared with their peak in the 1990s. By contrast with New Zealand’s efforts to reduce health inequalities, recent policy choices could worsen health inequalities between Canada’s indigenous population (the First Nations) and other groups. The Conservative Government’s economic policies have reduced and changed social and health services in ways that have especially adverse effects on the formulation and implementation of programmes related to First Nations’ health and nutrition. Some of these changes are broad and restrict First Nations’ rights to land and to economic, legal, and health decision making, while taking advantage of petroleum and mineral natural resources on their land.46 Other changes with potential adverse effects are related to specific programmes, such as the replacement of the Food Mail Programme, which increased access to healthier foods in communities in northern Canada.47 Qualitative assessments of the new Nutrition North Canada programme have raised concerns about lack of transparency in eligibility criteria46 and about whether the subsidies are passed on to people.48 Funding cuts to the First Nations Statistical Institute46 might exacerbate the situation further by making the data needed for reporting and accountability related to health inequalities difficult to obtain; data for monitoring health inequalities over time in New Zealand have been an important accountability mechanism.. 588. lower blood pressure and lipids,38 whereas, with the possible exception of antiplatelet treatment, coverage is systematically lower in low-income and middle-income countries, and is as low as 5% for statins.39,40. Within-country inequalities NCD outcomes Studies in high-income countries, especially those outside Asia, have shown that NCD mortality is higher in people with low education, income, or social class;8–17 those in marginalised ethnic groups (panel);18–21 and those living in poor and deprived communities.22–25 These socioeconomic gradients are generally smaller, and for some diseases even reversed, in southern Europe and Asia.9,10,49,50 Figure 3 shows age-standardised cancer and cardiovascular disease death rates in the lowest and highest quintiles of community socioeconomic status in England, Japan, New Zealand, and South Korea—four countries with complete death registration and medical certification of cause of death. In England and New Zealand, cancer and cardiovascular disease death rates of young and middle-aged adults (30–64 years of age) living in the most disadvantaged communities were 50–120 per 100 000 higher than were those in the communities with the highest socioeconomic status (figure 3). The absolute inequalities for these two diseases were less than 15 per 100 000 in Japan and less than 30 per 100 000 people in South Korea. At older ages, NCD mortality inequalities are even more distinct across countries. England and New Zealand had large absolute and relative inequalities in people older than 65 years, similar to the experience of those younger than 65 years. Inequalities in older ages were also evident in Japan, but had a smaller relative magnitude than was noted in Japanese people younger than 65 years. However, in South Korea, the mortality differential was very small at older ages, with a weak inverse relation for cardiovascular disease mortality. The different inequality patterns at older ages in South Korea, where there has been a rapid recent decline in adult mortality, could be due to cohort patterns of smoking, obesity, and dietary factors. For cardiovascular disease, the inequality might also be affected by assignment of cause of death, because more deaths are assigned to senility in communities of low socioeconomic status than in communities of high socioeconomic status; these deaths are probably mostly due to cardiovascular disease.51 Patterns by sex were similar to those for both sexes combined, although death rates and absolute inequalities were generally larger for men than for women. With the exception of South Korea, cancers, cardiovascular diseases, chronic respiratory diseases, and diabetes accounted for 45–75% of absolute inequalities in total (all-cause) death rates between the lowest and highest quintiles in people aged 30–64 years (figure 4); their contribution to inequalities in total death rates was 60–85% in older age groups. In other studies (mostly in high-income countries), investigators have reported that www.thelancet.com Vol 381 February 16, 2013.
(5) Series. A. www.thelancet.com Vol 381 February 16, 2013. Cardiovascular diseases Cancer Cancer. Cardiovascular diseases. B. Age-standardised death rate per 100 000 people per year Cancer Cardiovascular Cancer Cardiovascular diseases diseases Cardiovascular diseases. England. Men and women aged ≥65 years. Men aged 30–64 years. 250 200 150 100 50 0 250 200 150 100 50 0. D. Men aged ≥65 years. 2500 2000 1500 1000 500 0 2500 2000 1500 1000 500 0. E. Cardiovascular diseases. New Zealand. 2500 2000 1500 1000 500 0 2500 2000 1500 1000 500 0. C. Cancer. South Korea. 250 200 150 100 50 0 250 200 150 100 50 0. Women aged 30–64 years. 250 200 150 100 50 0 250 200 150 100 50 0. F Figure 3: Age-standardised death rates per 100 000 people per year from cancers and cardiovascular diseases in the lowest and highest quintiles of community socioeconomic status in four countries with complete vital statistics and medical certification (A) Data for men and women aged 30–64 years. (B) Data for men and women aged 65 years and older. (C) Data for men aged 30–64 years. (D) Data for men aged 65 years and older. (E) Data for women aged 30–64 years. (F) Data for women aged 65 years and older. See appendix (pp 4–10) for results for all socioeconomic status quintiles. In South Korea, death rates assigned to senility, which are likely to be mostly from cardiovascular diseases, as the underlying cause were 846 per 100 000 in the lowest quintile and 608 per 100 000 in the highest quintile.. Men and women aged 30–64 years Japan. Cancer. NCD inequalities are the most important source of inequalities in total mortality and life expectancy.12,18,20–22,52,53 Figure 3 also shows the importance of health inequalities both between and within countries. First, the most disadvantaged communities in Japan had lower cardiovascular disease death rates in people older than 65 years than did the most advantaged communities in the other three countries. Second, if the whole population in each country had the same cardiovascular disease and cancer death rates as the most advantaged quintile in that same country (ie, if within-country inequalities were reduced), mortality from these causes would decrease by 3–33% in these two age groups and four countries. Third, if the whole population in each country had the same cardiovascular disease and cancer mortality as the most advantaged quintile in Japan (ie, if both within-country and between-country inequalities were reduced), mortality from these causes would decrease by 3–41% in these age groups and countries. The differences in figure 3 between countries of similar wealth and economic development could be partly due to the different sizes of the units of analysis (appendix pp 4–10), since the largest differences are in England and New Zealand, which have smaller units of comparison than do Japan and South Korea. However, the data also show the importance of social, cultural, epidemiological, and health-care factors as determinants of health inequalities. For example, communities in South Korea and Japan might be less socioeconomically segregated, which could explain the more equitable mortality gradient across communities, although inequalities do exist in relation to individual socioeconomic characteristics in South Korea.50,54,55 In Japan, inequalities based on occupation are smaller, and for some NCDs are reversed, than in other high-income countries.49,56,57 Socioeconomic inequalities in New Zealand partly represent those associated with marginalisation of the indigenous Māori population, who have two-to-threetimes higher NCD death rates than do non-Māori populations21 and are disproportionately represented in disadvantaged communities. However, even after ethnic origin is accounted for, socioeconomic inequality persists, the magnitude of which ranges between 63% (for cardiovascular disease in women aged 30–64 years) and 93% (for cardiovascular disease in men aged ≥65 years) of those shown in figure 3.. 2500 2000 1500 1000 500 0 2500 2000 1500 1000 500 0. Women aged ≥65 years. Lowest. Highest. Lowest Highest Lowest Highest Quintile of community socioeconomic level. Lowest. Highest. 589.
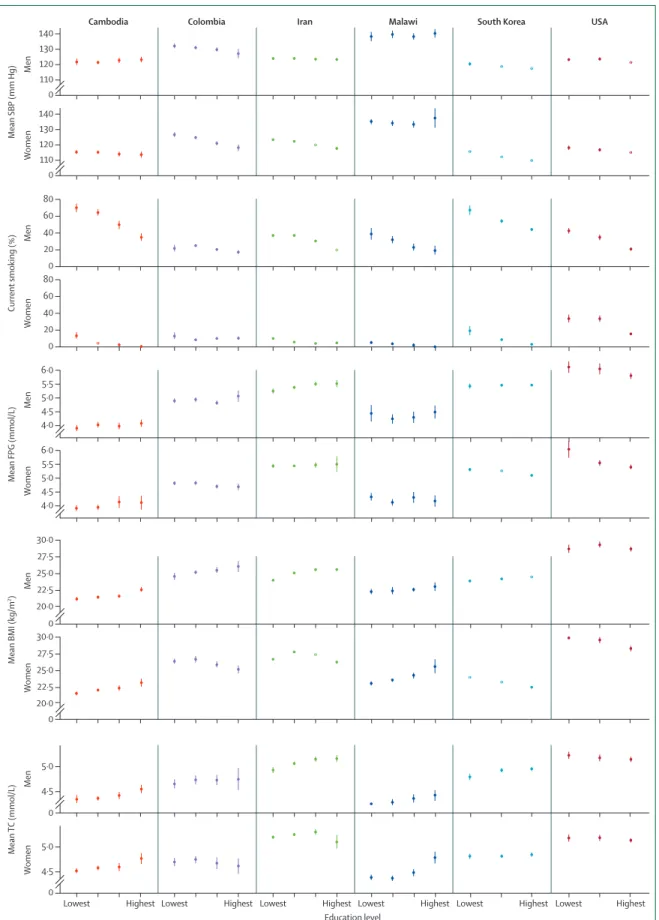
(6) Series. 30–64 years. ≥65 years. England. New Zealand *. South Korea. Japan. –25. 0. Cause of death. 25 Cancers. 50. 75 100 –25 0 Contribution to inequality in total mortality (%). Cardiovascular diseases. Chronic respiratory diseases. 25. Diabetes. 50. 75. 100. All other diseases. Figure 4: Contribution of selected non-communicable diseases to the absolute inequality in total (all-cause) death rates between the lowest and highest quintiles of community socioeconomic status in four countries with complete vital statistics and medical certification *In South Korea, 72% of the excess death rate in the lowest quintile compared with the highest quintile is attributable to deaths assigned to senility as the underlying cause; these are likely to be mostly from cardiovascular diseases.. Data for NCD mortality inequalities are more scarce in low-income and middle-income countries, especially nationally, perhaps because the few existing data have focused on measurement of adult mortality nationally, rather than inequalities within countries, as has been done for child mortality.26 In a national study in Mexico, poor regions had not only higher child mortality but also higher NCD burdens than did wealthier states.58 Emerging evidence also indicates that acute myocardial infarction and stroke are inversely associated with education in eastern Europe, but this association could be direct in Africa.59. NCD risk factors The socioeconomic patterns of major NCD risk factors show similarities and important differences across countries on the basis of region and stage of economic development. Smoking was more prevalent in people with less education in countries at all levels of economic development; this association was more pronounced in men than women (figure 5).60,61 By contrast with smoking, concentration of serum total cholesterol and body-mass index had positive associations with education in low-income countries and, for men, in middle-income countries,62–64 whereas in high-income countries, both risk factors were inversely associated with education in women but neither risk factor had an association with education in men (figure 5). Systolic blood pressure, which is affected by diet (salt intake and intake of fresh fruits and vegetables), blood-pressurelowering drug, and body-mass index, was inversely associated with education in middle-income and highincome countries, but had a weak positive association with education in men in low-income countries. Investigators have studied how risk factor inequalities change over time in the same community or country.65–75 These changes have varied by risk factor and study. Nonetheless, with the exception of blood pressure for which inequalities decreased in some studies, socioeco590. nomic gradients in risk factors have persisted or even increased, irrespective of whether overall risk factors increased or decreased. The appendix (pp 11–15) shows data for risk factor inequalities over time in the USA and South Korea—two countries with repeated national health examination surveys. With few exceptions, systolic blood pressure had a persistent inverse association with education in both countries. The notable decrease in systolic blood pressure in both countries meant that in the late 2000s, despite continued inequality, people with the least education typically had lower systolic blood pressure than those with high education had experienced in the early surveys. In the USA, decreasing smoking prevalence and rising concentrations of fasting plasma glucose concentrations between 1980 and 2010 were both accompanied by increasing inequalities in these risk factors for both sexes, as reported for smoking in other studies.65,66,68,71 The increasing inequality was largely attributable to a faster decrease in smoking and a slower increase in concentration of fasting plasma glucose in more educated individuals.65 In older Americans, there was little educational gradient in fasting plasma glucose and smoking in 1980, but by the late 2000s, people with less education had higher exposure to both risk factors. Educational inequality in smoking also increased in people younger than 65 years in South Korea, as overall prevalence decreased for men and increased for women. Body-mass index increased at all levels of education in the USA, and was accompanied by a narrowing of the differences between education groups; the same increase in body-mass index and lessening of inequality was detected for both men and women, with women having a substantially larger inverse educational gradient. In South Korea, the educational inequalities in body-mass index were greatest for women younger than 65 years and changed little over time. Prospective cohort studies and national comparative risk assessments have shown that social inequalities in risk factors such as smoking, blood pressure, cholesterol, www.thelancet.com Vol 381 February 16, 2013.
(7) Series. Cambodia. Colombia. Iran. Malawi. South Korea. USA. 140 Men. 110 0 140 Women. Mean SBP (mm Hg). 130 120. 130 120 110 0 80. Men. 40 20 0 80. Women. Current smoking (%). 60. 60 40 20. Men. Mean FPG (mmol/L). 6·0 5·5 5·0 4·5 4·0. Women. 0. 6·0 5·5 5·0 4·5 4·0. 30·0. 22·5 20·0 0 30·0 27·5. Women. Mean BMI (kg/m2). Men. 27·5 25·0. 25·0 22·5 20·0. Men. 5·0 4·5 0. Women. Mean TC (mmol/L). 0. 5·0 4·5 0 Lowest. Highest Lowest. www.thelancet.com Vol 381 February 16, 2013. Highest Lowest. Highest Lowest Education level. Highest Lowest. Highest Lowest. Highest. Figure 5: Selected noncommunicable disease risk factors by education level in adults aged 25–64 years in selected countries Risk factor levels were age standardised with the WHO standard population. All data are based on nationally representative health examination surveys listed in figure 2. See figure 2 for definitions of education levels in each country. SBP=systolic blood pressure. FPG=fasting plasma glucose. BMI=bodymass index. TC=total cholesterol.. 591.
(8) Series. glycaemia and diabetes, body-mass index, and alcohol use account for more than half of the absolute inequalities in important NCD outcomes, especially for cardiovascular disease and lung cancer.54,55,76–83 Thus, equitable reductions in risk factor exposure are essential to reduce social inequalities in NCD outcomes. However, in practice, irrespective of their aggregate success or failure in risk factor management, past prevention efforts have not generally reduced inequalities in risk factor exposure. Furthermore, disease prevention efforts should be assessed both on the basis of their aggregate benefits and in terms of their effect on social and geographical distributions of risk factors. To achieve this aim, accountability for NCD prevention should also incorporate within-country inequalities in risk factor exposure.6. NCD health care Inequalities also exist in financial and physical access to health care, and health-care use and quality, based on individual and community characteristics. These factors lead to inequalities in NCD screening, diagnosis, and treatment. In the PURE study,39 use of medication for secondary prevention after cardiovascular events was lower in patients in rural than in urban communities in low-income and lower-middle-income countries; this difference was smaller in upper-middle-income countries and absent in high-income countries. Screening for breast, cervical, colorectal, and prostate cancers increases with education and income.84,85 This association is consistent with the finding that socioeconomic gradients of survival are stronger for cancers with local symptoms that have a good prognosis if diagnosed and treated early than for cancers that present late and tend to have low survival (eg, lung and pancreatic cancers).86,87 Similar inequalities exist in glycaemic control and in microvascular and macrovascular complications of diabetes, on the basis of individual and community socioeconomic status.88 Although some differences in survival might be due to the higher prevalence of comorbidities in socially disadvantaged patients, documented factors at the health system level also have a role; such system-based inequalities are both more obvious and amenable to intervention.89,90 Notably, improved financial access to care through universal insurance improves treatment coverage and helps to reduce its socioeconomic gradient. For example, in the USA, universal insurance at 65 years of age was associated with lower racial and educational differences in blood pressure, cholesterol, and diabetes control.91 Similarly, at any education level, screening for breast, cervical, and colorectal cancers was about twice as common in people with insurance as in those without, and those who were insured had better survival than did uninsured (or underinsured) patients.92 Health insurance and universal accessible primary care also improve glycaemic control and reduce symptoms and complications in patients with diabetes.88,93 592. Figure 2 shows diabetes and hypertension treatment coverage according to education in several countries. Diabetes treatment coverage was positively associated with education only in Malawi and perhaps Cambodia (ie, the two low-income countries), and had a negative association in Iran, South Korea, and, for women, in Colombia. The inverse association in South Korea, and to a lesser degree in Iran, occurs because people with more education are generally younger, and younger people have lower treatment coverage; associations of treatment coverage with education within age groups were a mixture of direct, inverse, and no association (appendix pp 1–3). The inverse associations in Iran and Colombia are consistent with a role for universal insurance or other methods to remove financial barriers to health care to counteract treatment access inequalities. Coverage of hypertension treatment had no strong association with education, except in South Korea and in Iranian women, with similar explanations to those for diabetes treatment. Although universal insurance reduces health-care inequalities, it does not remove them completely. In Finland, where everyone is insured, high-income patients with stroke were more likely than were their low-income counterparts to be treated at a university hospital by a neurology specialist and to have a CT or MRI scan.94 There was also an inverse association between income and chronic heart disease case-fatality rates in Finnish patients95 Similarly, disparities in cancer screening and diabetes outcomes based on income and ethnic origin have been reported in insured patients in the USA.85,88 Health-care inequalities beyond financial access show the roles of other systemic factors, including lower density or quality of health-care facilities in poor communities, difficulties in arranging appointments for people who have little control over their work schedules, fundamental biases against poor and marginalised groups, and lower health-care use by some groups because health systems information and interactions are not designed for diverse users.. What can be done about NCD inequalities? The available worldwide data show that NCD mortality and most NCD risk factors are higher in low-income and middle-income countries than in high-income countries. NCDs and some of their most important risk factors tend to be higher in people and communities with a lower socioeconomic status within the same country, but differences in within-country patterns depend on the stage of economic development, and especially on social, economic, and health policies. Social inequalities in risk factors account for more than half of inequalities in major NCDs, especially for cardiovascular diseases and lung cancer. NCDs account for most inequalities in total mortality both between and within countries. Therefore, NCD inequalities are a major barrier in the reduction of the total burden of these diseases and in achievement of good health for all people. www.thelancet.com Vol 381 February 16, 2013.
(9) Series. The focus of policy discussions about NCDs in preparation for, and after, the UN high-level meeting has been a reduction of the total magnitude of NCDs. If the goals and targets set in these discussions lead to actions at the country level, they will help to reduce the absolute gap across countries if a similar percentage reduction is achieved in each country—a similar percentage translates into a larger absolute reduction in countries with higher NCD burdens. Further reduction of global inequalities will need actions and targets that focus on countries where NCD mortality and risk factors are presently highest—ie, generally low-income and middle-income countries. However, worldwide discussions have paid little attention to within-country inequalities. Yet, a decrease in overall NCD rates will need reduction of inequalities because the health of the most disadvantaged people contributes substantially to the overall NCD burden. Thus, reduction of the total NCD burden and of NCD inequalities should be treated as related and mutually reinforcing priorities. Past work into the causes of health inequalities has drawn attention to the roles of environmental, political, and psychosocial factors; health behaviours and proximal risk factors; and health-care access and quality. These factors are not mutually exclusive, since deprivation and poor working and living environments are themselves causes of hazardous health behaviours and low-quality health care. Actions to reduce NCDs and NCD inequalities should therefore rely on social and economic policies, and actions related to diet, lifestyle, and health care. Any one approach alone will be insufficient to reduce inequality, might not be implementable in isolation, and hence will need the other components to be effective. The Commission on Social Determinants of Health’s (CSDoH) recommendation of health equity in all policies, systems, and programmes aims to reduce NCD inequalities by equalising distributions of power, financial resources, education, housing, and other environmental factors, nutrition, and health care.96,97 As a timely step towards this aim, the policy recommendations and related targets and accountability mechanisms in the UN post-2015 development agenda should focus explicitly on how they can affect and address NCD and other health inequalities. The CSDoH recommended that fundamental social and economic inequalities and their institutional and political determinants should be addressed as one of the action principles to improve health and reduce inequalities. However, careful assessment of health inequalities in high-income countries indicates that welfare states, and their social policies, do not necessarily reduce health inequalities,98 partly because existing policies only partially redistribute income and wealth. Meanwhile, increasing evidence supports important roles for nonmaterial factors that have other social, cultural, behavioural, environmental, and public health and health system determinants in NCD inequalities.98 Thus, health inequalities, which are sometimes large, can still exist even with progressive social policies, because of inequalities in www.thelancet.com Vol 381 February 16, 2013. access and quality of primary care and treatment, or in risk factors related to diet, lifestyle, and living environment. For example, a country could have a seemingly pro-equity welfare state and organisation of social and health services, but simultaneously be at the stage of the tobacco epidemic in which large absolute differences in smoking prevalence between social groups cause wide health inequalities.99 This finding shows the need for strong policies and programmes that focus more directly on NCD risk factors and treatment, in addition to those that address social determinants. If implemented well and with equity as an explicit consideration, such policies and programmes could reduce NCD inequalities rapidly. Importantly, NCD inequalities could be as much a cause as a consequence of socioeconomic inequalities. In several countries, investigators have noted that so-called health shocks are associated with a worsening of household economic status through both reduced earnings and increased (at times catastrophic) health-care spending that can drive households into poverty. Increased health-care spending is exacerbated if health insurance coverage is low and out-of-pocket spending for health care is high. Emerging evidence suggests that NCDs not only lead to such worsening of household economic status, but also can have larger effects than communicable diseases.100,101 Thus, universal health insurance that ensures equitable NCD prevention and protects against NCD-attributable macroeconomic loss, income inequality, and poverty should be a social and economic priority. Social policies and programmes that improve opportunities and capabilities for economic productivity and social participation, and facilitate healthy lifestyles and environments, are essential to improve health and reduce inequalities. The most important are those that enhance early childhood development, improve access to highquality education, create home and school environments that facilitate good educational outcomes, and remove barriers to secure employment for disadvantaged groups.97 On the premise that both progressive social policies and NCD prevention and treatment programmes are necessary to address NCD health inequalities, other key actions to reduce NCDs and NCD inequalities are described in the following paragraphs. First, the nearly universal inequalities in tobacco smoking indicate the need for effective and equitable tobacco control. Similarly, global and within-country inequalities in blood pressure mean that actions are needed to reduce salt intake in disadvantaged groups to help to reduce NCD inequalities. Arguments are similar for harmful alcohol use and for other unhealthy versus healthy foods not covered in detail in this review. Population-wide and regulatory actions, such as mandatory salt, trans-fat, and sugar reductions in the food chain; taxes; and sales and advertising or marketing restrictions on tobacco, alcohol, or foods high in processed carbohydrates and saturated fats are probably pro-equity, although there have been few assessments of 593.
(10) Series. the equity implications of these actions.61,102–107 Despite industry efforts to portray taxes on harmful and unhealthy products as regressive, evidence suggests that groups with low socioeconomic status are responsive to price changes, leading to both health benefits and to a reduction in the relative tax burden.108,109 Similarly, government actions are essential to improve financial and physical access of disadvantaged social groups and communities to healthy foods, including fresh fruits and vegetables, healthy fats, and whole grains, through subsidies and broader food and agricultural policies. These actions can be financed by taxes on unhealthy foods, alcohol, and tobacco, but they need political and social support. Actions related to food have been implemented in some communities and countries (eg, New York City and some European countries110). A need exists to assess the effects of these programmes on inequalities and to test similar programmes in lowincome and middle-income countries. Health education could widen inequalities, unless the messages and their delivery are well designed and explicitly aim to reach out to and affect disadvantaged and marginalised social groups—eg, through community groups or broadreaching mass media.107,111 Second, inequalities in cardiometabolic risk factors, in infections that are risk factors or precursors for cardiovascular disease and cancers, and in diagnosis of early disease stages, emphasise the need to strengthen and use primary care for equitable prevention and treatment.31 A successful primary care programme in the control and management of diabetes in Iran93 is an example of the feasibility of universal, financially and physically accessible, and high-quality primary care as an effective way to reduce NCD burden and inequalities. To address NCDs through primary care, health workers need to be trained on screening and diagnosis of disorders that can have few symptoms in the early stages and, by contrast with some acute childhood and maternal diseases, involve longer term follow-up of diagnosed patients with disorders such as diabetes to improve compliance with medicines and behavioural change.93 Previous reports have examined the implementation of primary care, including the health system infrastructure and human resources.112 The report about health system integration in this Series discusses in detail the integration of NCD management in the primary care system in different health systems.33 Targeting of NCDs through the primary care system needs highquality, essential, and typically low-cost, drugs for prevention and early-stage treatment—including human papillomavirus and hepatitis B vaccines, Papanicolaou smear test or visual inspection with acetic acid for cervical cancer screening, drugs for cardiovascular risks and diabetes, and pain medications for terminally ill patients with cancer. Furthermore, there should be guaranteed access to such drugs, irrespective of the patient’s ability to pay, in order to reduce NCD inequalities. Issues related to drug selection, regulation of their quality, and their pricing 594. are discussed in the report about essential medicines for NCDs in this Series.32 Essential medicines for NCDs are financially feasible through procurement of generic drugs rather than branded versions. Third, beyond primary care, universal health insurance and other mechanisms for removal of financial barriers to health care are an essential component of any credible effort to reduce NCDs and NCD inequalities.113 A recent study,114 reviewed economic and political aspects of universal coverage, with emphasis on low-income and middle-income countries. Financial access needs to be accompanied by policies and strategies that reduce physical and behavioural barriers to health-care use and improve quality of care in disadvantaged communities. Fourth, coordination is needed with programmes and policies that target poverty-related risk factors that adversely affect early childhood development and communicable diseases. Even though such coordination can lead to large and long-term improvements in NCDs and risk factors that benefit poor and disadvantaged groups, it is difficult because it needs involvement of multiple sectors, including those that develop and implement policies and strategies related to energy, agriculture and rural development, and education. Health interventions can also be coordinated (or integrated) in specific programmes as platforms of intervention delivery; the report on health system integration in this Series describes in detail some of the potential challenges of integration.33 Finally, these actions should be accompanied by an accountability mechanism that records and regularly reports inequalities in NCDs and their risk factors alongside their aggregate benefits.6 Reporting of NCDs, and their risk factors and treatment, should be related to individual or community characteristics—both those that are somewhat comparable across countries (eg, rural or urban place of residence and education) and those that are country specific, such as geographical region and ethnic origin. How can this requirement be met in view of the fact that even national measurement of disease-specific mortality and risk factors is a challenge because of poor data availability, quality, and comparability? Data needs and challenges for aggregate (national) measurement also apply in measurement of inequalities.1,115 As an initial, relatively low-cost step, every data platform should collect information about place of residence and socioeconomic variables. In high-income and even middle-income countries, data can be linked across multiple sources that incorporate information about socioeconomic status and place of residence, but implementation of safeguards is necessary to ensure confidentiality and to overcome political and especially bureaucratic barriers. Even when such data are collected, data quality and comparability issues will need to be addressed, as has been done for the measurement of health outcomes and risk factors. However, in view of the importance of such data for proequity policies and programmes, and for assessment and modification of existing strategies, they should be treated www.thelancet.com Vol 381 February 16, 2013.
(11) Series. as essential components of a health information system. The inclusion of such variables in health statistics will also increase sensitivity towards inequalities, even if data are initially incomplete. As the debate about why inequalities arise and whether they are unjust continues, we should constantly recall that the existence, and persistence, of inequalities suggests failure to develop, enact, or implement policies and programmes that create healthy household and community environments, facilitate healthy lifestyles and diets, and deliver universal high-quality health care. Health inequalities can be reduced by feasible actions that bring aggregate benefits and reduce the overall NCD burden. Many of these actions involve health care and public health, whereas others need participation of sectors that address broader social, economic, and environmental issues. We should measure the success and failure of our societies and governments by how quickly, how widely, and how well we take these actions, and how much they reduce health inequalities. Contributors MDC, Y-HK, PA, TB, MJC, FF, RG, NI, CK, KPM, and SO collected and analysed data. MDC, Y-HK, PA, TB, CK, JWL, MGM, and ME helped to identify relevant studies. ME oversaw the research and wrote the first draft of the report. MDC, Y-HK, PA, TB, CK, and JWL helped to write specific sections of the article. All authors provided input into the final report. Conflicts of interest ME chaired a session and gave a talk at the World Cardiology Congress (WCC), with travel cost reimbursed by the World Heart Federation. At the WCC, he also gave a talk at a session organised by PepsiCo with no financial remuneration. Acknowledgments MJC is a staff member of WHO. The author alone is responsible for the views expressed in this publication and they do not necessarily represent the decisions, policy, or views of WHO. We thank June Atkinson and Peter Hambly for data, analysis, and methods related to mortality in England and New Zealand; Jorge Duarte for analysis of risk factors in Colombia; and Robert Beaglehole, Ruth Bonita, Pascal Bovet, Shah Ebrahim, Christopher Millett, participants in The Lancet Non-Communicable Disease Series review meetings, and anonymous reviewers for valuable comments on earlier drafts. PA is supported by a Wellcome Trust Clinical PhD Fellowship. TB is supported by the Health Research Council of New Zealand. NI is supported by a Grant-in-Aid for Scientific Research (B) from the Japan Society for the Promotion of Science. CK is supported by a Wellcome Trust research training fellowship. JL is supported by an Australia Fellowship awarded by the National Health and Medical Research Council. ME is supported by a Strategic Award from the UK Medical Research Council and by the National Institute for Health Research Comprehensive Biomedical Research Centre at Imperial College Healthcare NHS Trust. Analysis of data from England was done by the Small Area Health Statistics Units, funded by the Health Protection Agency in England as part of the Medical Research Council–Health Protection Agency Centre for Environment and Health at Imperial College London. References 1 WHO. Global status report on noncommunicable diseases 2010. Geneva: World Health Organization, 2011. 2 Lozano R, Naghavi M, Foreman K, et al. Global and regional mortality from 235 causes of death for 20 age groups in 1990 and 2010: a systematic analysis for the Global Burden of Disease Study 2010. Lancet 2012; 380: 2095–128. 3 Danaei G, Vander Hoorn S, Lopez AD, Murray CJ, Ezzati M; Comparative Risk Assessment collaborating group (Cancers). Causes of cancer in the world: comparative risk assessment of nine behavioural and environmental risk factors. Lancet 2005; 366: 1784–93.. www.thelancet.com Vol 381 February 16, 2013. 4. 5. 6. 7 8. 9. 10. 11 12. 13. 14. 15. 16 17 18. 19 20. 21. 22. 23 24. 25. 26. 27. 28. Ezzati M, Hoorn SV, Rodgers A, Lopez AD, Mathers CD, Murray CJ. Estimates of global and regional potential health gains from reducing multiple major risk factors. Lancet 2003; 362: 271–80. Ezzati M, Lopez AD, Rodgers A, Vander Hoorn S, Murray CJ. Selected major risk factors and global and regional burden of disease. Lancet 2002; 360: 1347–60. Beaglehole R, Bonita R, Horton R, et al. Independent global accountability for NCDs. Lancet 2013; published online Feb 12. http://dx.doi.org/10.1016/ S0140-6736(13)60101-4. Beaglehole R, Bonita R, Horton R, et al. Measuring progress on NCDs: one goal and five targets. Lancet 2012; 380: 1283–85. Mackenbach JP, Stirbu I, Roskam AJ, et al. Socioeconomic inequalities in health in 22 European countries. N Engl J Med 2008; 358: 2468–81. Avendano M, Kunst AE, Huisman M, et al. Socioeconomic status and ischaemic heart disease mortality in 10 western European populations during the 1990s. Heart 2006; 92: 461–67. Mackenbach JP, Cavelaars AEJM, Kunst AE, Groenhof F, Inequ EWGS. Socioeconomic inequalities in cardiovascular disease mortality; an international study. Eur Heart J 2000; 21: 1141–51. Marmot MG, Shipley MJ, Rose G. Inequalities in death—specific explanations of a general pattern? Lancet 1984; 1: 1003–06. Blakely T, Tobias M, Atkinson J. Inequalities in mortality during and after restructuring of the New Zealand economy: repeated cohort studies. BMJ 2008; 336: 371–75. Feldman JJ, Makuc DM, Kleinman JC, Cornonihuntley J. National trends in educational differentials in mortality. Am J Epidemiol 1989; 129: 919–33. Kilander L, Berglund L, Boberg M, Vessby B, Lithell H. Education, lifestyle factors and mortality from cardiovascular disease and cancer. A 25-year follow-up of Swedish 50-year-old men. Int J Epidemiol 2001; 30: 1119–26. Pappas G, Queen S, Hadden W, Fisher G. The increasing disparity in mortality between socioeconomic groups in the United States, 1960 and 1986. N Engl J Med 1993; 329: 103–09. Cox AM, McKevitt C, Rudd AG, Wolfe CD. Socioeconomic status and stroke. Lancet Neurol 2006; 5: 181–88. Chapin CV. Deaths among taxpayers and non-taxpayers income tax, Providence, 1865. Am J Public Health (N Y) 1924; 14: 647–51. Harper S, Lynch J, Burris S, Smith GD. Trends in the black–white life expectancy gap in the United States, 1983–2003. JAMA 2007; 297: 1224–32. Hahn RA, Eberhardt S. Life expectancy in four U.S. racial/ethnic populations: 1990. Epidemiology 1995; 6: 350–55. Murray CJL, Kulkarni SC, Michaud C, et al. Eight Americas: investigating mortality disparities across races, counties, and race-counties in the United States. PLoS Med 2006; 3: 1513–24. Tobias M, Blakely T, Matheson D, Rasanathan K, Atkinson J. Changing trends in indigenous inequalities in mortality: lessons from New Zealand. Int J Epidemiol 2009; 38: 1711–22. Ezzati M, Friedman AB, Kulkarni SC, Murray CJL. The reversal of fortunes: trends in county mortality and cross-county mortality disparities in the United States. PLoS Med 2008; 5: 557–68. Singh GK. Area deprivation and widening inequalities in US mortality, 1969–1998. Am J Public Health (N Y) 2003; 93: 1137–43. Eames M, Benshlomo Y, Marmot MG. Social deprivation and premature mortality—regional comparison across England. BMJ 1993; 307: 1097–102. Massing MW, Rosamond WD, Wing SB, Suchindran CM, Kaplan BH, Tyroler HA. Income, income inequality, and cardiovascular disease mortality: relations among county populations of the United States, 1985 to 1994. Southern Med J 2004; 97: 475–84. Gakidou E, Oza S, Fuertes CV, et al. Improving child survival through environmental and nutritional interventions—the importance of targeting interventions toward the poor. JAMA 2007; 298: 1876–87. Ahmad O, Boschi-Pinto C, Lopez A, Murray C, Lozano R, Inoue M. Age standardization of rates: a new WHO standard. GPE discussion paper series no. 31. Geneva: World Health Organization, 2001. Danaei G, Finucane MM, Lin JK, et al. National, regional, and global trends in systolic blood pressure since 1980: systematic analysis of health examination surveys and epidemiological studies with 786 country-years and 5·4 million participants. Lancet 2011; 377: 568–77.. 595.
(12) Series. 29. 30. 31. 32. 33. 34. 35. 36. 37. 38. 39. 40. 41. 42 43. 44. 45 46 47. 48. 49 50. 596. Finucane MM, Stevens GA, Cowan MJ, et al. National, regional, and global trends in body-mass index since 1980: systematic analysis of health examination surveys and epidemiological studies with 960 country-years and 9·1 million participants. Lancet 2011; 377: 557–67. Farzadfar F, Finucane MM, Danaei G, et al. National, regional, and global trends in serum total cholesterol since 1980: systematic analysis of health examination surveys and epidemiological studies with 321 country-years and 3·0 million participants. Lancet 2011; 377: 578–86. Ezzati M, Riboli E. Can noncommunicable diseases be prevented? Lessons from studies of populations and individuals. Science 2012; 337: 1482–87. Hogerzeil HV, Liberman J, Wirtz VJ, et al, on behalf of The Lancet NCD Action Group. Promotion of access to essential medicines for non-communicable diseases: practical implications of the UN political declaration. Lancet 2013; published online Feb 12. http://dx.doi.org/10.1016/S0140-6736(12)62128-X. Atun R, Jaffar S, Nishtar S, et al. Improving responsiveness of health systems to non-communicable diseases. Lancet 2013; published online Feb 12. http://dx.doi.org/10.1016/S01406736(13)60063-X. Gakidou E, Nordhagen S, Obermeyer Z. Coverage of cervical cancer screening in 57 countries: low average levels and large inequalities. PLoS Med 2008; 5: e132. Coleman MP, Quaresma M, Berrino F, et al. Cancer survival in five continents: a worldwide population-based study (CONCORD). Lancet Oncol 2008; 9: 730–56. Sankaranarayanan R, Swaminathan R, Brenner H, et al. Cancer survival in Africa, Asia, and Central America: a population-based study. Lancet Oncol 2010; 11: 165–73. Sankaranarayanan R, Black RJ, Swaminathan R, Parkin DM. An overview of cancer survival in developing countries. IARC Sci Publ 1998; 145: 135–73. Kotseva K, Wood D, De Backer G, De Bacquer D, Pyorala K, Keil U. Cardiovascular prevention guidelines in daily practice: a comparison of EUROASPIRE I, II, and III surveys in eight European countries. Lancet 2009; 373: 929–40. Yusuf S, Islam S, Chow CK, et al. Use of secondary prevention drugs for cardiovascular disease in the community in high-income, middle-income, and low-income countries (the PURE Study): a prospective epidemiological survey. Lancet 2011; 378: 1231–43. Mendis S, Abegunde D, Yusuf S, et al. WHO study on prevention of recurrences of myocardial infarction and stroke (WHO-PREMISE). Bull World Health Organ 2005; 83: 820–29. Danaei G, Rimm EB, Oza S, Kulkarni SC, Murray CJ, Ezzati M. The promise of prevention: the effects of four preventable risk factors on national life expectancy and life expectancy disparities by race and county in the United States. PLoS Med 2010; 7: e1000248. Chartier K, Caetano R. Ethnicity and health disparities in alcohol research. Alcohol Res Health 2010; 33: 152–60. Hall G, Patrinos HA. Indigenous peoples, poverty, and human development in Latin America. Basingstoke: Palgrave Macmillan, 2006. Bramley D, Hebert P, Jackson R, Chassin M. Indigenous disparities in disease-specific mortality, a cross-country comparison: New Zealand, Australia, Canada, and the United States. N Z Med J 2004; 117: U1215. UN. State of the world’s indigenous peoples. New York: United Nations, 2009. Webster PC. Canada curbs Aboriginal health leadership. Lancet 2012; 379: 2137. Aboriginal Affairs and Northern Development Canada. May 15, 2010. http://www.aadnc-aandc.gc.ca/eng/1100100035755 (accessed July 2, 2012). United Nations Human Rights. Olivier De Schutter, Special rapporteur on the right to food: visit to Canada from 6 to 16 May 2012—End-of-mission statement http://www.ohchr.org/EN/ NewsEvents/Pages/DisplayNews.aspx?NewsID=12159&LangID=E (accessed July 2, 2012). Kagamimori S, Gaina A, Nasermoaddeli A. Socioeconomic status and health in the Japanese population. Soc Sci Med 2009; 68: 2152–60. Khang YH, Lynch JW, Kaplan GA. Health inequalities in Korea: age- and sex-specific educational differences in the 10 leading causes of death. Int J Epidemiol 2004; 33: 299–308.. 51. 52. 53. 54. 55. 56. 57. 58. 59. 60. 61 62. 63 64 65. 66. 67. 68. 69. 70. 71. 72. Khang YH, Yang S, Cho HJ, Jung-Choi K, Yun SC. Decomposition of socio-economic differences in life expectancy at birth by age and cause of death among 4 million South Korean public servants and their dependents. Int J Epidemiol 2010; 39: 1656–66. Wong MD, Shapiro MF, Boscardin WJ, Ettner SL. Contribution of major diseases to disparities in mortality. N Engl J Med 2002; 347: 1585–92. Law MR, Morris JK. Why is mortality higher in poorer areas and in more northern areas of England and Wales? J Epidemiol Community Health 1998; 52: 344–52. Khang YH, Lynch JW, Jung-Choi K, Cho HJ. Explaining age-specific inequalities in mortality from all causes, cardiovascular disease and ischaemic heart disease among South Korean male public servants: relative and absolute perspectives. Heart 2008; 94: 75–82. Khang YH, Lynch JW, Yang S, et al. The contribution of material, psychosocial, and behavioral factors in explaining educational and occupational mortality inequalities in a nationally representative sample of South Koreans: relative and absolute perspectives. Soc Sci Med 2009; 68: 858–66. Wada K, Kondo N, Gilmour S, et al. Trends in cause specific mortality across occupations in Japanese men of working age during period of economic stagnation, 1980–2005: retrospective cohort study. BMJ 2012; 344: e1191. Fujino Y, Tamakoshi A, Iso H, et al. A nationwide cohort study of educational background and major causes of death among the elderly population in Japan. Prev Med 2005; 40: 444–51. Stevens G, Dias RH, Thomas KJA, et al. Characterizing the epidemiological transition in Mexico: national and subnational burden of diseases, injuries, and risk factors. PLoS Med 2008; 5: e125. Chang CL, Marmot MG, Farley TMM, Poulter NR. The influence of economic development on the association between education and the risk of acute myocardial infarction and stroke. J Clin Epidemiol 2002; 55: 741–47. Pampel FC, Denney JT. Cross-national sources of health inequality: education and tobacco use in the World Health Survey. Demography 2011; 48: 653–74. Hiscock R, Bauld L, Amos A, Fidler JA, Munafo M. Socioeconomic status and smoking: a review. Ann N Y Acad Sci 2012; 1248: 107–23. Pampel FC, Denney JT, Krueger PM. Obesity, SES, and economic development: a test of the reversal hypothesis. Soc Sci Med 2012; 74: 1073–81. Monteiro C, Conde WL, Lu B, Popkin BM. Obesity and inequities in health in the developing world. Int J Obesity 2004; 28: 1181–86. McLaren L. Socioeconomic status and obesity. Epidemiol Rev 2007; 29: 29–48. Kanjilal S, Gregg EW, Cheng YLJ, et al. Socioeconomic status and trends in disparities in 4 major risk factors for cardiovascular disease among US adults, 1971–2002. Arch Intern Med 2006; 166: 2348–55. Osler M, Gerdes LU, Davidsen M, et al. Socioeconomic status and trends in risk factors for cardiovascular diseases in the Danish MONICA population, 1982–1992. J Epidemiol Community Health 2000; 54: 108–13. Bennett S. Cardiovascular risk factors in Australia: trends in socioeconomic inequalities. J Epidemiol Community Health 1995; 49: 363–72. Peltonen M, Huhtasaari F, Stegmayr B, Lundberg V, Asplund K. Secular trends in social patterning of cardiovascular risk factor levels in Sweden. The Northern Sweden MONICA Study 1986–1994. Multinational monitoring of trends and determinants in cardiovascular disease. J Intern Med 1998; 244: 1–9. Bartley M, Fitzpatrick R, Firth D, Marmot M. Social distribution of cardiovascular disease risk factors: change among men in England 1984–1993. J Epidemiol Community Health 2000; 54: 806–14. Galobardes B, Costanza MC, Bernstein MS, Delhumeau C, Morabia A. Trends in risk factors for lifestyle-related diseases by socioeconomic position in Geneva, Switzerland, 1993–2000: health inequalities persist. Am J Public Health (N Y) 2003; 93: 1302–09. Ferrario M, Sega R, Chatenoud L, et al. Time trends of major coronary risk factors in a northern Italian population (1986–1994). How remarkable are socioeconomic differences in an industrialized low CHD incidence country? Int J Epidemiol 2001; 30: 285–97. Bovet P, Chiolero A, Shamlaye C, Paccaud F. Prevalence of overweight in the Seychelles: 15 year trends and association with socio-economic status. Obes Rev 2008; 9: 511–17.. www.thelancet.com Vol 381 February 16, 2013.
(13) Series. 73. 74 75. 76. 77. 78. 79. 80. 81. 82. 83. 84. 85. 86. 87. 88. 89. 90. 91. 92 93. Scholes S, Bajekal M, Love H, et al. Persistent socioeconomic inequalities in cardiovascular risk factors in England over 1994–2008: a time-trend analysis of repeated cross-sectional data. BMC Public Health 2012; 12: 129. Bleich SN, Jarlenski MP, Bell CN, LaVeist TA. Health inequalities: trends, progress, and policy. Ann Rev Public Health 2012; 33: 7–40. Stringhini S, Viswanathan B, Gédéon J, Paccaud F, Bovet P. The social transition of risk factors for cardiovascular disease in the African region: evidence from three cross-sectional surveys in the Seychelles. Int J Cardiol 2012; published online Nov 30. DOI:10.1016/j.ijcard.2012.11.064. Hozawa A, Folsom AR, Sharrett AR, Chambless LE. Absolute and attributable risks of cardiovascular disease incidence in relation to optimal and borderline risk factors: comparison of African American with white subjects—Atherosclerosis Risk in Communities Study. Arch Intern Med 2007; 167: 573–79. Thomas AJ, Eberly LE, Smith GD, Neaton JD, Stamler J, Grp MRFIR. Race/ethnicity, income, major risk factors, and cardiovascular disease mortality. Am J Public Health 2005; 95: 1417–23. Jha P, Peto R, Zatonski W, Boreham J, Jarvis MJ, Lopez AD. Social inequalities in male mortality, and in male mortality from smoking: indirect estimation from national death rates in England and Wales, Poland, and North America. Lancet 2006; 368: 367–70. Smith GD, Neaton JD, Wentworth D, Stamler R, Stamler J, Grp MR. Mortality differences between black and white men in the USA: contribution of income and other risk factors among men screened for the MRFIT. Lancet 1998; 351: 934–39. Kivimaki M, Shipley MJ, Ferrie JE, et al. Best-practice interventions to reduce socioeconomic inequalities of coronary heart disease mortality in UK: a prospective occupational cohort study. Lancet 2008; 372: 1648–54. Lynch J, Davey Smith G, Harper S, Bainbridge K. Explaining the social gradient in coronary heart disease: comparing relative and absolute risk approaches. J Epidemiol Community Health 2006; 60: 436–41. Stringhini S, Sabia S, Shipley M, et al. Association of socioeconomic position with health behaviors and mortality. JAMA 2010; 303: 1159–66. Denney JT, Rogers RG, Hummer RA, Pampel FC. Education inequality in mortality: the age and gender specific mediating effects of cigarette smoking. Soc Sci Res 2010; 39: 662–73. US Department of Health and Human Services. National healthcare disparities report, 2005. Rockville: Agency for Healthcare Research and Quality, 2005. Gornick ME, Eggers PW, Reilly TW, et al. Effects of race and income on mortality and use of services among Medicare beneficiaries. N Engl J Med 1996; 335: 791–99. Kogevinas M, Porta M. Socioeconomic differences in cancer survival: a review of the evidence. IARC Sci Publ 1997; 138: 177–206. Mackillop WJ, Zhang-Salomons J, Groome PA, Paszat L, Holowaty E. Socioeconomic status and cancer survival in Ontario. J Clin Oncol 1997; 15: 1680–89. Brown AF, Ettner SL, Piette J, et al. Socioeconomic position and health among persons with diabetes mellitus: a conceptual framework and review of the literature. Epidemiol Rev 2004; 26: 63–77. Hill S, Sarfati D, Blakely T, et al. Survival disparities in Indigenous and non-Indigenous New Zealanders with colon cancer: the role of patient comorbidity, treatment and health service factors. J Epidemiol Community Health 2010; 64: 117–23. Smedley BD, Stith AY, Nelson AR. Unequal treatment: confronting racial and ethnic disparities in health care. Washington: National Academy Press, 2002. McWilliams JM, Meara E, Zaslavsky AM, Ayanian JZ. Differences in control of cardiovascular disease and diabetes by race, ethnicity, and education: U.S. trends from 1999 to 2006 and effects of medicare coverage. Ann Intern Med 2009; 150: 505–15. American Cancer Society. Cancer facts & figures 2008. Atlanta: American Cancer Society, 2008. Farzadfar F, Murray CJ, Gakidou E, et al. Effectiveness of diabetes and hypertension management by rural primary health-care workers (Behvarz workers) in Iran: a nationally representative observational study. Lancet 2012; 379: 47–54.. www.thelancet.com Vol 381 February 16, 2013. 94. 95. 96. 97. 98. 99. 100. 101. 102. 103. 104. 105. 106. 107. 108 109. 110. 111. 112. 113 114. 115. Jakovljevic D, Sarti C, Sivenius J, et al. Socioeconomic status and ischemic stroke: The FINMONICA Stroke Register. Stroke 2001; 32: 1492–98. Salomaa V, Niemela M, Miettinen H, et al. Relationship of socioeconomic status to the incidence and prehospital, 28-day, and 1-year mortality rates of acute coronary events in the FINMONICA myocardial infarction register study. Circulation 2000; 101: 1913–18. CSDH. Closing the gap in a generation: health equity through action on the social determinants of health. Geneva: World Health Organization, 2008. Marmot M, Allen J, Bell R, Bloomer E, Goldblatt P. WHO European review of social determinants of health and the health divide. Lancet 2012; 380: 1011–29. Mackenbach JP. The persistence of health inequalities in modern welfare states: the explanation of a paradox. Soc Sci Med 2012; 75: 761–69. Regidor E, Ronda E, Pascual C, Martinez D, Calle ME, Dominguez V. Decreasing socioeconomic inequalities and increasing health inequalities in Spain: a case study. Am J Public Health (N Y) 2006; 96: 102–08. Abegunde DO, Stanciole AE. The economic impact of chronic diseases: how do households respond to shocks? Evidence from Russia. Soc Sci Med 2008; 66: 2296–307. Mahal A, Karan A, Engelgau MM. The economic implications of non-communicable diseases for India. Washington: The World Bank, 2010. Ni Mhurchu C, Blakely T, Jiang YN, Eyles HC, Rodgers A. Effects of price discounts and tailored nutrition education on supermarket purchases: a randomized controlled trial. Am J Clin Nutr 2010; 91: 736–47. Blakely T, Mhurchu CN, Jiang YN, et al. Do effects of price discounts and nutrition education on food purchases vary by ethnicity, income and education? Results from a randomised, controlled trial. J Epidemiol Community Health 2011; 65: 902–08. Nnoaham KE, Sacks G, Rayner M, Mytton O, Gray A. Modelling income group differences in the health and economic impacts of targeted food taxes and subsidies. Int J Epidemiol 2009; 38: 1324–33. Thomas S, Fayter D, Misso K, et al. Population tobacco control interventions and their effects on social inequalities in smoking: systematic review. Tob Control 2008; 17: 230–37. Amos A, Bauld L, Clifford D, et al. Tobacco control, inequalities in health and action at a local level. York: Public Health Research Consortium, 2011. Lorenc T, Petticrew M, Welch V, Tugwell P. What types of interventions generate inequalities? Evidence from systematic reviews. J Epidemiol Community Health 2012; published online Aug 8. DOI:10.1136/jech-2012-201257. Jha P, Chaloupka F. Curbing the epidemic: governments and the economics of tobacco control. Washington: World Bank, 1999. IARC Working Group on the Effectiveness of Tax and Price Policies for Tobacco Control, International Agency for Research on Cancer. Effectiveness of tax and price policies for tobacco control. Lyon Cedex: International Agency for Research on Cancer, 2011. Mozaffarian D, Afshin A, Benowitz NL, et al. Population approaches to improve diet, physical activity, and smoking habits: a scientific statement from the American Heart Association. Circulation 2012; 126: 1514–63. Durkin S, Brennan E, Wakefield M. Mass media campaigns to promote smoking cessation among adults: an integrative review. Tob Control 2012; 21: 127–38. Lewin S, Lavis JN, Oxman AD, et al. Supporting the delivery of cost-effective interventions in primary health-care systems in low-income and middle-income countries: an overview of systematic reviews. Lancet 2008; 372: 928–39. Moreno-Serra R, Smith PC. Does progress towards universal health coverage improve population health? Lancet 2012; 380: 917–23. Lagomarsino G, Garabrant A, Adyas A, Muga R, Otoo N. Moving towards universal health coverage: health insurance reforms in nine developing countries in Africa and Asia. Lancet 2012; 380: 933–43. Boerma JT, Stansfield SK. Health statistics now: are we making the right investments? Lancet 2007; 369: 779–86.. 597.
(14)
Figure


+2
Documento similar
In this Thesis we study optimal constants in Hardy inequalities for Schr¨ odinger opera- tors with quadratic singular potentials, and we describe their contribution to the study
The present review discusses the key findings related to the involvement of TLRs and NLRs in the progression of several vascular and cardiac diseases, with a focus on whether some
The government committed to offering US$ 130 million in international development assistance to help LICs tackle NCDs, including cancer, heart diseases, respiratory diseases,
An employee who sleeps 8 hours per night may still have poor sleep quality, preventing the individual from showing up for work at peak performance.. Additionally, sleep hygiene
For a short explanation of why the committee made these recommendations and how they might affect practice, see the rationale and impact section on identifying children and young
The incidence and prevalence of these diseases are increasingly globally, and although more research is needed to elucidate its role in pathologies such as atrial
Even though sarcasm and irony work linguistically in both languages (English and Spanish), sarcasm and irony are key comedic aspects within English- speaking countries due
The analysis showed that invasive dental treatment (largely comprising of tooth extractions and only 4% being non‐surgical and surgical periodontal procedures) is associated with
