R E S E A R C H A R T I C L E
Open Access
Copper-induced increased expression of
genes involved in photosynthesis, carotenoid
synthesis and C assimilation in the marine
alga
Ulva compressa
Felipe E. Rodríguez
1, Daniel Laporte
1*, Alberto González
1, Katterinne N. Mendez
2, Eduardo Castro-Nallar
2,
Claudio Meneses
3,4, Juan Pablo Huidobro-Toro
1,5and Alejandra Moenne
1*Abstract
Background:The marine algaUlva compressais the dominant species in coastal areas receiving effluents from copper mines. The alga can accumulate high amounts of copper and possesses a strong antioxidant system. Here, we performed short-term transcriptomic analyses using total RNA of the alga cultivated with 10μM of copper for 0, 3, 6, 12 and 24 h by RNA-seq.
Results:De novo transcriptomes were assembled using the Trinity software, putative proteins were annotated and
classified using Blast2GO. Differentially expressed transcripts were identified using edgeR. Transcript levels were compared by paired times 0 vs 3, 0 vs 6, 0 vs 12 and 0 vs 24 h at an FDR < 0.01 and Log2 Fold Change > 2. Up-regulated transcripts encode proteins belonging to photosystem II (PSII), Light Harvesting II Complex (LHCII), PSI and LHCI, proteins involved in assembly and repair of PSII, and assembly and protection of PSI. In addition, transcripts encoding enzymes leading toβ-carotene synthesis and enzymes belonging to the Calvin-Benson cycle were also increased. We further analyzed photosynthesis and carotenoid levels in the alga cultivated with 10μM of copper for 0 to 24 h. Photosynthesis was increased from 3 to 24 h as well as the level of total carotenoids. The increase in transcripts encoding enzymes of the Calvin-Benson cycle suggests that C assimilation may also be increased.
Conclusions:Thus,U. compressadisplays a short-term response to copper stress enhancing the expression of genes encoding proteins involved in photosynthesis, enzymes involved carotenoids synthesis, as well as those belonging to the Calvin-Benson cycle, which may result in an increase in C assimilation.
Keywords:Calvin cycle, Carotenoid level, Copper, Marine alga, Photosynthesis,Ulva compressa
Background
Heavy metals such as zinc, iron, copper, and manganese are essential for plant cell viability since they are associ-ated with proteins and enzymes such as superoxide dismutase, plastocyanin, cytochrome c oxidase, amino oxi-dase, polyphenol oxioxi-dase, nitrogenase, and several dehy-drogenases and oxidases [1, 2]. However, excess of essential heavy metals can be toxic to cells since they in-duce oxidative stress leading to oxidation and destruction
of biological macromolecules. On the other hand, some heavy metals and metalloids such as cadmium, lead, mer-cury, arsenic are not required for enzyme activity and they are always toxic for the cells. In particular, copper is re-quired for photosynthetic activity in the chloroplast since it is an essential component of plastocyanin that allows transfer of electrons from cytochrome b6fto photosystem I (PSI) reaction center. Copper is also required by cyto-chrome c oxidase, the final acceptor of electrons of respiratory chain, in the mitochondria and Cu/Zn super-oxide dismutase that converts supersuper-oxide anions into hydrogen peroxide, mainly in the cytosol [3–5].
* Correspondence:daniel.laporte@usach.cl;alejandra.moenne@usach.cl
1Faculty of Chemistry and Biology, University of Santiago of Chile, Av.
Libertador Bernardo O’Higgins, 3363 Santiago, Chile
Full list of author information is available at the end of the article
Regarding copper excess and photosynthesis in plants and green microalgae, it has been shown that copper toxicity is caused by the replacement of magnesium in chlorophyll by copper ions, which does not allow the ef-ficient release of energy from chlorophyll in antenna complexes to reaction centers in Photosystem II (PSII) or directly inhibits the reaction center of PSII [3–5]. For example, the aquatic plant Ceratophyl demersum ex-posed to nanomolar concentrations of copper for 6 weeks showed an optimal growth at 10–30 nM of copper and an optimal activity of PSII at 2 nM of copper [3]. Conversely, C. demersum exposed to 100–200 nM cop-per showed an inhibition of growth, a decrease in leaf size, fragile stems, chlorosis, and an inhibition of photo-chemical activity in PSII [3]. Likewise, rice plants culti-vated with copper concentrations from 30 nM to 98μM for 30 days displayed an inhibition of photosynthesis above 157 nM mostly due to inhibition of PSII and de-crease in ATP synthase activity [6]. In addition, Phaseo-lus vulgaris plants cultivated with 0.5 to 160μM of copper for 24 days showed an inhibition of growth and in photosynthesis efficiency [7]. Thus, it appears that plants do not tolerate copper concentrations higher than 100–200 nM due to an inhibition of photosynthesis.
On the other hand, the concentration of copper in sea-water in central Chile is around 30 nM whereas in sites of Northern Chile that receive effluents from copper mines, the concentration of copper can reach 300 nM [8]. In these copper-polluted sites, the dominant alga species is the green macroalga Ulva compressa, which suggests that this species may tolerate copper excess. In fact, the alga has been cultivated with 10 and 50 μM of copper for 7 days showing no sign of loss in viability; however, at higher concentrations of copper the viability was inhibited [9]. Until now, the effect of increasing cop-per concentrations on photosynthesis has not been ana-lyzed in U. compressa. Regarding other macroalgae species, the brown macroalga Ectocarpus siliculosus cultivated with 1.8μM for 8 h showed an increase in photosynthesis efficiency, whereas it decreased with 3.7μM of copper [10]. In contrast, the red macroalga Gracilaria tenuistipitata cultivated with 16 nM of cop-per showed a decrease in photosynthesis efficiency after 1, 3 and 6 days of metal exposure [11]. The red macro-alga Porphyra haitiensis cultivated with 0.1 to 50μM copper for 3 days showed an increase in photosynthesis when cultivated with 0.1 and 1μM copper and an in-crease in respiration when cultivated with 0.1 to 50μM copper [12]. Furthermore, the green macroalga Ulva flexuosa cultivated with 0.8, 4 and 8μM for 5 days did not show inhibition of photosynthesis [13]. Thus, marine macroalgae appeared to be more tolerant to copper ex-cess than plants since photosynthesis is not inhibited or is increased with micromolar concentrations of copper.
Transcriptomic analyses using RNA-seq and microar-rays in marine algae have revealed some specific re-sponses to metals and other abiotic stresses. A microarray analysis of the brown macroalga E. siliciulo-suscultivated with 1.8μM copper showed the activation of the oxylipin signaling pathway, the repression of the inositol signaling pathway, an increase or inhibition in expression of some transcription factors and an increase in expression of ABC transporters orthologs, P-type ATPases, ROS-detoxifying enzymes and a vanadium-dependent bromoperoxidase [14]. In addition,E. siliculo-sus treated with copper showed a decrease in nitrogen assimilation, as well as an increase in fatty acid content and autophagy processes. Moreover, some of the up-and down-regulated genes inE. siliculosusshowed iden-tity to plant genes but a high number corresponded to yet uncharacterized genes [14]. In addition, a transcrip-tomic analysis performed in Ulva linza exposed to low and high temperature, high light, salt and UV-B showed an increase in expression of photoprotective proteins LhcbSR and PsbS and an increase in expression a car-bonic anhydrase that improves carbon fixation. In addition,U. linza showed an increase in the expression of ammonium, phosphate and sulfate transporters which may improve nutrient uptake and increase in glutamate dehydrogenases, which may improve N fixation. Further-more,U. linzashowed an increase in expression of anti-oxidant enzymes, which may inhibit oxidative stress induced by abiotic stresses [15]. We have previously per-formed transcriptomic analyses in U. compressa culti-vated with 10μM copper for 0 and 24 h and identified seven potential metallothioneins, antioxidant enzymes such as ascorbate peroxidase, glutathione reductase and peroxiredoxin, as well as enzymes involved in glutathi-one and ascorbate synthesis and their levels appeared to be increased in response to copper stress [16].
In this work, we generated de novo transcriptomes and analyzed short-term differential gene expression in U. compressacultivated with 10μM of copper for 0, 3, 6, 12 and 24 h. The level of transcripts encoding proteins related with photosynthesis and enzymes of carotenoid synthesis and the Calvin-Benson cycle were increased compared with the control (0 h). To confirm these find-ings, photosynthesis and the level of carotenoids and chlorophylls were determined in the alga cultivated with 10μM of copper for 0 to 24 h.
Results
U. compressatranscriptomes: Assembly, annotation, and classification of transcripts
in 18.4 M of reads on average (Table 1). Reads were trimmed, and bacterial sequences were eliminated using the Bowtie2 software by aligning the reads to bacterial reference genomes from the NCBI-RefSeq database. After quality control, the control condition presented 10.9 M of reads and the copper-treated samples in 11.9 M on average (Table 1; Additional file 1: Figure S1).
Transcripts were assembled using the Trinity software and resulted in 237,116 transcripts (contigs) of 101 to 9118 nucleotides in length (Additional file1: Figure S1). Transcripts having 200 or less nucleotides in length were removed, which resulted in 106,704 total transcripts hav-ing an average length of 868 bp and correspondhav-ing to 45% of the initial total transcripts (Table1). The 106,704
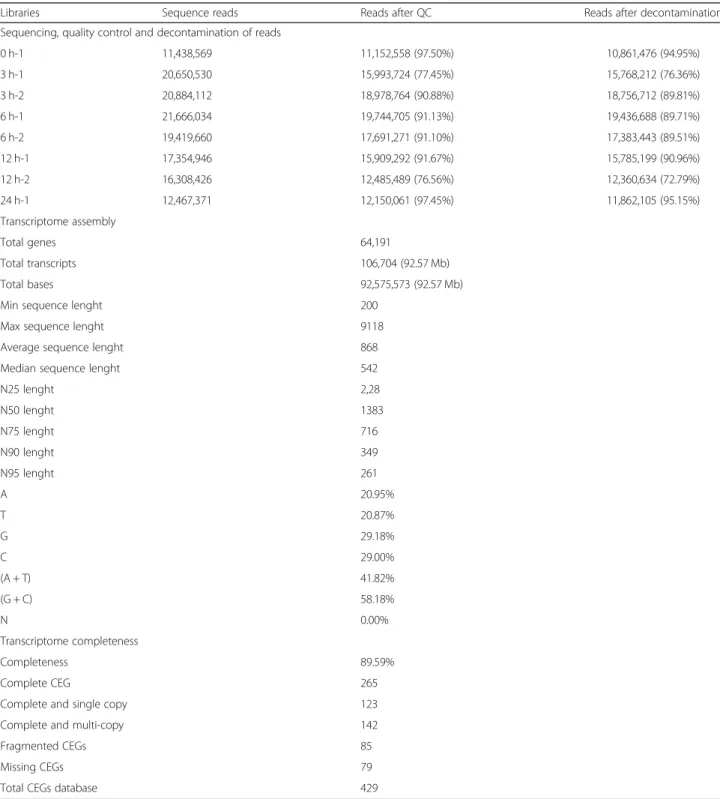
Table 1Sequencing, pre-processing of reads and assembly of theUlva compressatranscriptome
Libraries Sequence reads Reads after QC Reads after decontamination
Sequencing, quality control and decontamination of reads
0 h-1 11,438,569 11,152,558 (97.50%) 10,861,476 (94.95%)
3 h-1 20,650,530 15,993,724 (77.45%) 15,768,212 (76.36%)
3 h-2 20,884,112 18,978,764 (90.88%) 18,756,712 (89.81%)
6 h-1 21,666,034 19,744,705 (91.13%) 19,436,688 (89.71%)
6 h-2 19,419,660 17,691,271 (91.10%) 17,383,443 (89.51%)
12 h-1 17,354,946 15,909,292 (91.67%) 15,785,199 (90.96%)
12 h-2 16,308,426 12,485,489 (76.56%) 12,360,634 (72.79%)
24 h-1 12,467,371 12,150,061 (97.45%) 11,862,105 (95.15%)
Transcriptome assembly
Total genes 64,191
Total transcripts 106,704 (92.57 Mb)
Total bases 92,575,573 (92.57 Mb)
Min sequence lenght 200
Max sequence lenght 9118
Average sequence lenght 868
Median sequence lenght 542
N25 lenght 2,28
N50 lenght 1383
N75 lenght 716
N90 lenght 349
N95 lenght 261
A 20.95%
T 20.87%
G 29.18%
C 29.00%
(A + T) 41.82%
(G + C) 58.18%
N 0.00%
Transcriptome completeness
Completeness 89.59%
Complete CEG 265
Complete and single copy 123
Complete and multi-copy 142
Fragmented CEGs 85
Missing CEGs 79
transcripts represent 64,191 genes with a N50 value of 1383 bp, average GC content of 58.18%, where 81.59% of transcripts were present in Core Eukaryotic Genes data-sets (CEGs and OrthoDB databases) (Table1).
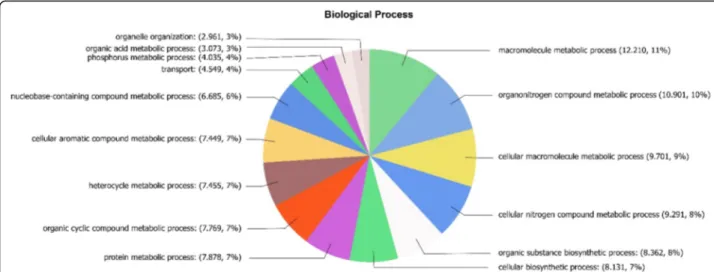
Transcripts were translated into amino acids using BlastX and those having an e-value of 1e−3or less were selected. Transcripts were annotated using UniprotKB database with Blat2GO software and 40,037 protein se-quences were obtained of which 36,094 were selected hav-ing an e-value of 1e−6or lower. These 36,094 proteins are involved in different biological processes corresponding to: 12.210 (11%) associated with macromolecules bolic processes; 10.901 (10%) with organic nitrogen meta-bolic processes; 9.701 (9%) with cellular macromolecule processes; 9.291 (8%) with cellular nitrogen compound metabolic processes; 8.362 (8%) with organic substance biosynthetic processes; 8.131 (7%) with cellular biosyn-thetic processes; 7.878 (7%) with protein metabolic pro-cesses; 7.769 (7%) with organic cyclic metabolic propro-cesses; 7.455 (7%) in heterocycle metabolic processes; 7.499 (7%) with aromatic compound metabolic processes; 6.685 (6%) with nucleobase-containing compound metabolic pro-cesses; 4.549 (4%) with transport; 4.035 (4%) with phos-phorous metabolic processes; 3.073 (3%) with organic acid metabolic processes and 2.961 (3%) with organelle organization processes (Fig.1). Thus, at least 21% of the proteins are involved in secondary metabolism, 4% in transport and 3% in organelle organization. In addition, proteins were classified according to their molecular func-tion and cellular component (Addifunc-tional file2: Figure S2).
Thirty-two thousand and 162 protein sequences were selected using BLAST Top-Hit species and a database of proteins belonging to 29 model species to analyze the similarity to plant, animal, protist, fungal, and prokaryote proteins. Results indicate that 17,140 proteins (53.3%) are
similar to plant proteins; 9570 (29.8%) to animal proteins; 2891 (9%) to fungal proteins; 1772 (5.5%) to protist pro-teins and 789 (2.5%) to prokaryote propro-teins (Fig.2). These results suggest that almost 30% of U. compressaproteins are related to animal proteins corresponding to 11 animal species including human, mouse and rat (Fig.2) and 53% with plant proteins.
Transcripts differentially expressed in response to copper stress
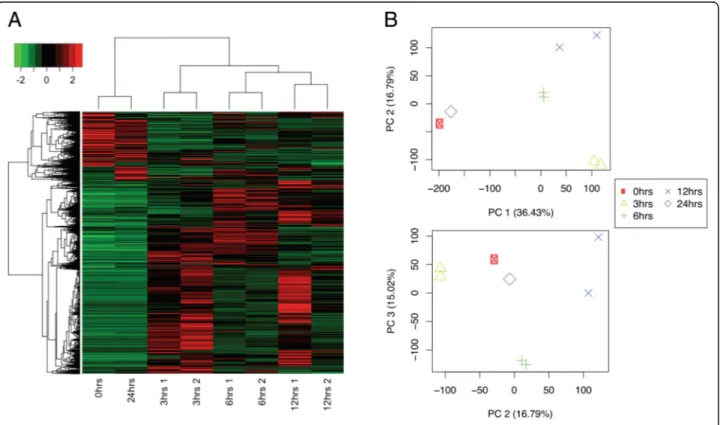
Transcripts were filtered by FDR of 0.01 or lower, and a Log2 Fold Change higher than 2. From 106,704 tran-scripts, only 23,978 were differentially expressed. When clustering samples by their differential expression pro-files, it was observed that samples taken at 0 and 24 h had similar differential expression patterns, while sam-ples at 3, 6, and 12 h showed time-specific profiles. All biological replicates were more similar to each other than to other samples (Fig.3a). This was also true when comparing the expression profiles of all transcripts, not only those differentially expressed (Fig. 3b). This sug-gests that copper has a measurable and specific impact upon gene expression, indicating that those differentially expressed genes might reveal molecular mechanisms by whichU. compressacopes with copper excess.
Transcripts with increased level encode proteins involved in assembly, repair and protection of photosystems
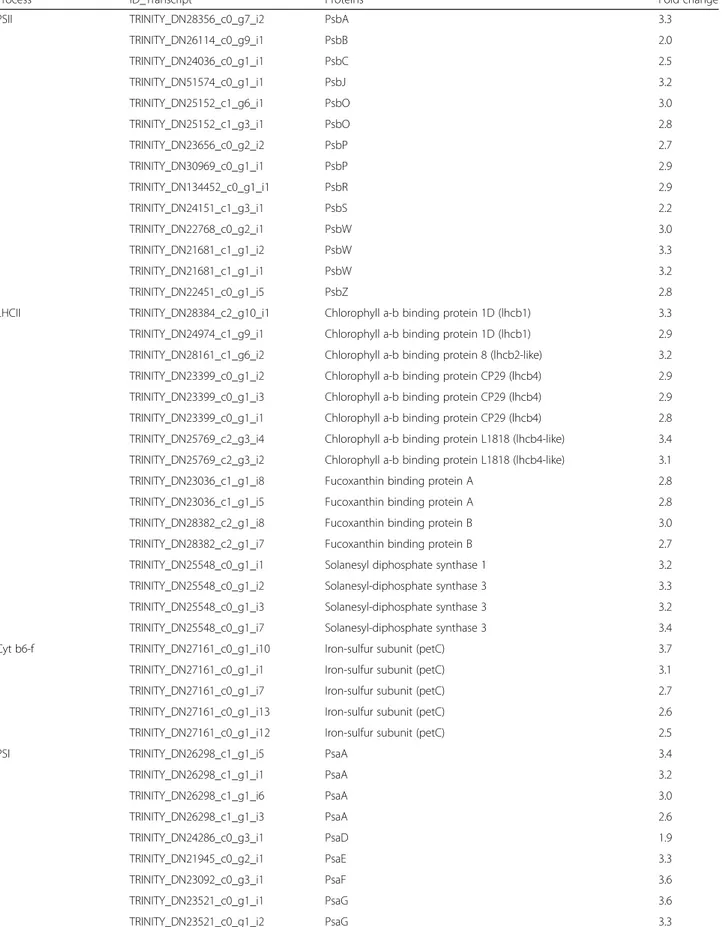
The level of transcripts encoding subunits PsbA, PsbB, PsbC, PsbD, PsbJ, PsbO, PsbP, PsbR, PsbS, PsbW and PsbZ were increased in response to copper stress (Table 2; Fig. 4). In addition, transcripts encoding pro-teins belonging to the Light Harvesting Complex II (LHCII) involved in chlorophyll a/b-binding correspond-ing to Lhcb1, Lhb2 and Lhb4, present in plants, and
those encoding proteins involved in fucoxanthin and chlorophyll a/c binding corresponding to LhcbA and LhcB, present in diatoms, were also up-regulated (Table2; Fig.4). Moreover, transcripts encoding enzymes solanesyl diphosphate synthase, involved in the synthesis
of the terpene tail of plastoquinone as well as iron-sulfur subunit of cytochrome b6f complex (PetC) were increased (Table 2; Fig.4). Furthermore, transcripts encoding pro-teins of PSI, PsaA, PsaD, PsaE, PsaF, PsaG, psaK and PsaO, as well as ferredoxin-NADP reductase (PetH) and Fig. 2Pie chart of percentage of protein sequences associated with different classes of organisms obtained from the transcriptomic analyses performed in the marine algaUlva compressacultivated with 10μM copper for 0, 3, 6, 12 and 24 h
Table 2Up-regulated genes related to photosynthesis
Process ID_Transcript Proteins Fold change
PSII TRINITY_DN28356_c0_g7_i2 PsbA 3.3
TRINITY_DN26114_c0_g9_i1 PsbB 2.0
TRINITY_DN24036_c0_g1_i1 PsbC 2.5
TRINITY_DN51574_c0_g1_i1 PsbJ 3.2
TRINITY_DN25152_c1_g6_i1 PsbO 3.0
TRINITY_DN25152_c1_g3_i1 PsbO 2.8
TRINITY_DN23656_c0_g2_i2 PsbP 2.7
TRINITY_DN30969_c0_g1_i1 PsbP 2.9
TRINITY_DN134452_c0_g1_i1 PsbR 2.9
TRINITY_DN24151_c1_g3_i1 PsbS 2.2
TRINITY_DN22768_c0_g2_i1 PsbW 3.0
TRINITY_DN21681_c1_g1_i2 PsbW 3.3
TRINITY_DN21681_c1_g1_i1 PsbW 3.2
TRINITY_DN22451_c0_g1_i5 PsbZ 2.8
LHCII TRINITY_DN28384_c2_g10_i1 Chlorophyll a-b binding protein 1D (lhcb1) 3.3
TRINITY_DN24974_c1_g9_i1 Chlorophyll a-b binding protein 1D (lhcb1) 2.9
TRINITY_DN28161_c1_g6_i2 Chlorophyll a-b binding protein 8 (lhcb2-like) 3.2
TRINITY_DN23399_c0_g1_i2 Chlorophyll a-b binding protein CP29 (lhcb4) 2.9
TRINITY_DN23399_c0_g1_i3 Chlorophyll a-b binding protein CP29 (lhcb4) 2.9
TRINITY_DN23399_c0_g1_i1 Chlorophyll a-b binding protein CP29 (lhcb4) 2.8
TRINITY_DN25769_c2_g3_i4 Chlorophyll a-b binding protein L1818 (lhcb4-like) 3.4
TRINITY_DN25769_c2_g3_i2 Chlorophyll a-b binding protein L1818 (lhcb4-like) 3.1
TRINITY_DN23036_c1_g1_i8 Fucoxanthin binding protein A 2.8
TRINITY_DN23036_c1_g1_i5 Fucoxanthin binding protein A 2.8
TRINITY_DN28382_c2_g1_i8 Fucoxanthin binding protein B 3.0
TRINITY_DN28382_c2_g1_i7 Fucoxanthin binding protein B 2.7
TRINITY_DN25548_c0_g1_i1 Solanesyl diphosphate synthase 1 3.2
TRINITY_DN25548_c0_g1_i2 Solanesyl-diphosphate synthase 3 3.3
TRINITY_DN25548_c0_g1_i3 Solanesyl-diphosphate synthase 3 3.2
TRINITY_DN25548_c0_g1_i7 Solanesyl-diphosphate synthase 3 3.4
Cyt b6-f TRINITY_DN27161_c0_g1_i10 Iron-sulfur subunit (petC) 3.7
TRINITY_DN27161_c0_g1_i1 Iron-sulfur subunit (petC) 3.1
TRINITY_DN27161_c0_g1_i7 Iron-sulfur subunit (petC) 2.7
TRINITY_DN27161_c0_g1_i13 Iron-sulfur subunit (petC) 2.6
TRINITY_DN27161_c0_g1_i12 Iron-sulfur subunit (petC) 2.5
PSI TRINITY_DN26298_c1_g1_i5 PsaA 3.4
TRINITY_DN26298_c1_g1_i1 PsaA 3.2
TRINITY_DN26298_c1_g1_i6 PsaA 3.0
TRINITY_DN26298_c1_g1_i3 PsaA 2.6
TRINITY_DN24286_c0_g3_i1 PsaD 1.9
TRINITY_DN21945_c0_g2_i1 PsaE 3.3
TRINITY_DN23092_c0_g3_i1 PsaF 3.6
TRINITY_DN23521_c0_g1_i1 PsaG 3.6
Table 2Up-regulated genes related to photosynthesis(Continued)
Process ID_Transcript Proteins Fold change
TRINITY_DN25932_c0_g1_i3 PsaK 3.6
TRINITY_DN21897_c0_g2_i1 PsaO 3.4
TRINITY_DN26200_c0_g3_i1 Ferredoxin-NADP reductase (petH) 2.9
TRINITY_DN24658_c0_g1_i1 Ferredoxin-2 (petF) 2.8
LHCI TRINITY_DN24974_c1_g7_i2 Chlorophyll a-b binding protein 1 2.8
TRINITY_DN28384_c2_g5_i2 Chlorophyll a-b binding protein 1 3.3
TRINITY_DN28268_c0_g2_i6 Chlorophyll a-b binding protein 1 3.2
TRINITY_DN28268_c0_g2_i9 Chlorophyll a-b binding protein 1 3.0
TRINITY_DN28268_c0_g2_i7 Chlorophyll a-b binding protein 1 2.9
TRINITY_DN28384_c2_g17_i1 Chlorophyll a-b binding protein 1 2.8
TRINITY_DN26721_c1_g6_i1 Chlorophyll a-b binding protein 1B-21 (lhca1) 3.2
TRINITY_DN26721_c1_g6_i2 Chlorophyll a-b binding protein 1B-21 (lhca1) 3.5
TRINITY_DN27296_c2_g4_i2 Chlorophyll a-b binding protein 5 (lhca1-like) 2.6
TRINITY_DN28268_c0_g2_i3 Chlorophyll a-b binding protein 5 (lhca1-like) 2.5
TRINITY_DN25309_c0_g1_i2 Chlorophyll a-b binding protein 5 (lhca1-like) 2.5
TRINITY_DN27296_c2_g1_i11 Chlorophyll a-b binding protein 5 (lhca1-like) 2.2
TRINITY_DN25604_c0_g1_i1 Chlorophyll a-b binding protein 5 (lhca1-like) 2.6
TRINITY_DN25604_c0_g1_i4 Chlorophyll a-b binding protein 5 (lhca1-like) 3.4
TRINITY_DN28161_c1_g6_i3 Chlorophyll a-b binding protein 8 (lhca1-like) 2.1
TRINITY_DN28161_c1_g6_i4 Chlorophyll a-b binding protein 8 (lhca1-like) 2.0
ATP synthase TRINITY_DN23229_c0_g3_i1 ATP synthase subunit b’ 3.4
TRINITY_DN24803_c0_g1_i1 ATP synthase gamma chain 1.4
Repair of PSII TRINITY_DN26385_c1_g4_i3 MET1 3.5
TRINITY_DN25782_c0_g1_i2 MET1 3.4
TRINITY_DN26385_c1_g4_i2 MET1 3.3
TRINITY_DN27340_c1_g3_i2 Deg/HtrA protease Do-like 1 3.3
TRINITY_DN26676_c1_g1_i1 Deg/HtrA protease Do-like 1 3.3
TRINITY_DN27340_c1_g3_i3 Deg/HtrA protease Do-like 1 3.2
TRINITY_DN26676_c1_g1_i12 Deg/HtrA protease Do-like 1 3.2
TRINITY_DN27340_c1_g3_i4 Deg/HtrA protease Do-like 1 3.2
TRINITY_DN27340_c1_g3_i1 Deg/HtrA protease Do-like 1 3.1
TRINITY_DN25574_c0_g1_i4 Deg/HtrA protease Do-like 2 2.9
TRINITY_DN25574_c0_g1_i7 Deg/HtrA protease Do-like 2 2.7
TRINITY_DN18665_c0_g1_i1 Deg/HtrA protease Do-like 5 3.0
TRINITY_DN28204_c1_g1_i2 Deg/HtrA protease Do-like 8 2.7
TRINITY_DN25743_c0_g2_i1 EGY1 3.2
TRINITY_DN25743_c0_g2_i2 EGY1 3.0
TRINITY_DN25743_c0_g2_i3 EGY1 2.9
TRINITY_DN23341_c0_g1_i1 ATP-dependent zinc metalloprotease FTSH 1 3.2
TRINITY_DN27493_c2_g1_i7 ATP-dependent zinc metalloprotease FTSH 2 3.1
TRINITY_DN27493_c2_g1_i1 ATP-dependent zinc metalloprotease FTSH 2 3.1
TRINITY_DN27493_c2_g1_i11 ATP-dependent zinc metalloprotease FTSH 2 3.1
TRINITY_DN28584_c2_g1_i4 ATP-dependent zinc metalloprotease FTSH 5 3.3
ferredoxin (PetF) were increased (Table 2; Fig. 4). In addition, transcripts encoding proteins belonging to the Light Harvesting Complex I (LHCI) corresponding to Lhca1, Lhca5 and Lhca8 were also increased in response to copper excess (Table2; Fig.4). Finally, transcripts en-coding subunit b’and gamma subunits of ATP synthase complex were also increased (Table2; Fig.4).
Transcripts encoding proteins involved in repair of PSII were also up-regulated such as MET1, involved dis-assemble and redis-assemble of PSII to remove damaged PsbA (D1). In addition, the serine proteases Deg/HtrA (Do)-like proteases 1, 2, 5 and 8, the metalloprotease EGY1 and the ATP-dependent proteases FTSH 1, 2, 5 and 8 involved in the degradation of damaged PsbA, and other oxidized subunits of PSII, were also up-regulated (Table 2). Moreover, transcripts encoding proteins in-volved in chloroplast repair such as Thylakoid
Formation 1 (THF1), involved in the formation of the supramolecular complex among PSII and LHCII, Embryo Sac Development Arrests 3 (ESD3), involved in thylakoid formation, and the enzyme palmitoyl-monogalactosyl diacylglycerol delta 7-desaturase in-volved in the synthesis of chloroplast fatty acids were also increased (Table 2). On the other hand, transcripts encoding proteins involved in assembly and stabilization of PSI such as Ycf-4 and Ycf-3-interacting protein that cooperate with Ycf3 in the assembly of PSI were en-hanced. In addition, the potassium antiporter KEA1, re-quired for PSI formation, UPF0187, involved in the stabilization of PSI, TAB2, involved in translation of PsaB, the kinase STN7, involved in phosphorylation of the LHCII that allows its migration of subunits of PSII to PSI, and the phosphatase PPH1 (2C57), involved in the dephosphorylation of LHCII that increase the
Table 2Up-regulated genes related to photosynthesis(Continued)
Process ID_Transcript Proteins Fold change
TRINITY_DN27493_c2_g4_i3 ATP-dependent zinc metalloprotease FTSH 8 2.9
TRINITY_DN24421_c0_g1_i1 THYLAKOID FORMATION 1 3.2
TRINITY_DN22196_c0_g2_i1 EMBRYO SAC DEVELOPMENT ARREST 3 2.9
TRINITY_DN25705_c1_g2_i2 Palmitoyl-monogalactosyldiacylglycerol delta-7 desaturase 2.6
Assembly of PSII TRINITY_DN23616_c0_g1_i4 YCF4 3.3
TRINITY_DN23616_c0_g1_i2 YCF4 2.1
TRINITY_DN22135_c0_g2_i3 Ycf3 interacting Protein 2.9
TRINITY_DN27520_c0_g2_i3 KEA1 2.7
TRINITY_DN24215_c0_g1_i3 UPF0187 protein 2.7
TRINITY_DN25274_c0_g1_i1 TAB2 homolog 3.2
TRINITY_DN25675_c1_g3_i1 Serine/threonine-protein kinase STN7 2.7
TRINITY_DN25616_c0_g2_i1 PPH1 2C 57 3.1
TRINITY_DN28540_c1_g8_i2 PGR5 1A 3.5
TRINITY_DN28540_c1_g2_i2 PGR5 1A 3.1
TRINITY_DN27605_c0_g1_i2 PGR5 1A 2.9
TRINITY_DN26853_c0_g1_i1 PGR5 1B 3.3
TRINITY_DN20751_c0_g2_i1 PGR5 3.3
migration of Lhcb1 and Lhcb2 subunits to PSI, were also increased. Furthermore, PGR1 and PGR5, two proteins involved in the control of the cyclic electron flow around PSI and protecting PSI against photo-oxidation were also up-regulated (Table2).
Transcripts with increased levels encode enzymes involved in carotenoid synthesis and the Calvin-Benson cycle
The level of transcripts encoding the enzymes geranylgera-nyl diphosphate synthase (GGDS), an enzyme that synthesize geranylgeranyl pyrophosphate; phytoene syn-thase (PS), that synthesize phytoene; phytoene desaturase (PD), that synthesizeϛ-carotene; carotene desaturase (CD), that synthesize lycopene, and lycopeneβ-cyclase (LC), that synthesize β-carotene were increased (Table 3). In addition, the level of transcripts encoding enzymes of the Calvin-Benson cycle such as the small subunit (RbcS) of ribulose 1,5 biphosphate carboxylase/oxygenase (rubisco), ribulose phosphate 3 epimerase (RP3E), transketolase (TK), glyceraldehyde 3 phosphate dehydrogenase (G3PDH), fruc-tose 1,6 biphosphatase (FBP), sedoheptulose 1,7 biphospha-tase (SHBP), phosphoribulokinase (PRK), phosphoglycerate kinase (PGK) and ribose 5-phophate isomerase (R5PI) were also up-regulated (Table3).
Kinetics of the increase of transcripts encoding proteins of photosystems, and enzymes of carotenoid synthesis and Calvin-Benson cycle
The levels of transcripts encoding the subunits of PSII showing the higher increases were those encoding the core subunit PsbA (D1) that increased with a maximal level at 6 h of copper exposure and slowly decreased until 24 h of exposure and the subunit PsbW, a small subunit of 6.1 kDa closely associated with PSII reaction center, that showed maximal increases at 3 and 12 h of copper exposure (Fig.5a). In the case of transcripts related to PSI, the higher increases were those encoding PGR5-1A that stimulate electron transfer from ferredoxin to plastoquinone and control the electron flow around PSI, and their level in-creased at 6 h and dein-creased until 24 h (Fig.5b). Regarding carotenoids synthesis, transcripts encoding GGDS, PS, PD, CD and LC showed an increase at 3 h of copper exposure and a subsequent increase at 12 of exposure (Fig. 5c). Regarding enzymes of the Calvin-Benson cycle, transcripts encoding G3PDH increased at 3 h of copper exposure, de-creased and then inde-creased again at 24 h, and those encod-ing RP3E, PRK, TK and the small chain of rubisco increased at 3 h of exposure and decrease and remained until 6 h and remained stable until 24 h (Fig.5d).
Copper-induced increase in photosynthesis and carotenoid levels
The increase in transcripts encoding subunits of PSII and PSI as well as repair proteins of PSII and assembly and
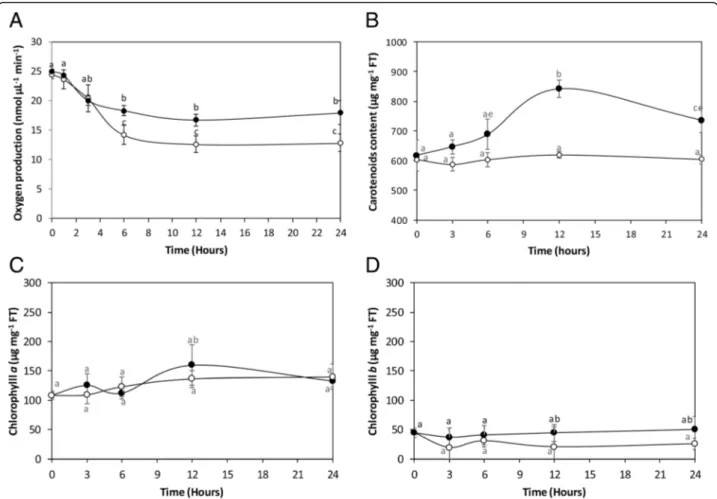
protection of PSI suggests that photosynthesis may be in-creased in U. compressa exposed to copper excess until 24 h. In fact, the alga cultivated in control conditions dis-played an oxygen production of 25 nmoles μL−1min−1 that decreased reaching a level of 14.2 nmolesμL−1min−1 at 6 h of exposure and continued to decrease until 24 h reaching a level of 12.8 nmoles μL−1min−1 at 24 h (Fig. 6a). In contrast, the alga exposed to 10μM copper showed an initial decrease in oxygen production, but it level remained higher than in control conditions reach-ing a level of 18.3 nmoles μL−1min−1at 6 h of expos-ure and 17.9 nmoles μL−1min−1 at 24 h, which represents an increase of 1.4 times compared to the control at 24 h (Fig.6a).
The level of carotenoids in the alga cultivated in control conditions was 618μg mg−1 of FT, which remained un-changed until 24 h (Fig.6b). In the alga treated with cop-per, the level of carotenoids increased reaching a level of 841μg mg−1of FT at 6 h of exposure and decreased until at 24 of exposure reaching a level of 735μg mg−1of FT which represents an increase 1.2 times compared to the control at 24 h (Fig. 6b). In addition, the level of chloro-phylls aand b (Fig.6c-d) did not change in the alga ex-posed to copper excess compare to the control condition. The level of chlorophyll a was 108μg mg−1in control and treated samples at time 0 and it was 139μg mg−1at 24 h of exposure (Fig.6c). The level of chlorophyll b was 45μg mg−1at time 0 in control and treated samples; this level was 26μg mg−1 in control samples and 50μg mg−1 in treated samples at 24 h of exposure but these levels were not significantly different (Fig.6d). Thus, copper stress in-duced an increase in photosynthesis and in the level of ca-rotenoids in U. compressa that is regulated, at least in part, at transcriptional level.
Discussion
cultivated 8μM for 5 days that did not showed inhibition of photosynthesis efficiency [13]. Thus, it appeared that red, brown and green marine macroalgae are able to tol-erate micromolar concentrations of copper by protecting photosynthesis, but the level of tolerance to copper ex-cess depends on the algal species.
In addition, the increase in photosynthesis observed in U. compressaagrees with the increase in the level of ca-rotenoids located in LHCII and LHCI. It is important to mention that increased transcripts encode all the
enzymes required for the synthesisβ-carotene from iso-pentenyl diphosphate. It is important to mention that carotenoids are involved in the protection of photosyn-thetic apparatus by quenching directly chlorophyll triplet states, thus, inhibiting singlet oxygen formation. In con-trast to the increase in carotenoids, no changes in the level of chlorophylls a and b were observed in U. com-pressaexposed to copper stress. On the other hand, the increase in photosynthesis may increase NADPH levels which may enhance the activities of enzymes belonging Table 3Up-regulated genes related to Calvin-Benson cycle
Process ID_Transcript Proteins Fold change
Calvin-Benson cycle TRINITY_DN26739_c1_g1_i11 Ribulose bisphosphate carboxylase small chain 1 3.5
TRINITY_DN26739_c1_g1_i6 Ribulose bisphosphate carboxylase small chain 1 3.4
TRINITY_DN26739_c1_g1_i10 Ribulose bisphosphate carboxylase small chain 1 3.2
TRINITY_DN26739_c1_g1_i1 Ribulose bisphosphate carboxylase small chain 1 3.0
TRINITY_DN26739_c1_g1_i8 Ribulose bisphosphate carboxylase small chain 1 3.1
TRINITY_DN24974_c1_g8_i2 Ribulose-phosphate 3-epimerase 3.2
TRINITY_DN24974_c1_g8_i1 Ribulose-phosphate 3-epimerase 3.1
TRINITY_DN24974_c1_g5_i2 Ribulose-phosphate 3-epimerase 3.0
TRINITY_DN24974_c1_g5_i1 Ribulose-phosphate 3-epimerase 2.9
TRINITY_DN26523_c0_g6_i1 Transketolase-2 3.4
TRINITY_DN26523_c0_g5_i1 Transketolase 2.3
TRINITY_DN26020_c1_g2_i2 Glyceraldehyde-3-phosphate dehydrogenase 3.2
TRINITY_DN28111_c0_g1_i3 Glyceraldehyde-3-phosphate dehydrogenase 3.2
TRINITY_DN28111_c0_g6_i2 Glyceraldehyde-3-phosphate dehydrogenase 3.1
TRINITY_DN25377_c1_g4_i1 Glyceraldehyde-3-phosphate dehydrogenase 3.0
TRINITY_DN28111_c0_g1_i5 Glyceraldehyde-3-phosphate dehydrogenase 2.7
TRINITY_DN25377_c0_g1_i1 Glyceraldehyde-3-phosphate dehydrogenase 2.7
TRINITY_DN25438_c0_g3_i2 Fructose-1,6-bisphosphatase 3.2
TRINITY_DN25438_c0_g2_i2 Fructose-1,6-bisphosphatase 3.2
TRINITY_DN25438_c0_g2_i1 Fructose-1,6-bisphosphatase 3.1
TRINITY_DN25498_c1_g1_i1 Seudoheptulose-1,7-bisphosphatase 3.2
TRINITY_DN25498_c1_g2_i2 Seudoheptulose-1,7-bisphosphatase 3.0
TRINITY_DN28545_c0_g3_i2 Phosphoribulokinase 3.0
TRINITY_DN24724_c0_g2_i4 Phosphoribulokinase 2.7
TRINITY_DN20744_c0_g1_i2 Phosphoglycerate kinase 2.9
TRINITY_DN19258_c0_g2_i1 Pyruvate phosphate dikinase 2.9
TRINITY_DN134423_c0_g1_i1 Pyruvate phosphate dikinase 2.9
TRINITY_DN28070_c1_g1_i2 Ribose-5-phosphate isomerase 3 3.1
TRINITY_DN25979_c1_g4_i1 BC1 complex kinase 1 3.1
TRINITY_DN25979_c1_g4_i2 BC1 complex kinase 1 3.1
TRINITY_DN24548_c0_g4_i1 Geranylgeranyl diphosphate synthase 2.9
TRINITY_DN25865_c0_g2_i3 Phytoene synthase 3.1
TRINITY_DN23375_c0_g1_i3 15-cis-phytoene desaturase 3.0
TRINITY_DN25489_c0_g1_i1 Zeta-carotene desaturase 3.3
to the Calvin cycle leading to an increase in C assimila-tion. In addition, it was observed that at least 21% of transcripts are involved in secondary metabolism sug-gesting that the increase in C assimilation may be chan-neled to the synthesis of secondary metabolites such as phenolic compounds and terpenes. In addition, it is pos-sible that N assimilation may also be increased in the alga cultivated with copper since N is required to repair damaged proteins or compounds that contain N, but this assumption will be analyzed in the future.
Another interesting aspect deduced from the transcrip-tomic analyses is that almost 30% of the transcripts en-code proteins having similarity to animal proteins corresponding to 11 model species that includes human, mouse and rat. In this sense, it has been shown in previ-ous works that lipoxygenase inU. compressauses arachi-donic acid as substrate, as in animals, instead of linolenic or linoleic acids, as in plants [9]. In addition,U. compressa possess functional Transient Receptor Potential (TRP) channels that are normally present in vertebrate and in-vertebrates, but not in plants [16–18]. Moreover, U.
compressaexhibits functional Voltage-Dependent Calcium Channels (VDCCs) that allow extracellular calcium entry leading to intracellular calcium release, as animal cells [19]. Furthermore, the release of calcium from endoplas-mic reticulum (ER) occurs via NAADP-, IP3- and ryanodine-dependent channels in U. compressa exposed to copper excess [20] and NAADP- and ryanodine-dependent channels are not present in plants. In this sense, we have previously postulated that the marine macroalgaU. compressamay contain an ancestral pool of genes and that part of these genes were lost in the animal lineage and another part was lost in photosynthetic organ-isms during evolution [16–18].
encoding L1818 (Lhc4-like protein) appeared to be en-hanced [10]. In contrast,E. siliculosusshowed an increase in transcripts of genes encoding enzymes of the oxylipin signaling pathway, a decrease in transcripts of the inositol signaling pathway and a modulation in the level of tran-scripts encoding some transcription factors in response to copper stress [10]. In addition, E. siliculosus exposed to copper displayed an increase in the level of transcripts en-coding ABC transporters orthologs, P-type ATPases, ROS-detoxifying enzymes and a vanadium-dependent bromoperoxidase [10]. On the other hand, the green macroalgaU. linzaexposed to low and high temperature, high light, salt and UV-B, but not to copper stress, showed an increase in expression of photoprotective proteins LhcbSR and PsbS and an increase in expression a carbonic anhydrase, that improves carbon fixation. Moreover. U. linza exposed to abiotic stresses displayed an increase in the level of transcripts encoding glutamate dehydroge-nases, that improves N fixation, and in the level of tran-scripts coding for antioxidant enzymes, that inhibits oxidative stress [15]. Thus, this is the first case of a marine
macroalga showing a clear increase expression of LCH and PS subunits as well as in expression of enzymes in-volved in C assimilation and carotenoid synthesis in re-sponse to copper stress.
Conclusions
Here, we showed that the marine algaU. compressa posed to copper stress exhibits a short-term gene ex-pression response by enhancing the transcription of genes encoding proteins involved in assembly, repair and protection of PSII and PSI, and enzymes involved in carotenoid synthesis which is reflected in an increase in photosynthesis and carotenoid level. In addition, tran-scripts encoding enzymes from the Calvin-Benson cycle were also increased which may reflect an enhanced C assimilation.
Methods
Alga and seawater sampling
transported to the laboratory in plastic bags at 4 °C in-side a cooler. Algae were rinsed three times with filtered seawater obtained in Quintay (33° 12’S), a pristine site, cleaned manually and sonicated for 3 min in an ultra-sound bath (Branson 3200, Danbury, CT, USA) in order to aid removing epiphytic bacteria and organic debris.
In vitro cultures
U. compressa (100 mg of fresh tissue) was cultivated in seawater with no nutrients addition without copper (control, 0 h) or with 10 μM of CuCl2 for 3, 6, 12 and 24 h under an irradiance of 50 μmoles m-2s−1 on a photoperiod of 14 h light: 10 h dark, at 14 °C. All sam-ples were performed in duplicate except 0 and 24 h that were unique sample. All samples were washed with 2 mL of 100 mM Tris-10 mM EDTA pH 7.0, twice for 10 min, in order to eliminate copper ions bound to the cell wall. Samples were dried with paper, frozen in liquid ni-trogen and stored at−80 °C.
RNA extraction, preparation of cDNA libraries, and sequencing
Total RNA at 0, 3, 6, 12 and 24 h samples was isolated using EZNA total RNA Kit I (Omega Biotek, GA, USA). U. compressa (100 mg of each sample) was frozen in li-quid nitrogen and homogenized in 1 mL of TRK buffer with 20 uL 2-mercaptoethanol. The samples were centri-fuged, the supernatant recovered, mixed with ethanol 70% and transfered to HiBind RNA mini column and washed with RNA Wash Buffer I and II. Finally, total RNA was eluted with 50μL DEPC water. RNA samples were cleaned with GeneJet RNA Cleanup and Concen-tration Micro Kit (Thermo, MS, USA). Total RNA integ-rity was evaluated using a Fragment Analyzer and the software PROsize (Advanced Analytical, Iowa, USA). RNA samples were sended to BGI genomic center (Shenzhen, China), paired end cDNA libraries were pre-pared and sequenced using a Hi-Seq Illumina 4000.
De novo assembly and annotation
Reads obtained by RNA-seq were trimmed using Prinseq (version 0.20.4; −min_len 50 -min_qual_mean 20 -ns_max_n 1 -derep 14 -derep_min 9 -lc_method dust -lc_threshold 49 -trim_left 10 -trim_qual_right) and the quality controlled reads were visualized in Fastqc [21]. De novo transcriptomes were assembled using all the samples in Trinity (−-min_contig_length 200) [22]. Se-quences were blasted using BlastX software and Uni-protKB/Swiss-Prot database, filtering hits with an e-value cutoff of 1 e−3. Annotated sequences were classi-fied according to their Gene Ontology using Blast2GO software [23] and those having an e-value of 1e−6were selected. Sequences were classified according to GO do-main (biological process, molecular function and cellular component) using Blast2GO online search.
Detection of differentially expressed transcripts
Quality controlled reads were mapped against the de novo transcriptome using Bowtie2 (version 2.2.9; default settings). Raw reads were counted using eXpress (version 1.5.1; default settings) and were then normal-ized to CPM units using Trinity’s script abundance_esti-mates_to_matrix.pl under default settings [24]. Differentially expressed transcripts were identified as im-plemented in EdgeR (3.20.2) at an FDR < 0.01 and Log2 Fold Change > 2, with Trinity’s script run_DE_a-nalysis_from_samples_file.pl [25]. Differentially expressed transcripts were obtained by contrasting sample time points: 0 vs. 3; 0 vs. 6; 0 vs.12; 0 vs. 24 h. Differen-tially expressed transcripts were visualized as a heat-map by estimating Spearman’s correlation coefficient on transcripts and samples, and hierarchical clustering (average).
Kinetics of transcripts encoding proteins of photosystems, and enzymes of carotenoid synthesis and Calvin-Benson cycle
Transcripts encoding proteins of photosystems, and enzymes of carotenoid synthesis and Calvin-Benson cycle were selected based on the annotation and GO domain (biological process). Reads of selected tran-scripts were normalized using Trimmed Mean of M-value (TMM) normalization method [26] they were analyzed by Multiple Experiment Viewer (MeV 4.8.1 version) software [27], groups of transcripts showing similar temporal expression pattern were created and overexpressed transcripts were selected from these groups.
Detection of photosynthesis
U. compressa(25 mg of fresh tissue) was incubated in 2 mL of filtered seawater in the oxygraph chamber (Han-satech, model Oxygraph Plus, Norfolk, UK) and O2 pro-duction was measured for 10 min using a light intensity of 425μmoles m−2s−1.
Quantification of carotenoids
Quantification of chlorophylls
The level of chlorophylls was determined as described in [29]. U. compressa(100 mg of FT) was frozen in liquid nitrogen and homogenized with 2 mL 80% acetone. The mixture was centrifuged at 3000 rpm for 10 min at 4 °C, the supernatant was recovered and diluted 10 times with 80% acetone. The absorbance was determined at 649 and 663 nm. The level of chlorophyllsaandbwas calcu-lated according to the formula:
Chlorophylla μg mL−1¼12:7A663nm−2:69A 645nm
Chlorophyllb μg mL−1¼22:9A645nm−4:68A 663nm
Statistical analyses
Significant differences in oxygen production and carot-enoid levels were calculated with one-way ANOVA at 95% confidence interval, followed by a Tukey’s multiple comparison post-test using the statistical software Prism 6 (GraphPad Software Inc., California, USA). Analyses were conducted as three independent replicates.
Additional files
Additional file 1:Figure S1.Preprocessing of reads and transcriptome length distribution. (a) Percentage of preprocessed reads starting from total sequenced reads (X axis) per library (Y axis).“Filtered”shows the percentage of reads filtered out by the quality control (QC) process.
“Bacteria”shows the percentage of bacterial reads (mapped against RefSeq’s bacteria database).“U. compressa”shows quality-controlled and decontaminated reads, which we used for downstream analysis. (b) Histogram showing the length distribution (bp; X axis) of the assembled transcripts (contigs; Y axis) of theUlva compressatranscriptome. We assembled a total of 106,704 transcripts with an average length of 868 bp. (TIF 917 kb)
Additional file 2:Figure S2.Pie chart of the percentage of protein sequences associated with different molecular functions (a) and cellular component (b) obtained from the transcriptomic analyses performed in the marine algaU. compressacultivated with 10μM of copper for 0, 3, 6, 12 and 24 h. (TIF 2198 kb)
Abbreviations
CD:Carotene desaturase; DT: Dry tissue; ER: Endoplasmic reticulum; FBP: Fructose 1,6 biphosphatase; FT: Fresh tissue; G3PDH: Glyceraldehyde 3 phosphate dehydrogenase; GGDS: Geranylgeranyl diphosphate synthase; LC: Lycopeneβ- cyclase; LHCI: Light harvesting complex I; LHCII: Light harvesting complex II; PD: Phytoene desaturase; PGK: Phosphoglycerate kinase; PHS: Phytoene synthase; PSI: Photosystem I; PSII: Photosystem II; R5PI: Ribose 5-phophate isomerase; RbcS: Small subunit of ribulose 1,5 biphosphate carboxylase/oxygenase (rubisco); ROS: Reactive oxygen species; RP3E: Ribulose phosphate 3; SHBP: Seudoheptulose 1,7 biphosphatase phosphoribulokinase; TK: Transketolase
Acknowledgments
We are grateful to all the members of A. Moenne and E. Castro-Nallar teams that performed the transcriptomic analyses and the interpretation of results. ECN was funded by“CONICYT-FONDECYT Iniciación 11160905”. ECN would like to thank The George Washington University’s high-performance computing facility, ColonialOne, for providing data storage, support, and computing power for genomic analyses (colonialone.gwu.edu).
Funding
This work was financed by Fondecyt 1160013 to A.M., postdoctoral fellowship Dicyt-USACH to F.R. and postdoctoral project Fondecyt 3170511 to D.L.
Availability of data and materials
https://www.ncbi.nlm.nih.gov/sra/SRP145672(SRA records will be accessible with the following link after the indicated release date May 12, 2019). https://figshare.com/articles/Rodriguez_et_al_2018/6267284
Authors’contributions
F.R. performed in vitro cultures and extraction of total RNA, C.M. determined integrity of RNA; K.N.M. performed quality control of raw reads, assembled the de novo transcriptome; annotated predicted transcripts, and performed the differential transcript analysis; F.R. annotated and classified transcripts in GO categories; D.L. selected up-regulated transcripts and performed statistical analyses; E.C.N. proposed and supervised all the bioinformatics analyses, interpreted results, and reviewed the manuscript; A.G. carried out photosynthesis experiments and prepared figures; F.R and D.L. determined carotenoid and chlorophyll levels; J.P.H.T. and F.R. participated in results discussion; A. M. wrote the paper, and A.M, F.R. and DL. interpreted results, A.M., J.P.H.T. and D.L. financed the experimental work. All authors read and approved the final manuscript.
Ethics approval and consent to participate Not applicable.
Consent for publication
All the authors approve to publish this manuscript.
Competing interests
The authors declare that they have no competing interests.
Publisher’s Note
Springer Nature remains neutral with regard to jurisdictional claims in published maps and institutional affiliations.
Author details
1Faculty of Chemistry and Biology, University of Santiago of Chile, Av.
Libertador Bernardo O’Higgins, 3363 Santiago, Chile.2Center for Bioinformatics and Integrative Biology, Facultad de Ciencias de la Vida, Universidad Andrés Bello, Santiago, Chile.3Center of Plant Biotechnology, Facultad de Ciencias de la Vida, Universidad Andrés Bello, Santiago, Chile.
4
FONDAP Center for Genome Regulation, Universidad Andrés Bello, Santiago, Chile.5Center for the Development of Nanoscience and Nanotechnology
(CEDENNA), Santiago, Chile.
Received: 16 August 2018 Accepted: 6 November 2018
References
1. Bothe H. Plants in heavy metal soils. In: Sherameti I, Varma A, editors. Detoxification of heavy metals. Berlin: Springer; 2011. p. 35–57. 2. Singh S, Parihar P, Singh R, Singh VP, Prasad SM. Heavy metal tolerance in
plants: role of transcriptomics, proteomics, metabolomics, and Ionomics. Front Plant Sci. 2016;6:1143.
Carotenoids mg g−1¼7:6A480 nm1:49A510 nmDFVð1 cmW1000Þ−1 V¼final volume of chlorophyll extract in 80%acetone mLð Þ
3. Küpper H, Küpper F, Spiller M. Environmental relevance of heavy metal-substituted chlorophylls using the example of water plants. J Exp Bot. 1996; 47:259–66.
4. Küpper H,Šetlík I, Spiller M, Küpper FC, Prášil O. Heavy metal-induced inhibition of photosynthesis: targets of in vivo heavy metal chlorophyll formation. J Phycol. 2002;38:429–41.
5. Rocchetta I, Küpper H. Chromium- and copper-induced inhibition of photosynthesis inEuglena gracilisanalysed on the single-cell level by fluorescence kinetic microscopy. New Phytol. 2009;182:405–20. 6. Lidon FC, Ramalho JC, Henriques FS. Copper inhibition of rice
photosynthesis. J Plant Physiol. 1993;142:12–7.
7. Cook CM, Kostidou A, Vardaka E, Lanaras T. Effects of copper on the growth, photosynthesis and nutrient concentrations of Phaseolus plants.
Photosynthetica. 1997;34:179–93.
8. Ratkevicius N, Correa JA, Moenne A. Copper accumulation, synthesis of ascorbate, and activation of ascorbate peroxidase inEnteromorpha compressa(L.) Grev. (Chlorophyta) from heavy etal-enriched environments in northern Chile. Plant Cell Environ. 2003;26:1599–608.
9. González A, Vera J, Castro J, Dennett G, Mellado M, Morales B, et al. Co-occurring increases of calcium and organellar reactive oxygen species determine differential activation of antioxidant and defense enzymes in Ulva compressa(Chlorophyta) exposed to copper excess. Plant Cell Environ. 2010;33:1627–40.
10. Ritter A, Dittami SM, Goulitquer S, Correa JA, Boyen C, Potin P, et al. Transcriptomic and metabolomic analysis of copper stress acclimation in Ectocarpus siliculosushighlights signaling and tolerance mechanisms in brown algae. BMC Plant Biol. 2014;14:116.
11. Tonon-Pedroso A, Zaini PA, dos Reis Falcão V, Oliveira MC, Collén J, Boyen C, et al.Gracilaria tenuistipitata(Rhodophyta) tolerance to cadmium and copper exposure observed through gene expression and photosynthesis analyses. J Appl Phycol. 2018;30:1–13.
12. Li YX, Zhou S, Zhao FJ, Liu Y, Fan PP, Wang GC. Physiological responses of Porphyra haitanesisto different copper and zinc concentrations. Braz J Oceanogr. 2010;58:261–7.
13. Andrade LR, Farina M, Amado Filho GM. Effects of copper onEnteromorpha flexuosa(Chlorophyta) in vitro. Ecotoxicol Environ Saf. 2004;58:117–25. 14. Zhang X, Ye N, Liang C, Mou S, Fan X, Xu J, et al.De novosequencing and
analysis of the Ulva linza transcriptome to discover putative mechanisms associated with its successful colonization of coastal ecosystems. BMC Genomics. 2012;13:565.
15. Laporte D, Valdés N, González A, Sáez CA, Zúñiga A, Navarrete A, et al. Copper-induced overexpression of genes encoding antioxidant system enzymes and metallothioneins involve the activation of CaMs, CDPKs and MEK1/2 in the marine algaUlva compressa. Aquat Toxicol. 2016;177:433–40. 16. Gómez M, González A, Saez CA, Morales B, Moenne A. Copper-induced
activation of TRP channels promotes extracellular calcium entry, activation of CaMs and CDPKs, copper entry and membrane depolarization inUlva compressa. Front Plant Sci. 2015;6:182.
17. Gómez M, González A, Sáez CA, Moenne A. Copper-induced membrane depolarizations involve the induction of mosaic TRP channels, which activate VDCC leading to calcium increases inUlva compressa. Front Plant Sci. 2016;7:754.
18. Gómez M, González A, Moenne F, Sáez CA, Moenne A. Copper-induced early responses involve the activation of transient receptor potential (TRP) channels, release of amino acids, serotonin and adrenalin, and activation of homologs of glutamate, adrenalin and serotonin receptors in the marine algaUlva compressa. Algal Res. 2017;26:115–22.
19. González A. Cabrera M de los A, Mellado M, Cabello S, Márquez S, Morales B, et al. Copper-induced intracellular calcium release requires extracellular calcium entry and activation of L-type voltage-dependent calcium channels inUlva compressa. Plant Signal Behav. 2012;7:728–32.
20. González A, Cabrera MA, Henríquez MJ, Contreras RA, Morales B, Moenne A. Cross talk among calcium, hydrogen peroxide, and nitric oxide and activation of gene expression involving calmodulins and calcium-dependent protein kinases in Ulva compressa exposed to copper excess. Plant Physiol. 2012;158:1451–62.
21. Schmieder R, Edwards R. Quality control and preprocessing of metagenomic datasets. Bioinformatics. 2011;27:863–4.
22. Grabherr MG, Haas BJ, Yassour M, Levin JZ, Thompson DA, Amit I, et al. Full-length transcriptome assembly from RNA-Seq data without a reference genome. Nature Biotechnol. 2011;29:644–52.
23. Conesa A, Götz S, García-Gómez JM, Terol J, Talón M, Robles M. Blast2GO: a universal tool for annotation, visualization and analysis in functional genomics research. Bioinformatics. 2005;21:3674–6.
24. Trapnell C, Williams BA, Pertea G, Mortazavi AM, Kwan G, van Baren MJ, Salzberg SL, Wold B, Pachter L. Transcript assembly and quantification by RNA-Seq reveals unannotated transcripts and isoform switching during cell differentiation. Nat Biotechnol. 2010;28:510–5.
25. Robinson MD, McCarthy DJ, Smyth GK. edgeR: a Bioconductor package for differential expression analysis of digital gene expression data.
Bioinformatics. 2010;26:139–40.
26. Robinson MD, Oshlack A. A scaling normalization method for differential expression analysis of RNA-seq data. Genome Biol. 2010;11:R25. 27. Howe E, Holton K, Nair S, Schlauch D, Sinha R, Quackenbush J. MeV:
MultiExperiment viewer. In: Ochs MF, Casagrande JT, Davuluri RV, editors. Biomedical informatics for Cancer research. Berlin: Springer. p. 267–77. 28. Stramarkou M, Papadaki S, Kyriakopoulou K, Krokida M. Recovery of
functional pigments from four different species of microalgae. IOSR J Environ Sci, Toxicol Food Technol. 2016;10:26–30.