Colorimetric method for simultaneous estimation of amlodipine besylate from plasma
6
0
0
Texto completo
(2) Ars Pharmaceutica Colorimetric method for simultaneous estimation of amlodipine besylate from plasma. Rajendra C. Doijad,1 Poournima S. Sankpal,1 Harinath N. More,2 Sachin A. Pishwikar,2 Asma B. Pathan,1 Gayathri B. Suryawanshi.1 1. Shree Santkrupa College of Pharmacy, Ghogaon, Karad Maharashtra 415111 (India); 2. Bharati Vidyapeeth’s College of Pharmacy, Kolhapur Maharashtra 415111 (India). Original Paper Artículo Original. RESUMEN. Correspondence/Correspondencia: Mrs. Poournima S. Sankpal. Shree Santkrupa College of Pharmacy, Ghogaon, Karad -415111 (M.S.) India. Email- [email protected]. estimar la cantidad de fármaco en forma combinada sin separación previa.. Objetivo. El objetivo del presente estudio era desarrollar un método de análisis que permitiera Material y Método. Se utilizó espectroscopía colorimétrica UV para la determinación de Amlodipino Besilato (AML) plasmático Resultados. El presente método está basado en la formación de color verde en la reacción entre. Competing interest / Conflicto de interes: No declared Fundings / Financiación: No declared Re ceived: 03.02.2012 Accepted: 11.02.2013. Amlodipino Besilato (AML) y cloruro férrico 0,4% y ferrocianuro potásico 0,2%. La medida de la absorbancia se realizó a 775nm. El resultado del análisis de los comprimidos mostró unos valores de DE comprendidos entre 098,22 y 100,63%. El valor de la DE utilizando metanol oscilan entre 98,01 y 101,13% lo que demuestra la capacidad del método de permanecer inalterado por pequeños pero intencionados cambios en las condiciones de la reacción, este método es usado para la estimación de Amlodipino Besilato (AML) en muestras biológicas. PALABRAS CLAVE: Amlodipino Besilato (AML), método colorimétrico. ABSTRACT Aim: The present work was to develop the method of analysis which can estimate drug in combined form without prior separation. Materials and method: By using UV spectroscopy colorimetric method was used for determination of Amlodipine besylate (AML) from plasma. Result and conclusion: This method is based on the formation of green colour in reaction between AML and 0.4 % Ferric chloride (FC) and 0.2 % Potassium ferricyanide (PF).The absorbance was measured at 775 nm. Result of tablet analysis showed % S.D. values in the range of 098.22 to 100,63%. Standard deviation value for tablet analysis by using methanol ranging from 98.01 to 101,13 % which proves the ability of the method to remain unaffected by small but deliberate change in reaction conditions and this method is used for estimation of AML from biological samples. KEY WORDS: Amlodipine besylate, colorimetric method.. 2. Ars Pharm. 2013; 54(1): 01-06..
(3) Colorimetric method for simultaneous estimation of amlodipine besylate from plasma.. INTRODUCTION: Market survey revealed that, day by day new drugs and their combination with another drugs are being introduced in market as they have more patient compliance than a single drug. The analytical chemistry hence has challenge in developing the methods for their analysis with the help of number of analytical techniques which are available for the estimation of the drugs and their combination. Analytical Chemistry involves separations, identification and determination of the relative amount of the component in a sample matter. In Analytical Chemistry ‘Quality’ is associated with accuracy and reproducibility; other criteria can be cost, speed and information. Analytical monitoring of pharmaceutical product or of specific ingredients within the product is necessary to ensure the safety and efficacy throughout the shelf life, including storage, distribution and use.1 In general terms pharmaceutical analysis comprises, those procedures necessary to determine the identity, strength, quality and purity of drugs and chemicals. Amlodipine Besylate (AML) which is widely used in the treatment of hypertension. Amlodipine Besylate is chemically 2-[(2-aminoethoxy) methyl]-4-(2-chlorophenyl)1,4dihydro-6-methyl-3,5- pyridine dicarboxylic acid -3 ethyl-5- methyl ester monobenzene sulphonate and it is a peripheral arterial vasodilator that acts directly on vascular smooth muscle to cause a reduction in peripheral vascular resistance and reduction in blood pressure. There are various methods for AML alone or in combination with other dosage form such as HPLC 1-7, UV 8-10 for simultaneous estimation. But there is no method reported for simultaneous estimation of AML from plasma by colorimetric estimation by using 0.4 % Ferric chloride (FC) and 0.2 % Potassium ferricyanide (PF). In the analysis of formulations containing two or more drugs, one drug can interfere in the estimation of another drug. To avoid this, separation of components of mixture by extraction is usually carried out which make the procedure time consuming and complicated and often lacks accuracy. The present work was undertaken to develop such method of analysis, which can estimate both the drugs in combination without prior separation which is a precise, accurate, simple, reliable and less time consuming method for estimation of drugs in plasma. METHOD Apparatus: The instrument used for the present study was PC based Jasco V-530 UV-Visible double beam Spectrophotometer with 1 cm matched pair quartz cell and spectral bandwidth of 2 nm. Ars Pharm. 2013; 54(1): 01-06.. Reagents and materials: Amlodipine Besylate was obtained as a gift sample from Cipla, Vapi, India. Ferric chloride and 0.2 % Potassium ferricyanide were purchased from Loba fine, India. Double distilled water was used throughout the experiment. Amlostat-5 in a tablet dosage form containing AML was purchased from local commercial sources. Selection of Reagent: Ferric chloride and Potassium ferricyanide were selected as a reagent for developing colorimetric reaction. The selection of reagents was made on the basis of functional groups present on the chemical structure of drug. Optimization of Reagents and Reaction Conditions: Temperature of reaction, quantity, concentration and sequence of addition of reagents were optimized after several experimental trails. 1 ml each of FC and PF having concentration of 0.4 % and 0.2 % respectively was found to be optimum for completion of reaction. The stability of formed complex was checked by recording the absorbance of the solution after an interval of 2 hours over a period of 52 hours. Preparation of Standard Stock Solutions: To the 2.5 ml of blood sample 0.5 ml of 0.1 M acetic acid was added. RBC allows settling down. Sample was centrifuged at 5000 r.p.m. for 35 min. The supernatant was collected as plasma. To the 20 ml solution of weight sample of drug (AML separately) dissolved in methanol, 2 ml of plasma solution was added. Obtained 22 ml solution was filtered through syringe filter of size 45 µm size. Final volume was adjusted to 100 ml with solvent to get stock solution containing 100 μg/ml of AML. Solution of FC (0.4 %) was prepared by dissolving 200 mg of FC in 30 ml of 1 N HCl and the final volume was made up to 50 ml with the same solvent. Solution of PF (0.2 %) was prepared by dissolving 100 mg of PF in 30 ml of double distilled water. It was then sonicated for 5 minutes and the final volume was made up to 50 ml with the same. Procedure for Plotting Calibration Curve: Appropriate aliquots of standard drug solution were taken into a series of 10 ml volumetric flasks. To each volumetric flask 1 ml of FC (0.4 %) and 1 ml of PF (0.2 %) was added and the solutions were kept for 10 minutes to complete the reaction. Completion of reaction was indicated by change in the color of solution from colorless to yellow to green. The volume was then made up to 10 ml with double distilled water to get final concentrations of 2.5, 5, 7.5, 10, 12.5, and 15µg/ml. The absorbance of the green colored species was measured at 775 nm against reagent blank. Calibration curve was constructed at the same wavelength by using Microsoft Excel® software, intercept, slope and coefficient 3.
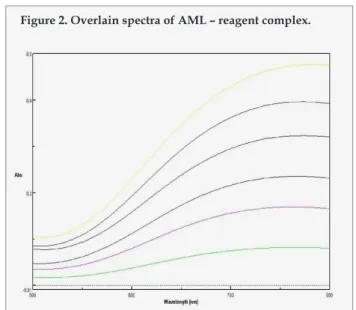
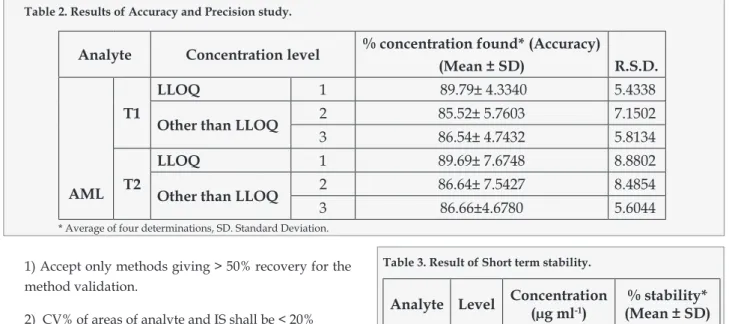
(4) Doijad RC, Sankpal PS, More HN, Pishwikar SA, Pathan AB, Suryawanshi GB.. Figure 1. Overlain spectra of AML- reagent complex and reagent.. Accuracy and Precision Study:. Table 1. Optical characteristics:. Parameters. Figure 2. Overlain spectra of AML – reagent complex.. Values for AML. Beer’s law limit (μg/ml). 2-30. Correlation coefficient. 0.9995. Regression equation (Y*) Slope (B). 0.0316. Intercept (A). 0.0032. Y= A + B*C, where C is the concentration in µg/ml and Y is absorbance unit.. Accuracy has been calculated as per USFDA guidelines, by analyzing control samples, (five determinations per three concentrations) spiked with analyte and by comparison of analytical method with reference method. Results of accuracy and precision studies are given in Table 2. Acceptance criteria: At LLOQ ± 20 % of actual spiked concentrations, other than LLOQ ± 15% of actual spiked concentrations. Recovery Studies:. of correlation values for calibration curve were obtained. Overlain spectra of drug, reagent and complex are shown in Figure 1 Overlain spectra of all the concentrations of drug used for calibration curve are shown in Figure 2 and Optical characteristics are shown in Table 1. Analysis of Formulation: Marketed tablet formulation (AML 10 mg) procured from a local pharmacy was analyzed using this method. Twenty tablets were accurately weighed and average weight was calculated. The tablets were ground to a fine powder. An accurately weighed tablet powder equivalent to 10 mg of AML was dissolved in 15 ml of methanol. The contents were ultrasonicated for 10 minutes. The solution was then filtered through Whatmann filter paper No.41 and previously separated 1 ml plasma solution was added. The solution was filtered through hydrophilic PVDF 45µm size syringe filter. Final volume was made up to 50 ml with solvent. . Appropriate aliquots within the Beer’s law limit suitable concentration were prepared and analyzed. The concentration of AML present in the sample solution was calculated by using the formula: Abs = A + B* C where, A = 0.0032, B = 0.0316 and C = concentration of AML.. Accuracy of analysis was determined by performing recovery studies by spiking different concentrations of pure drug in the preanalyzed tablet samples within the analytical concentration range of the proposed method at three different set at level of 80%, 100% and 120%. The added quantities of the individual drugs were estimated by above method. The results indicated excellent recoveries ranging from 98.77 to 100.48 %. Method validation: The method was validated according to USFDA guidelines for validation of analytical procedures in order to determine the LOQ, LLOQ, stability for the analyte. Results are shown in Table 3. MQC-medium quality control concentrations, 50% of largest concentrations of calibration curve HQC- high quality control concentrations, 75-90% of largest concentrations of calibration curve % recovery= (Mean response of extracted samples / Mean response of unextracted samples) × 100 Acceptance criteria:. 4. Ars Pharm. 2013; 53(4): 01-06..
(5) Colorimetric method for simultaneous estimation of amlodipine besylate from plasma.. Table 2. Results of Accuracy and Precision study.. Analyte. Concentration level LLOQ. T1. Other than LLOQ LLOQ. AML. T2. Other than LLOQ. % concentration found* (Accuracy) (Mean ± SD) R.S.D.. 1. 89.79± 4.3340. 5.4338. 2. 85.52± 5.7603. 7.1502. 3. 86.54± 4.7432. 5.8134. 1. 89.69± 7.6748. 8.8802. 2. 86.64± 7.5427. 8.4854. 3. 86.66±4.6780. 5.6044. * Average of four determinations, SD. Standard Deviation.. 1) Accept only methods giving > 50% recovery for the method validation. 2) CV% of areas of analyte and IS shall be < 20% RESULTS AND DISCUSSION: The method employs Ferric chloride (FC) in 1 N HCl and potassium ferricyanide (PF) to form green colored complex with AML. The absorption peaks of reagent and the complex are located at 775 nm respectively. Temperature of reaction, quantity, concentration and sequence of addition of reagents were optimized after several experimental trials. The optimum quantity and concentration of ferric chloride, PF was found to be 1 ml, 1 ml and 0.4 %, 0.2 % respectively. The results showed that optimal condition for the reaction of Ferric chloride with AML is in an acidic medium. Thus the effect of hydrochloric acid, sulphuric acid and nitric acid was studied on the color reaction. The experiments showed that the results obtained by using hydrochloric acid were superior to other acids. Concentration and quantity of PF was optimized to 0.2 % and 1 ml respectively. AML was found to obey Beer’s law in the concentration range 2 to30µg/ml employed for analysis. After mixing the components the absorbance reaches its maximum within 10 minutes at room temperature and remains stable for 48 hours. Result of analysis of tablet formulation showed % .S.D. values in the range of 098.22 to 100.63, % which indicates high precision of the method. The results indicated excellent recoveries ranging from 98.77 to 100.48 %. Recoveries obtained for the drug do not differ significantly from 100% showing that there was no interference from common excipients used in the formulation and thus indicates accuracy and reliability of the method. Interday and intraday studies show high degree of repeatability of an analytical method under normal operational conditions. Limit of detection was found to be 0.56 μg/ml and limit. Ars Pharm. 2013; 54(1): 01-06.. Table 3. Result of Short term stability.. Concentration (µg ml-1). % stability* (Mean ± SD). Low. 3. 99.56± 1.3479. High. 28. 98.94 ± 0.2166. Analyte Level AML. * Average of four determinations, SD. Standard Deviation.. of quantitation was found to be 0.67 μg/ml.For testing of robustness of the method the different ratio of methanol show adjacent absorbance. Standard deviation value for tablet analysis was ranging from 98.14 to 101.13 %.and R.S.D. was found to be 0.76 % standard deviation value for tablet analysis by using methanol Solution was found to be ranging from 98.01 to 101.13 % for AML which proves the ability of the method to remain unaffected by small but deliberate change in reaction conditions. Estimation of Amlodipine Besylate from plasma by using same procedure shows efficient application of developed method in estimation AML from biological samples. CONCLUSION: The proposed method has the advantages of simplicity, rapidity and selectivity. Low LOD and LOQ indicate that very small quantities of drug can be estimated by this method. The assay method involve less stringent control of experimental parameters such as time of analysis, the stability of the colored species, and the concentration of the reagent. The method has been validated successfully according to USFDA bioanalytical guidelines. Estimation of AML from biological samples which can be applied for bioequivalence and pharmacokinetic study. REFERENCES: 1. Naidu KR, Kale UN, Shingare MS. Stability indicating RP-HPLC method for simultaneous determination of amlodipine and benazepril hydrochloride from their 5.
(6) Doijad RC, Sankpal PS, More HN, Pishwikar SA, Pathan AB, Suryawanshi GB.. combination drug product. J Pharm Biomed Anal. 2005; 39: 147-55. 2. Chaudhari BG, Patel NM, Shah PB. Stability indicating RP-HPLC method for simultaneous determination of atorvastatin and amlodipine from their combination drug products. Chem Pharm Bull. 2007; 55: 241-6. 3. Shah DA, Bhatt KK, Shankar MB, Mehta RS, Gandhi TR, Baldania SL. RP-HPLC determination of atorvastatin calcium and amlodipine besylate combination in tablets. Indian J Pharm Sci. 2006; 68: 796-9. 4. Bahrami Gh, Mirzaeei Sh. Simple and rapid HPLC method for determination of amlodipine in human serum with fluorescence detection and its use in pharmacokinetic studies. J Pharm Biomed Anal. 2004; 36: 163-8. 5. Klinkeberg R, Streel B, Ceccato A. Development and validation of a liquid chromatographic method for the determination of amlodipine residues on manufacturing. 6. Chitlange SS, Bagri K, Sakarkar DM. Stability indicating RP- HPLC method for simultaneous estimation of valsartan and amlodipine in capsule formulation. Asian J Research Chem. 2008; 1: 15-8. 7. Kasture AV, Ramteke M. Simultaneous UVSpectrophotometric method for the estimation of atenolol and amlodipine besylate in combined dosage form. Ind J Pharm Sci 2006; 68: 394-6. 8. Gohil K, Trivedi P, Molvi KI. Spectrophotometric analysis of amlodipine besylate in bulk and tablet dosage form. Ind J Pharm Sci. 2005; 67: 376-8. 9. Mashru RC, Parikh PP. Development of a method for simultaneous estimation of amlodipine besylate and lisinopril in their combined dosage form. The Eastern Pharmacist. 2000; 53(513): 111-2. 10. Lokesh BVS, Reddy MN, Sankar DG, Sreedhar K. Extractive spectrophotometric determination of amlodipine. The Eastern Pharmacist. 1996; 39(458): 125-6.. equipment surfaces. J Pharm Biomed Anal. 2003; 32: 345-52.. 6. Ars Pharm. 2013; 53(4): 01-06..
(7)
Figure
Documento similar