TítuloEffects of compressive stockings and standard stockings in skin temperature and pressure pain threshold in runners with functional ankle equinus condition
8
0
0
Texto completo
(2) J. Clin. Med. 2018, 7, 454. 2 of 8. A lack of adequate ankle dorsiflexion can result in compensation within the gait cycle, such as an early heel lift and an increase in forefoot pressures [7], which causes pain in the forefoot [8]. The gastrocnemius muscle, in particular, is the predominant deforming force in people with structural breakdown or chronic pathological changes related to the foot and ankle. We suspect that contracture of this muscle is not only common but often partially responsible for many of the chronic forefoot and midfoot symptoms identified in non-neurologically-impaired patients [9]. Equinus can promote higher activation of the lower limb musculature. This clinical condition has been extensively studied using pressure platforms [10–13], and relationships between muscle contraction patterns in equinus have been investigated by electromyography [14,15]. Equinus is significantly associated with gait and posture [12,13], and with sports-related injuries. Activation of the skeletal musculature could modify the tendon’s mechanosensivity, and also promote heat transfer with a cutaneous temperature increase [16–19]. By using an infrared (IR) ThermaCam and an algometer, we aimed to check cutaneous temperature and pressure pain threshold (PPT) variations in runners with equinus condition, and also to examine the associations between the use of compressive stockings and standard stockings with skin temperature status and PPT values. The main purpose of this research was to assess thermal differences and PPT values in runners with equinus who were wearing either compressive or standard stockings before and after running. 2. Methods This was an observational study. Ninety-eight healthy male subjects (runners) were recruited. A consecutive sampling method was chosen to select participants from an athletic running club. Forty-nine subjects wore compressive stockings, and 49 wore standard stockings. All subjects successfully completed this observational study. The exclusion criteria consisted of several parameters: (1) the presence of scoliosis, sprains, bone alterations, infections, and musculoskeletal and tendon injuries in the lower limbs; (2) low back or pelvic pain; and (3) use of drugs in the week prior to the assessment. The compressive stockings were made of 77% polyamide, 13% elastane, and 10% polyester, and covered the area from the foot to the inferior pole of the kneecap with graduated pressure; pressure was highest at the foot and the malleolus, and decreased proximally from 25 to 20 mmHg. The variables studied included skin temperature and PPT. An IR ThermaCam (FLIR, Wilsonville, OR, USA) was used to register the temperature values of the Achilles tendon. PPT was measured with an algometer. The sample size calculation was taken as the difference between two independent groups using the G*Power (Universität Düsseldorf, North Rhine-Westphalia, Germany) statistic tool, and was based on the right Achilles tendon PPT from a case–control pilot study with two groups (mean ± standard deviation (SD), n = 10 subjects with equinus condition (1.60 ± 0.57 kg/cm2 ) and n = 10 subjects without equinus condition (1.98 ± 0.57 kg/cm2 )). Based on the one-tail hypothesis, an effect size of 0.67, α error of 0.05, and power of 0.95 were used for the sample size calculation. Therefore, a total sample size of 98 subjects, with 49 in each group, was obtained. The Ethics Committee of the HULP (Madrid, Spain; record no. CE 2828A) approved the study. All subjects provided informed consent before the beginning of the study. The Declaration of Helsinki was respected. Strengthening the Reporting of Observational Studies in Epidemiology (STROBE) guidelines were applied. Subjects were given standard protocol-related advice before attending the experimental assessment [16]. During the week prior to the trial, subjects were not allowed to use drugs. On the day of assessment, vasomotor substances (e.g., caffeine) and heavy meals were not allowed. An acclimatization period of 10 min in the examination room was completed for all the participants. Images were taken in the morning from 9:00 to 10:30 a.m..
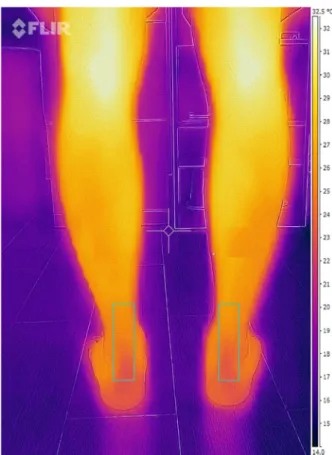
(3) J. Clin. Med. 2018, 7, 454. 3 of 8. First, participants lay in a supine position and the status of their equinus was assessed with the knee extended and flexed. Range of movement was assessed using a goniometer to check the angle between the plantar line of the foot and the tibia bone axis. PPT was checked using an algometer before and after 30 min of running. Equinus and PPT assessments were carried out by the same podiatrist in order to ensure the reliability of measurements. PPT was assessed with an analogue pressure-algometer (Mechanical algometer, FDK/FDN series Force-Dial, Wagner/Instruments, 1217-Greenwich, CT 06836; 0–10 kg/cm2 ). PPT was assessed on a scale ranging from 0 to 10 kg/cm2 . Three measurements were repeated, with a 30- to 60-sec interval between measurements, and the mean of the three measurements was recorded. The algometer tip was situated over the Achilles tendon (6 cm up from the Achilles tendon insertion), and pressure was applied until the subject indicated that the sensation switched from pressure to pain. All PPT assessments were carried out after the thermal evaluation. The first assessments for thermal image recordings and PPT measurements were carried out prior to participants putting their stockings on. Afterwards, participants put on their stockings (either compressive or standard) and began running. After completion of the activity, subjects removed their socks, and thermal images were recorded prior to PPT evaluation. The timeline for the subjects consisted of several steps: (1) entering the examination room; (2) undressing; (3) acclimatization; (4) thermal image recordings; (5) PPT assessments; (6) putting on stockings (compressive or standard); (7) treadmill running; (8) stocking removal; (9) thermal image recordings; and (10) PPT assessments. An acclimatization period of 10 min in the examination room was completed by all of the participants. The infrared imaging examination (high-resolution thermogram analysis) started with the runner standing up in a relaxed position. The Achilles tendon region was measured five times with the FLIR ThermaCam. All measurements were acquired in a laboratory with a temperature of 24.1 ± 1 ◦ C, humidity of 45% ± 10%, and no direct ventilation flow toward participants or raters. In order to improve the research quality, different paper signals were used to set the limits for the Achilles tendon with a rectangular shape (2 cm wide, 6 cm long). Subjects then ran for 30 min on a treadmill, at a speed of 10 km/h, and the IR imaging was repeated. Imaging was performed using an FLIR/SC3000/QWIP ThermaCam infrared thermal device with an 8–9 µm spectral range and a temperature sensitivity of 0.02 K (NETD at 30 ◦ C). The 320 × 240 FPA device presents a 20◦ lens. Images were captured with a 1.1 mrad spatial resolution. IR image acquisition was carried out by the same clinician, using a tripod system, in order to ensure the reliability of measurements. IR images and data were evaluated with the FLIR® software ThermaCam Researcher Professional V.2.9 (FLIR, Wilsonville, OR, USA). This software provides raters with different components of thermal values from the selected region. An IR imaging example is shown in Figure 1. The checklist for thermographic imaging in sports and exercise medicine (TISEM) was completed for reporting the conditions for thermal imaging [20]. Statistical analyses were supported by SPSS (version 22.0 for Windows, IBM SPSS Statistics for Windows, IBM Corp, Armonk, NY, USA) with an α error of 0.05 (95% confidence interval (CI)) with the desired power of 80% (β error of 0.2). The Kolmogorov–Smirnov test was performed to check data normality. All data were normally distributed, and parametric statistical tests were selected. The mean and standard deviation of the temperature values and the PPT data were obtained for the Achilles tendon. An unpaired Student’s t-test was performed to test for statistically significant differences in height, weight, body mass index, and age between the two groups. A paired Student’s t-test was performed to determine differences between the groups (compressive and standard stockings) and between imaging sessions (before and after running)..
(4) J. Clin. Med. 2018, 7, 454. 4 of 8. J. Clin. Med. 2018, 7, x FOR PEER REVIEW. 4 of 8. Figure 1. 1. Achilles tendon infrared (IR) imaging. Figure Achilles tendon infrared (IR) imaging.. 3. Results Statistical analyses were supported by SPSS (version 22.0 for Windows, IBM SPSS Statistics for Windows, IBM Corp, Armonk, NY, USA) with an α error of 0.05 (95% confidence interval (CI)) with We found no statistically significant differences between the compressive and standard stocking thegroups desired power of 80% (β error of 0.2). with respect to participants’ heights, weights, ages, or body mass indices (Table 1). The Kolmogorov–Smirnov test was performed to check data normality. All data were normally distributed, and parametric statistical(ntests were selected. The and mean and standard deviation of the Table 1. Participant characteristics = 49 compressive stocking 49 standard stocking participants). temperature values and the PPT data were obtained for the Achilles tendon. Compressive Stocking Group Standard Stocking Group An unpaired Student’s t-test was performed to test for statistically significant differences in Age (years) * ± 3.61 35.2 ± 2.3 height, weight, body mass index, and age 33.56 between the two groups. A paired Student’s t-test was performed to determine differences between the ±groups (compressive and standard stockings) and Height (cm) * 171.5 5.1 169.1 ± 4.1 between imaging Weight sessions (before and after running). (kg) * 71.2 ± 2.3 70.1 ± 2.1. 3. Results. Body mass index *. 21.1 ± 1.3. 20.8 ± 1.5. * No statistically significant difference between groups (p ≥ 0.05).. We found no statistically significant differences between the compressive and standard stocking found no to significant differences Achillesages, tendon temperatures between the two groups groupsWe with respect participants’ heights,inweights, or body mass indices. before running (Table 2). Table 1. Participant characteristics = 49 compressive stocking 49values) standard stocking However, after 30 min of running,(ntemperatures (maximum andand mean were significantly participants). higher in the standard stocking participants than in the compressive stocking participants (p < 0.05) (Table 3). Compressive Stocking Group Standard Stocking Group We did not find significant differences the PPT measurements35.2 between Age (years)* 33.56for ± 3.61 ± 2.3 the two groups before running. On the other hand, we found 171.5 significant the Achilles tendon PPT Height (cm)* ± 5.1 differences (p = 0.01) 169.1 ±in4.1 measurementsWeight between the group wearing stockings (3.670.1 ± 0.31) (kg)* 71.2compressive ± 2.3 ± 2.1 and the group wearing standard stockings (2.9index* ± 0.12) after 30 min running. Body mass 21.1of ± 1.3 20.8 ± 1.5 * No statistically significant difference between groups (p ≥ 0.05).. We found no significant differences in Achilles tendon temperatures between the two groups before running (Table 2)..
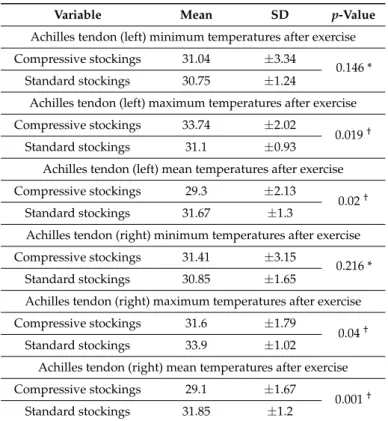
(5) J. Clin. Med. 2018, 7, 454. 5 of 8. Table 2. Temperature values (degrees Celsius) for Achilles tendons for compressive stocking and standard stocking participants before exercise. Variable. Mean. SD. p-Value. Achilles tendon (left) minimum temperatures before running Compressive stockings. 26.52. ±3.59. Standard stockings. 27.22. ±1.16. 0.581 *. Achilles tendon (left) maximum temperatures before running Compressive stockings. 29.92. ±1.58. Standard stockings. 28.93. ±1.75. 0.19 *. Achilles tendon (left) mean temperatures before running Compressive stockings. 28.57. ±1.92. Standard stockings. 27.87. ±1.47. 0.393 *. Achilles tendon (right) minimum temperatures before running Compressive stockings. 26.79. ±2.34. Standard stockings. 26.85. ±1.26. 0.213 *. Achilles tendon (right) maximum temperatures before running Compressive stockings. 29.57. ±1.88. Standard stockings. 29.51. ±1.13. 0.324 *. Achilles tendon (right) mean temperatures before running Compressive stockings. 28.29. ±1.68. Standard stockings. 28.46. ±1.93. 0.48 *. * No statistically significant difference between groups before running (p ≥ 0.05). n = 49 compressive stockings and n = 49 standard stockings; SD, standard deviation.. Table 3. Temperature values (degrees Celsius) for Achilles tendons in compressive stocking and standard stocking participants after exercise. Variable. Mean. SD. p-Value. Achilles tendon (left) minimum temperatures after exercise Compressive stockings. 31.04. ±3.34. Standard stockings. 30.75. ±1.24. 0.146 *. Achilles tendon (left) maximum temperatures after exercise Compressive stockings. 33.74. ±2.02. Standard stockings. 31.1. ±0.93. 0.019 †. Achilles tendon (left) mean temperatures after exercise Compressive stockings. 29.3. ±2.13. Standard stockings. 31.67. ±1.3. 0.02 †. Achilles tendon (right) minimum temperatures after exercise Compressive stockings. 31.41. ±3.15. Standard stockings. 30.85. ±1.65. 0.216 *. Achilles tendon (right) maximum temperatures after exercise Compressive stockings. 31.6. ±1.79. Standard stockings. 33.9. ±1.02. 0.04 †. Achilles tendon (right) mean temperatures after exercise Compressive stockings. 29.1. ±1.67. Standard stockings. 31.85. ±1.2. 0.001 †. * No statistically significant difference between groups before running (p ≥ 0.05). † Statistically significant difference between groups (p < 0.05). n = 49 compressive stockings and n = 49 standard stockings; SD, standard deviation..
(6) J. Clin. Med. 2018, 7, 454. 6 of 8. 4. Discussion We identified an increase in maximum and mean Achilles tendon temperatures after exercise in subjects with standard stockings compared to those with compressive stockings. The minimum temperature values were also higher with standard versus compressive stockings, but these differences did not achieve statistical significance. The PPT values were lower with standard stockings than with compressive stockings. The Achilles tendon undergoes greater contraction when running than when at rest, and therefore might be affected early by fatigue, thus explaining our observed increase in Achilles tendon temperatures in standard stocking subjects compared with compressive stocking subjects. When participants remained at rest [21,22], we did not find significant differences. Physical activity may serve as a stimulus for modifying temperatures in the lower limb muscles. Compressive stockings may assist with a wider range of ankle movement during loading and running, and promote venous return. Biomechanically, the maximum ankle dorsiflexion during the stance phase of a normal gait occurs before heel lift, with the knee completely extended [1]. In the reviewed literature, static evaluation of ankle dorsiflexion range of movement shows that the minimum dorsiflexion movement for the ankle for normal gait is 10◦ of motion [3,21–24]. Additional studies will be needed to improve our knowledge of this muscle condition and to establish the clinical relevance of the association between temperature and PPT in non-equinus subjects. Based on our findings, we propose that compressive stockings could be recommended to runners with equinus. 5. Conclusions Standard stocking participants had higher mean and maximum Achilles tendon temperature values after 30 min of running than compressive stocking participants. The standard stocking group also showed a lower PPT. Skin temperature measurements obtained by infrared thermography could serve as a complementary description of treadmill running for athletes with an equinus foot. Based on our findings, we propose that compressive stockings could be recommended for runners with gastrocnemius-soleus equinus condition. Practical Implications:. •. •. •. Measurable skin temperature differences exist between sportsmen with equinus wearing compressive versus standard stockings after running. Further research is needed to understand the relationship between skin temperature at the Achilles tendon and the functionality of the triceps surae muscle in running athletes. After running, measurable PPT differences exist in the Achilles tendons of sportsmen with equinus wearing compressive versus standard stockings. Whether compressive stockings are potentially protective against Achilles tendon injuries warrants further research. Although compressive stockings may be advantageous in terms of modifying calf muscle function and providing Achilles tendon protection, there is insufficient evidence to favour either type of stocking for sport and recreational activities in runners with equinus.. Author Contributions: Conceptualization: D.R.-S., R.B.-d.-B.-V., M.E.L.-I., E.M.M.-J., D.M.-G., E.P.-B., C.C.-L. and D.L.-L.; data curation: D.R.-S.; formal analysis: D.R.-S., R.B.-d.-B.-V., C.C.-L. and D.L.-L.; investigation: D.R.-S., R.B.-d.-B.-V., M.E.L.-I., E.M.M.-J., D.M.-G., E.P.-B., C.C.-L. and D.L.-L.; methodology: D.R.-S., R.B.-d.-B.-V., M.E.L.-I., E.M.M.-J., D.M.-G., E.P.-B., C.C.-L. and D.L.-L.; supervision: D.R.-S., R.B.-d.-B.-V., M.E.L.-I., C.C.-L. and D.L.-L.; writing—original draft: D.R.-S., R.B.-d.-B.-V., M.E.L.-I., D.M.-G., C.C.-L. and D.L.-L.; writing—review & editing: D.R.-S., R.B.-d.-B.-V., M.E.L.-I., E.M.M.-J., D.M.-G., E.P.-B., C.C.-L. and D.L.-L. Funding: This research received no external funding. Conflicts of Interest: The authors declare no conflicts of interest..
(7) J. Clin. Med. 2018, 7, 454. 7 of 8. References 1. 2. 3. 4. 5. 6. 7.. 8. 9.. 10. 11. 12. 13. 14. 15.. 16.. 17.. 18. 19.. 20.. 21.. Digiovanni, C.W.; Kuo, R.; Tejwani, N.; Price, R.; Hansen, S.T.J.; Cziernecki, J.; Sangeorzan, B.J. Isolated gastrocnemius tightness. J. Bone Joint Surg. Am. 2002, 84, 962–970. [CrossRef] [PubMed] Downey, M.S.; Banks, A.S. Gastrocnemius recession in the treatment of nonspastic ankle equinus: A retrospective study. J. Am. Podiatr. Med. Assoc. 1989, 79, 159–174. [CrossRef] [PubMed] Lamm, B.M.; Paley, D.; Herzenberg, J.E. Gastrocnemius soleus recession: A simpler, more limited approach. J. Am. Podiatr. Med. Assoc. 2005, 95, 18–25. [CrossRef] [PubMed] Silfverskiold, N. Reduction of the uncrossed two-joint muscles of the leg to one-joint muscles in spastic conditions. Acta Chir. Scand. 1924, 56, 315–330. Downey, M.S. Ankle Equinus. In Comprehensive Textbook of Foot Surgery, 2nd ed.; McGlamry, E.D., Banks, A.S., Downey, M.S., Eds.; Williams & Wilkins: Baltimore, MD, USA, 1992; Volume 1, p. 687. Root, M.L.; Orien, W.P.; Weed, J.H. Normal and Abnormal Function of the Foot, Spanish edition; Clinical Biomechanics Corp.: Los Angeles, CA, USA, 1977. Johnsone, C.H.; Christensen, J.C. Biomechanics of the first ray part V: The effect of equinus deformity: A 3-dimensional kinematic study on a cadaver model. J. Foot Ankle Surg. 2005, 44, 114–120. [CrossRef] [PubMed] Perez, H.R. Equinus deformity as a factor in forefoot nerve entrapment. J. Am. Podiatr. Med. Assoc. 2007, 97, 171. [CrossRef] [PubMed] Rodríguez-Sanz, D.; Losa-Iglesias, M.E.; López-López, D.; Calvo-Lobo, C.; Palomo-López, P.; Becerro-de-Bengoa-Vallejo, R. Infrared thermography applied to lower limb muscles in elite soccer players with functional ankle equinus and non-equinus condition. PeerJ 2017, 5. [CrossRef] [PubMed] Blustein, S.M.; D’amico, J.C. Limb length discrepancy. Identification, clinical significance, and management. J. Am. Podiatr. Med. Assoc. 1985, 75, 200–206. [CrossRef] [PubMed] Mahar, R.K.; Kirby, R.L.; Mcleod, D.A. Simulated leg-length discrepancy: Its effect on mean center of pressure position and postural sway. Arch. Phys. Med. Rehabil. 1985, 66, 822–824. [PubMed] Bhave, A.; Paley, D.; Herzemberg, J.E. Improvement in gait parameters after lengthening for the treatment of limb-length discrepancy. J. Bone Joint Surg. Am. 1999, 81, 529–534. [CrossRef] [PubMed] Blake, R.L.; Ferguson, H. Limb length discrepancies. J. Am. Podiatr. Med. Assoc. 1992, 82, 33–38. [CrossRef] [PubMed] Vink, P.; Huson, A. Lumbar back muscle activity during walking with a leg inequality. Acta Morphol. Neerl.Scand. 1987, 25, 261–271. [PubMed] Gurney, B.; Mermier, C.; Robergs, R.; Gibson, A.; Rivero, D. Effects of limb-length discrepancy on gait economy and lower-extremity muscle activity in older adults. J. Bone Joint Surg. Am. 2001, 83, 907–915. [CrossRef] [PubMed] Merla, A.; Iodice, P.; Tamgherlini, A.; De Michele, G.; Di Romualdo, S.; Saggini, R.; Romani, G. Monitoring skin temperature in trained and untrained subjects throughout thermal video. Conf. Proc. IEEE Eng. Med. Biol. Soc. 2005, 2, 1684–1686. [PubMed] Calvo-Lobo, C.; Diez-Vega, I.; Garcia-Mateos, M.; Molina-Martin, J.J.; Diaz-Ureña, G.; Rodriguez-Sanz, D. Relationship of the skin and subcutaneous tissue thickness in the tensiomyography response: A novel ultrasound observational study. Rev. Assoc. Med. Bras. 2018, 64, 549–553. [CrossRef] [PubMed] Ammer, K.; Formenti, D. Does the type of skin temperature distribution matter? Thermology Int. 2016, 26, 51–54. Formenti, D.; Ludwig, N.; Rossi, A.; Trecoci, A.; Alberti, G.; Gargano, M.; Merla, A.; Ammer, K.; Caumo, A. Skin temperature evaluation by infrared thermography: Comparison of two image analysis methods during the non-steady state induced by physical exercise. Infrared Phys. Technol. 2017, 81, 32–40. [CrossRef] Moreira, D.G.; Costello, J.T.; Brito, C.J.; Adamczyk, J.G.; Ammer, K.; Bach, A.J.E.; Costa, C.M.A.; Eglin, C.; Fernandes, A.A.; Fernández-Cuevas, I.; et al. Thermographic imaging in sports and exercise medicine: A Delphi study and consensus statement on the measurement of human skin temperature. J. Therm. Biol. 2017, 69, 155–162. [CrossRef] [PubMed] Mcglamry, E.D.; Kitting, R.W. Equinus foot: An analysis of the etiology, pathology and treatment techniques. J. Am. Podiatr. Med. Assoc. 1973, 63, 165–184. [CrossRef] [PubMed].
(8) J. Clin. Med. 2018, 7, 454. 22. 23. 24.. 8 of 8. Knutzen, K.M.; Price, A. Lower extremity static and dynamic relationships with rearfoot motion in gait. J. Am. Podiatr. Med. Assoc. 1994, 84, 171–180. [CrossRef] [PubMed] Nuber, G.W. Biomechanics of the foot and ankle during gait. Clin. Sports Med. 1988, 7, 1–13. [PubMed] Lopez-Lopez, D.; Araujo, R.; Losa-Iglesias, M.E.; Becerro-de-Bengoa-Vallejo, R.; Santos, A.; Rodriguez-Sanz, D.; Calvo-Lobo, C. Influence of custom foot orthoses on venous status: A quasi-experimental study. J. Mech. Behav. Biomed. Mater. 2018, 79, 235–238. [CrossRef] [PubMed] © 2018 by the authors. Licensee MDPI, Basel, Switzerland. This article is an open access article distributed under the terms and conditions of the Creative Commons Attribution (CC BY) license (http://creativecommons.org/licenses/by/4.0/)..
(9)
Figure
Documento similar
In all cases, the maximum and minimum stresses were 85% and 20%, respectively, of the average compressive strength of each size se- ries, and we kept these values through the
The influence of temperature and water availability on phenology was evaluated, taking into account the mean, maximum and minimum temperatures recorded in the periods budbreak
Inclusion criteria were: 2) acute rupture of the Achilles tendon, 2) closed and complete rupture of the Achilles tendon, 3) rupture between the Achilles tendon distal 2
Participants in the standard training group were exposed to 48 learning trials before being asked about the potential causal relationship under examination, whereas for participants
This study aimed to evaluate the results of a goal-directed burn resuscitation protocol that used standard measures of mean arterial pressure (MAP) and urine output, plus
Compressive strength values for mortars (MPa). A clear trend can be observed for this system: mortars.. activated with 6 mol.kg -1 NaOH displayed higher compressive strengths
This effect is enough to stabilize the potential and allow to extend the scenario of Higgs inflation to the experimentally preferred range of Higgs and top masses provided the mass
Number of samples (N), range, mean, standard deviation (SD), and coefficient of variation (CV) of the quality parameters for the different training and
