TítuloEffect of comercial activity of fisheries on the genetic variability of the spiny spider crab ("Maja brachydactyla") in the north eastern Atlantic
25
0
0
Texto completo
(2) FACULTADE DE CIENCIAS. UNIVERSITY OF A CORUÑA DEPARTMENT OF CELL AND MOLECULAR BIOLOGY Area of Genetics DEPARTMENT OF ANIMAL BIOLOGY, PLANT BIOLOGY AND ECOLOGY Area of Zoology. EFFECT OF COMMERCIAL ACTIVITY OF FISHERIES ON THE GENETIC VARIABILITY OF THE SPINY SPIDER CRAB (Maja brachydactyla) IN THE NORTH-EASTERN ATLANTIC. Lucía Gato Calvo 2013.
(3) FACULTADE DE CIENCIAS. TRABALLO FIN DE GRAO. Dña Ana M González Tizón y D Luis Fernández Rodríguez autorizan a presentación do traballo de fin de grao “Effect of comercial activity of fisheries on the genetic variability of the spiny spider crab (Maja brachydactyla) in the north-eastern Atlantic” presentado por Lucía Gato Calvo para a súa defensa ante o tribunal cualificador.. En A Coruña, a 14 Junio de 2013. Asdo: Ana M González Tizón. Luis Rodríguez Fernández.
(4) This project is included in a collaborative project with the Department of Cell and Molecular Biology (area of Genetics) and the Department of Animal Biology, Plant Biology and Ecology (area of Zoology), which has been developed as a result of the concession of a Collaboration Grant at University Departments during the Academic Year 2012-2013 by the Ministry of Education, Culture and Sport..
(5) Final Project – Lucía Gato Calvo 2013. INDEX 1. INTRODUCTION…………………………………………………………………………………………………… p. 2 2. OBJECTIVES……………………………………………………………………………………………………….... p. 5 3. MATERIALS AND METHODS…………………………………………………………………………….….. p. 6 3.1. Sampling………………………………………………………………………………………………………. p. 6 3.2. DNA extraction…….………………………………………………………………………………………. p. 7 3.3. Quantification and quality assessment of the obtained DNA….………………………. p. 8 3.4. PCR amplification……….………………………………………………………………………………… p. 8 3.5. Sequencing and analysis of the obtained data……………………………………………….. p. 11 4. RESULTS………..………………………………………………………………………………………………….... p. 14 4.1. PCR amplification............................................................................................ p. 14 4.2. Analysis of the obtained sequences................................................................. p. 14 5. DISCUSSION………………………………………………………………………………………………………… p. 17 6. REFERENCES……….……………………………………………………………………………………………..… p. 19.
(6) Final Project – Lucía Gato Calvo 2013. 1.- INTRODUCTION The spiny spider crab Maja brachydactyla Balss, 1922, is a decapod crustacean which belongs to the family Majidae (Ng et al., 2008). It can be found in the northeastern Atlantic, from the British Isles and Ireland to the coasts of Senegal (Picture 1), reaching the archipelagos of Azores, Madeira, Canary Islands and Cape Verde (Sotelo et al., 2008a). It was initially classified as Maja squinado Herbst, 1788, but it has recently been clarified that they are in fact two different species; morphological characteristics were used at first (Neumann, 1998) and then the difference was confirmed on the basis of molecular characteristics (Sotelo et al., 2008a).. British Isles. Azores Madeira Canary Islands Cape Verde. Picture 1. Spatial distribution of the spiny spider crab Maja brachydactyla. The life cycle of Maja brachydactyla (Picture 2) can be divided into three main stages: larval stage, juvenile stage and adult or reproductive stage (Corgos, 2004). Larvae are released in coastal areas, where they become juveniles in two to three weeks. During this period of time, they go through three larval stages separated by moults (two zoea stages and one megalopa stage). Once settlement has occurred, at the end of planktonic stage, juveniles remain in shallow waters (<15m) for two or three years (depending on the moment of the year when settlement takes place), until they undergo the terminal moult and reach sexual maturity to become adults. This usually happens at the end of summer or the beginning of autumn. Recent studies suggest that juvenile individuals frequently migrate between rocky and sandy bottoms, basically at night, in order to get food and refugees, respectively. Once they have reached adulthood, spider crabs migrate to deeper waters (30-100m) to reproduce. Reproductive migrations begin in the autumn and ovigerous females return to shallow waters during the following spring to incubate their first spawning of the annual cycle. Incubation period lasts between 30 and 74 days, varying with water temperature, and sperm storage in spermathecae allows females to fertilize as many as three broods without mating in between (Corgos, 2004; González-Gurriarán et al., 1998). Fertility is really high and each spawning can consist in more than 500.000 eggs in the largest females. As well, adults can live from two to three years, and that is the reason why spiny spider crab populations consist of several overlapping cohorts (Sotelo et al., 2008b).. 2.
(7) Final Project – Lucía Gato Calvo 2013. Hatching. Spawning. Eggs. Zoea. Adult. Larval development. Terminal moult. Settlement. Juvenile. Megalopa. Picture 2. Life cycle of the spiny spider crab Maja brachydactyla. Spiny spider crab is an economically important fishing resource and it suffers an intensive exploitation pressure, especially in France and the United Kingdom (Freire et al., 2002). In Galicia (north-west of Spain), a 90% of the new production of the population is annually extracted so the spiny spider crab has been classified as an overexploited resource. Nevertheless, genetic studies which have been carried out up to now do not show evidences of overexploitation. On the other hand, they do indicate the need to increase sampling sizes and include a higher number of sampling localities (Sotelo et al., 2008b). The intensive fishing activity for this resource could affect the genetic structure of its natural populations in two distinct ways: 1. Extraction and reduction of local genetic variants, which have associated genetic drift effects. 2. Export of spiny spider crabs to markets placed in other geographical localities, something which represents an artificial mechanism of genetic flow. This phenomenon could be occurring in Galicia as a consequence of the import and temporary storage of. 3.
(8) Final Project – Lucía Gato Calvo 2013 spawning females in fisheries until sale. Eggs in an advanced developmental stage could hatch in the fishery and larvae could join local populations. This study aims to contribute novel information on the possible homogenizing effect of the activity of fisheries on the genetic variability of population groups from different geographical localities.. 4.
(9) Final Project – Lucía Gato Calvo 2013. 2.- OBJECTIVES This project has the objective of studying the effect of commercial activity on the genetic variability of the spiny spider crab Maja brachydactyla Balss, 1922, by means of molecular analysis of the mitochondrial genes for cytochrome c oxidase subunit I (COI) and 16S ribosomal subunit (16S).. 5.
(10) Final Project – Lucía Gato Calvo 2013. 3.- MATERIALS AND METHODS 3.1.- Sampling Forty individuals from 3 localities in the north-eastern Atlantic region were analysed (Picture 3). Twenty five of them were from Lorient (France, 47°44’45’’N 3°21’59’’W), 13 were from Saint-Malo (France, 48°38’50’’N 2°00’32’’W) and 2 were from Cedeira (Spain, 43°39’00’’N 8°03’00’’W). A pereiopod or a pleopod (Picture 4) was obtained from each one and preserved in absolute ethanol until processing.. Saint-Malo Lorient. Cedeira. Picture 3. Sampling localities. 6.
(11) Final Project – Lucía Gato Calvo 2013. PEREIOPODS. PLEOPODS PEREIOPODS. Picture 4. Anatomy of decapod crustaceans. Pereiopods and pleopods are highlighted. Images were taken and modified from www.arthursclipart.org and www.pictospin.com. 3.2.- DNA extraction Genomic DNA of the individuals was extracted from pereiopods muscle tissue (with the exception of the individuals from Cedeira, in which the extraction was performed on pleopods) using RealPure extraction kit (REAL). Approximately 20mg of muscle tissue were dissected from each sample. They were added 600μl of lysis solution and were mechanically homogenized before the addition of 3μl of K proteinase in order to increase the surface exposed to enzymatic activity. After being inversion-mixed, samples were incubated overnight at 55°C with mechanical shaking. Once cooled at room temperature, lysates were added 3μl of RNase, mixed by inversion and incubated at 37°C during 30min. Afterwards, 360μl of protein precipitation solution were added to the samples, which were also vigorously mixed by vortex and centrifuged at 14000g during 8min. This treatment resulted in the precipitation of a thick protein pellet at the bottom of the Eppendorf tubes. While samples were being centrifuged, new Eppendorf tubes were disposed with 600μl of isopropanol, in which the supernatants containing the DNA were then poured. Later, samples were inversion-mixed and centrifuged again at 14000g during 3min. As a result, DNA formed a. 7.
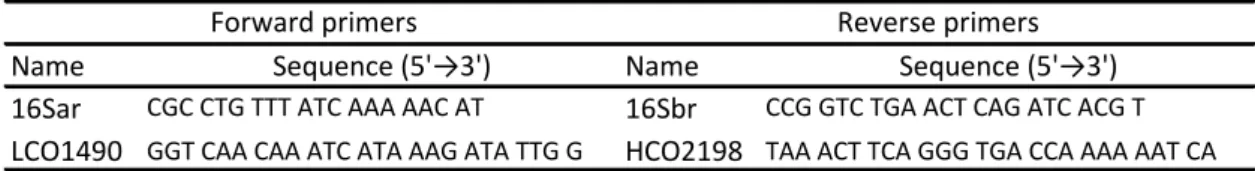
(12) Final Project – Lucía Gato Calvo 2013 thin pellet at the bottom of the tubes. Supernatants were discarded and DNA pellets were washed with 600μl of 70% ethanol. Then, samples were centrifuged at 14000g during 2min and ethanol was carefully removed. Tubes were inverted on clean absorbent paper and allowed to air-dry. Finally, DNA was re-suspended in 100μl of hydration solution and it was incubated overnight at room temperature to favour re-hydration. 3.3.- Quantification and quality assessment of the obtained DNA The success of the DNA extraction procedure was assessed by means of a 1% agarose gel electrophoresis stained with RedSafe (Chembio). Once checking was done, the DNA quantity obtained in each case and its quality were determined with NanoDrop 1000 (Thermo scientific). Dilutions adjusted at 10ng/μl of concentration were then prepared (in the cases in which this was necessary) and stored at 4°C until they were used in the following molecular analysis. Original DNA extractions were preserved as a stock for future analysis at -80°C. 3.4.- PCR amplification Amplification of 16S and COI mitochondrial genes was started as soon as genomic DNA samples were available. Primers 16Sar and 16Sbr employed in the studies of Sotelo et al. (2008a, b) and Palumbi et al. (1991) were used at first to amplify 16S gene, whereas LCO1490 and HCO2198 primers used in the studies of Sotelo et al. (2008a, b; 2009a, b) and Folmer et al. (1994) were used to amplify COI gene (Table 1). Table 1. Sequences of the initial primers for the amplification of 16S and COI genes Forward primers Reverse primers Name Sequence (5'→3') Name Sequence (5'→3') CGC CTG TTT ATC AAA AAC AT CCG GTC TGA ACT CAG ATC ACG T 16Sar 16Sbr LCO1490 GGT CAA CAA ATC ATA AAG ATA TTG G HCO2198 TAA ACT TCA GGG TGA CCA AAA AAT CA. A temperature gradient from 43°C to 54°C and two magnesium concentrations (1.5mM and 3mM) were tested to determine the best amplification conditions for each gene. Reactions were carried out in a final volume of 25μl, containing 25ng of DNA, PCR buffer (10mM HCl, 1.5mM MgCl2, 50mM KCl, pH 8.3), dNTP mix (200μM), 0.5μM of each primer and 0.25U of BIOTAQ polymerase (Roche Applied Science). To test the 3mM magnesium concentration, 3.57μg of MgCl2 were additionally added from a 25mM stock solution. Thermocycler (MyCycler Thermal Cycler, Bio-Rad Laboratories) was programmed as follows: 5min at 95°C; 35 cycles of 30s at 95°C, 30s at 43°C-54°C and 45s at 72°C; 5min at 72°C and 30min at 4°C (Picture 5). PCR products were visualized by being run in 1% agarose gels stained with RedSafe. 95°C 5min 35 cycles of:. 95°C 30s 43°C-54°C 30s 72°C 45s. 72°C 5min 4°C Picture 5. Initial PCR profile for the amplification of 16S and COI genes. 8.
(13) Final Project – Lucía Gato Calvo 2013 Another pair of primers employed by Sotelo et al. (2009a, b) was decided to be tested in the cases in which 16S gene amplification was not successful: 16L29 and 16HLeu (Schubart, 2009). Amplification conditions were the same as in the initial experiment; that is, a temperature gradient from 43°C to 54°C and magnesium concentrations of 1.5mM and 3mM were tested with the described PCR profile. PCR products were visualized in a 1% agarose gel electrophoresis and then they were sequenced. In the cases in which there was no amplification success, it was decided to request for 16L29 and 16HLeu primers again, but modified: M13 tails were added with the purpose of obtaining a proper sequence reading (Table 2). Table 2. Sequences of the primers for the amplification of 16S gene Name 16L29M13. Forward primer Sequence (5'→3'). Reverse primer Sequence (5'→3'). Name. GTA AAA CGA CGG CCA GTY GCC TGT TTA TCA AAA AC. 16HLeuM13. CAG GAA ACA GCT ATG ACC ATA TTA TCT GCC AAA AT. Furthermore, a touchdown PCR was programmed as to improve the specificity of the amplification reaction: 5min at 94°C; 5 cycles of 30s at 94°C, 90s at 45°C and 60s at 72°C; 5 cycles of 30s at 94°C, 90s at 65°C-60°C (with a decrease in temperature of 1°C per cycle) and 60s at 72°C; a final extension of 5min at 72°C and a cooling step at 4°C (Picture 6). Just as in the previous cases, PCR products were run in 1% agarose gels stained with RedSafe and they were sequenced when successfully amplified. Given the good performance which was obtained with this protocol, it was used in all the following amplifications of 16S gene. 94°C 5min 5 cycles of:. 5 cycles of:. 30 cycles of:. 94°C 30s 45°C 90s 72°C 60s 94°C 30s 65°C-60°C 90s 72°C 60s. (↓1°C/cycle). 94°C 30s 60°C 90s 72°C 60s. 72°C 5min 4°C Picture 6. Touchdown PCR designed for the amplification of 16S gene with 16L29M13 and 16HLeuM13 primers. On the other hand, COI gene PCR products for which it was no possible to obtain the sequence were tried to be cloned by using the kit StrataClone PCR Cloning Kit (Agilent Technologies): 1.5μl of cloning buffer StrataClone were mixed with 1μl of PCR product and 0.5μl of vector mix StrataClone and the ligation reaction mixture was incubated at room temperature during 5min. Meanwhile, a tube of competent cells StrataClone SoloPack was thawed on ice. The ligation reaction was placed on ice when completed and 1μl of it was then mixed with half of the competent cells (25μl) without repeated pipetting. The resultant transformation mixture. 9.
(14) Final Project – Lucía Gato Calvo 2013 was incubated on ice during 20min. Over this period of time, liquid LB medium was prewarmed at 42°C (it had previously been prepared with 10g of NaCl, 10g of tryptone, 5g of yeast extract and distilled water in a final volume of 1 litre; pH had been adjusted to 7.0 with 5N NaOH and the mixture had been autoclave-sterilized). Once the incubation was finished, cells were heat-shocked at 42°C during 45s and they were then incubated on ice during 2min. Eventually, 250μl of pre-warmed LB medium were added to the transformation reaction mixture and 90μl of the resultant mixture were then plated on LB-ampicillin plates (they had previously been prepared following the same steps as with liquid LB medium, but adding 20g of agar and 100g ampicillin, too), over which it had previously been spread 40μl of 2% Xgal. Afterwards, these plates were incubated overnight at 37°C. Later, white-coloured colonies were selected (they should contain a PCR product insert) and cell lines were plated on a new LB-ampicillin plate, which was subsequently incubated overnight at 37°C. Finally, several colonies of each cell line were randomly selected and they were individually placed into PCR tubes containing 10μl of sterile MilliQ water to induce cell lysis and then assess cloning success through PCR. Each tube was added PCR buffer (10mM Tris-HCl, 1.5mM MgCl2, 50mM KCl, pH 8.3), dNTP mix (200mM), 0.8μM of each primer (M13F and M13R) and 0.25U of BIOTAQ polymerase (Roche Applied Science) in a final volume of 25μl. PCR was programmed as follows: 5min at 94°C; 35 cycles of 1min at 94°C, 1min at 55°C and 1min at 72°C; a final extension of 5min at 72°C and a cooling step at 4°C (Picture 7). PCR products were visualized in a RedSafe-stained 1% agarose gel electrophoresis. 94°C 5min 35 cycles of:. 94°C 60s 55°C 60s 72°C 60s. 72°C 5min 4°C Picture 7. PCR profile for the amplification of the inserts. A literature search on PCR primers used up to now to amplify fragments of COI mitochondrial gene in decapod crustaceans was performed at last. The suitability of four primer pairs (Table 3) was decided to be tested. Table 3. Sequences of the tested primer pairs for the amplification of COI gene Name. Forward primers Sequence (5'→3'). Name. Reverse primers Sequence (5'→3'). References. LCO1490M13. GTA AAA CGA CGG CCA GTG GTC AAC AAA TCA TAA AGA TAT TGG. HCO2198M13. GTA AAA CGA CGG CCA GTG GTC AAC AAA TCA TAA AGA TAT TGG. [1]. CrustDF1. GGT CWA CAA AYC ATA AAG AYA TTG G. CrustDR1. GGT CWA CAA AYC ATA AAG AYA TTG G. [2]. COL6. ACA AAT CAT AAA GAT ATY GG. COH6. ACA AAT CAT AAA GAT ATY GG. [3]. CrustF1M13. GTA AAA CGA CGG CCA GTT TTT CTA CAA ATC ATA AAG ACA TTG G. HCO2198M13. GTA AAA CGA CGG CCA GTG GTC AAC AAA TCA TAA AGA TAT TGG. [1], [4]. [1]: Matzen da Silva et al., 2011; [2]: Radulovici et al., 2009; [3]: Schubart, 2009; [4]: Costa et al., 2007. Each primer pair was tested at a temperature gradient of 50°C-56°C and two different magnesium concentrations (1.5mM and 3mM). The PCR profile was the same as initially. 10.
(15) Final Project – Lucía Gato Calvo 2013 described and PCR products were run in a 1% agarose gel. COL6/COH6 was selected and a touchdown PCR was designed in order to improve specificity and guarantee a proper amplification of all samples, just as in the case of 16S gene. PCR profile was as follows: 5min at 94°C; 5 cycles of 30s at 94°C, 90s at 45°C and 60s at 72°C; 6 cycles of 30s at 94°C, 90s at 61°C56°C (with a decrease in temperature of 1°C per cycle) and 60s at 72°C; 29 cycles of 30s at 94°C, 90s at 56°C and 60s at 72°C; a final extension of 5min at 72°C and a cooling step at 4°C (Picture 8). PCR products were run in 1% agarose gels and then they were sequenced. This procedure was used to amplify COI gene in all the following samples. 94°C 5min 5 cycles of:. 6 cycles of:. 29 cycles of:. 94°C 30s 45°C 90s 72°C 60s 94°C 30s 61°C-56°C 90s 72°C 60s. (↓1°C/cycle). 94°C 30s 56°C 90s 72°C 60s. 72°C 5min 4°C Picture 8. Touchdown PCR designed for the amplification of COI gene with COL6 and COH6 primers. 3.5.- Sequencing and analysis of the obtained data Automatic sequencing of PCR products was carried out by the Molecular Biology Unit of the Research Support Services of the University of A Coruña. The genetic analysis system CEQTM 8000 (Beckman Coulter) and the genetic analysis system 3130xl (Applied Biosystems) were used for that purpose. The technique of automatic sequencing is based on the traditional Sanger sequencing method, but it employs fluorescent marking instead of radioactive marking; this allows the simultaneous reading of the products of four different reaction mixtures (a different reaction mixture is usually prepared for each triphosphate nucleotide, and each of them is marked with a different fluorochrome). The identity of the sequences was confirmed using BLAST computer service, which is implemented in the National Centre for Biotechnology Information (NCBI). This means that each obtained sequence was aligned with the available sequences from GenBank database (also implemented in NCBI) and a signification value was calculated for the identified local similarities. So, sequences were checked out with the aim of assessing whether they really corresponded to 16S and COI genes of the spiny spider crab Maja brachydactyla. COI sequences were aligned with the computer program ClustalX (Larkin et al., 2007) and electropherograms were revised in order to correct the sequences by hand. The resultant alignment was saved as a .pir format document with the aim of transferring it to BioEdit v7.1.11 (Hall, 1999). Modification of the mitochondrial genetic code of Escherichia coli (which. 11.
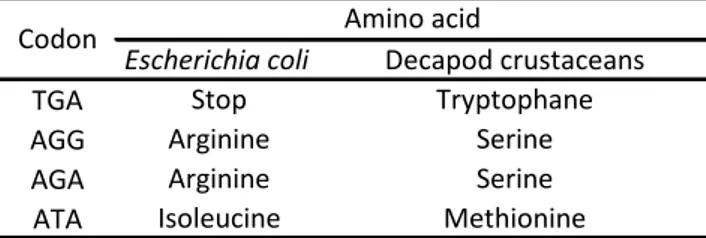
(16) Final Project – Lucía Gato Calvo 2013 is implemented by default) to convert it into the mitochondrial genetic code of decapod crustaceans was required to perform data analysis with this computer program. This implied the determination of the mitochondrial genetic code of decapod crustaceans through GenDecoder (Abascal et al., 2006). The performed modifications were those represented in Table 4. Table 4. Modifications performed in mitochondrial genetic code Codon TGA AGG AGA ATA. Escherichia coli Stop Arginine Arginine Isoleucine. Amino acid Decapod crustaceans Tryptophane Serine Serine Methionine. Once the modifications were done, the start codon was determined, taking into account the putative proteins which would be obtained by the translation in each of the six reading frames. Afterwards, nucleotide sequences were transformed into amino acid sequences and the latter were aligned. This amended alignment was transformed again into nucleotide sequences, which were saved as a .pir format document to be employed in the following analyses. The amended alignment was analysed with DnaSP v5.10.01 (Librado & Rozas, 2009), in which the character of protein-coding sequence was specified and the mitochondrial genetic code of Drosophila was selected (previously, it had been determined to be equivalent to the mitochondrial genetic code of decapod crustaceans). Considering that the amplified COI region lacks introns, the whole length of the sequences was established as protein-coding and 3 sequence sets were defined: Lorient, Saint-Malo and Cedeira. Several variability parameters were then calculated for all the populations as a whole and for each single population: number of polymorphic sites (S), number of segregating sites (SS), number of synonymous changes (SC), nucleotide diversity (π, as well as its standard deviation), number of haplotypes (k), haplotype diversity (h, as well as its standard deviation), number of synonymous sites, number of non-synonymous sites, synonymous substitution rate (Ks), non-synonymous substitution rate (Ka) and Tajima’s D (D, as well as its statistical significance). At last, the data file was saved as a .meg format document. Finally, sequences were analysed with MEGA5 (Tamura et al., 2011). The 3 mentioned data sets were defined again and the best-fit model of nucleotide substitution was estimated with the software designed by Posada & Crandall (1998), which is implemented in MEGA5. Intergroup and intra-group genetic distances were determined and a maximum likelihood phylogeny tree was built. The nucleotide composition of the sequences was also obtained. On the other hand, the sequences of 16S gene were aligned with ClustalX (Larkin et al., 2007) and corrected by hand through electropherograms revision, too. As it is not a protein-coding gene, these sequences were directly analysed with DnaSP v5.10.01 (Librado & Rozas, 2009). Likewise, 3 sets of sequences were defined (Lorient, Saint-Malo and Cedeira) and the following parameters of variability were computed: number of polymorphic sites (S), number of segregating sites (SS), nucleotide diversity (π, as well as its standard deviation), number of. 12.
(17) Final Project – Lucía Gato Calvo 2013 haplotypes (k), haplotype diversity (h, as well as its standard deviation) and Tajima’s D (D, as well as its statistical significance). The data file was converted into a .meg format document and MEGA5 was used to carry out a similar analysis to that described for 16S gene (definition of groups, estimation of the best-fit nucleotide substitution model, computing of inter-group and intra-group genetic distances, building of a maximum likelihood phylogeny tree and obtaining nucleotide composition). Eventually, sequences of 16S and COI genes were concatenated in a new data file through DnaSP v5.10.01. It was saved as a .meg format document with the aim of building a phylogeny tree with a higher discrimination power through MEGA5.. 13.
(18) Final Project – Lucía Gato Calvo 2013. 4.- RESULTS 4.1.- PCR amplification The primers which were initially tested for the amplification of 16S mitochondrial gene, namely 16Sar and 16Sbr (Palumbi et al., 1991), did not generate amplification products in any case. Afterwards, 16L29 and 16HLeu primers (Schubart, 2009) did generate the expected amplification products and they were visualized in agarose gel electrophoresis. However, complete sequencing was not possible in any case and sequences with variable and shorterthan-expected lengths (approximately 700bp) were always obtained. Eventually, 16L29M13 and 16HLeuM13 showed an excellent yield and 16S gene was amplified and sequenced in every case. On the other hand, the primers which were initially tested for the amplification of COI mitochondrial gene, namely LCO1490 and HCO2198 (Folmer et al., 1994), did generate amplification products under the described conditions in every case. This was checked through electrophoresis gels but sequencing was not possible in any case. For this reason, some PCR products were tried to be cloned, but the ligation to the vector was not achieved in any case. As long as sequencing and cloning turned out to be impossible, the literature search which resulted in the selection of COL6 and COH6 primers (Schubart, 2009) was carried out. Every tested primer pair (Table 3) generated amplification products but the most suitable one was COL6/COH6 because of the high intensity of the bands in the electrophoresis gel and the absence of unspecific amplification products. The efficiency of this primer pair was excellent and COI gene was amplified and sequenced in every case. 4.2.- Analysis of the obtained sequences The length of the amplified 16S mitochondrial gene fragment varied between 671bp and 694bp. The nucleotide composition averaged 35.5% thymine, 11.5% cytosine, 34.1% adenine and 18.9% guanine. The analysis with DnaSP v5.10.01 computer program resulted in the identification of 30 haplotypes (k) defined by 32 polymorphic sites, between which there were 17 segregating sites (SS) and 16 parsimony informative sites (S*) (Table 5); that is, one of the 17 segregating sites does not contribute information to the differentiation of localities. Likewise, nucleotide diversity (π) and haplotype diversity (h) were quite high; SD(π) and SD(h) respectively represent their standard deviations, which are remarkably high in the case of Cedeira population due to the reduced sampling size. Tajima’s test (D represents the statistical parameter and P(D) its significance) had no significance in every case in which it could be applied. This points out the selectively neutral nature of the mutations which were found in the different localities. The statistical test could not be applied to Cedeira population, from which only 2 individuals were available (the test requires 4 at least).. 14.
(19) Final Project – Lucía Gato Calvo 2013 Table 5. Genetic variability parameters for 16S gene in the different localities Locality Lorient Saint Malo Cedeira Total. n 25 13 2 40. S* 27 (14+13) 29 (16+13) 17 (17+0) 32 (16+16). SS 12 15 17 17. π 0.01075 0.01355 0.02707 0.00925. SD(π) 0.00169 0.00167 0.01354 0.00114. k 19 13 2 30. h 0.960 1.000 1.000 0.962. SD(h) D 0.027 -1.528 0.030 -1.336 0.500 n/a 0.020 -1.587. P(D) >0.10** >0.10** n/a 0.10>P>0.05**. *The number of polymorphic sites which appear only once and the number of polymorphic sites which are parsimony informative are given in brackets **Not significant test for α=0.05. The best-fit nucleotide substitution model was T92+G+I (Tamura, 1992), which was employed to estimate mean genetic distances inside localities (d, intra-group distances) and between different localities (inter-group distances) (Table 6). The former were strongly similar and low through the different localities and their standard deviations (SD(d)) were really small, something which indicates that the individuals belonging to each sampling locality are quite similar between them. Furthermore, inter-group genetic distances (values under the principal diagonal of the matrix on the right) were also very low and similar, with equally reduced standard deviations (values over the principal diagonal of the matrix). Therefore, there are not large differences between the localities of study. Table 6. Intra-group and inter-group genetic distances for 16S gene Locality Lorient Saint-Malo Cedeira. d 0.009 0.009 0.010. SD(d) 0.002 0.002 0.004. Lorient 0.009 0.010. Saint-Malo 0.002. Cedeira 0.002 0.002. 0.009. T92+G+I model was also used to build a maximum likelihood phylogeny tree. In accordance with the obtained inter-group genetic distances, this tree did not show a clear differentiation between localities (data not shown). On the other hand, the length of the amplified COI gene fragment varied between 555bp and 579bp. Mean nucleotide composition was 35.1% thymine, 20.3% cytosine, 26.3% adenine and 18.2% guanine. The analysis with DnaSP v5.10.01 resulted in the identification of 39 haplotypes (k) defined 69 polymorphic sites, between which 47 were segregating sites (SS) and 46 were parsimony informative sites (S*) (Table 7); this means that one out of 47 segregating sites does not contribute information to the differentiation of localities. Moreover, 10 out of 47 segregating sites represented synonymous changes (SC); that is, they were generally placed in the third position of a codon and they did not involve any change in the amino acid composition of cytocrome c oxidase subunit I. Nucleotide diversity (π) and haplotype diversity (h) were quite high and their standard deviations (SD(π) and SD(h)) were small, just as in the case of 16S gene; the only exception was Cedeira locality again, in which standard deviation was unusually high because of the small sampling size. Tajima’s test was significant for Lorient locality and for all the samples taken as a whole, indicating that at least one of the identified mutations is not selectively neutral. The negative value of D suggests either a possible purifying selection or a population expansion, given the excess of low frequency polymorphisms which were found in relation to the expected results derived from the. 15.
(20) Final Project – Lucía Gato Calvo 2013 hypothesis of the test. Tajima’s test could not be applied to Cedeira locality because it did not have the minimum required number of sequences. Table 7. Parameters of genetic variability for COI gene in the different localities Localidad Lorient Saint-Malo Cedeira Total. n S* SS SC 25 65 (47+18) 45 10 13 52 (31+21) 20 1 2 15 (15+0) 11 4 40 69 (46+23) 47 10. π 0.01858 0.02219 0.02273 0.01631. SD(μ) 0.00454 0.00260 0.01136 0.00291. k 25 13 2 39. h 1.000 1.000 1.000 0.999. SD(h) D P(D) 0.011 -1.839 <0.05 0.030 -1.223 >0.10** 0.500 n/a n/a 0.006 -1.851 <0.05. *The number of polymorphic sites which appear only once and the number of polymorphic sites which are parsimony informative are given in brackets **Not significant test for α=0.05. Likewise, pair-wise comparisons resulted in the identification of 0 to 6 synonymous differences and 0 to 7 non-synonymous differences. Synonymous evolution rate (Ks) and non-synonymous evolution rate (Ka) varied from 0 to 0.047 and between 0 and 0.0182, respectively. Therefore, synonymous evolution rate is higher than non-synonymous evolution rate, just as it could be expected of a protein that is important for the organism. The best-fit nucleotide substitution model was T92+G+I (Tamura, 1992), like in the case of 16S gene. This model was employed to estimate mean genetic distances inside localities (d, intragroup distances) and between different localities (inter-group distances) (Table 8). The results were almost the same as the ones obtained for 16S gene: intra-group distances were low and similar through the different localities again, with reduced standard deviations. This indicates that individuals from each locality are very similar between them. Also, inter-group genetic distances (values under the principal diagonal of the matrix in the right) were equally small and similar and had little standard deviations (values over the principal diagonal of the matrix). This suggests that there are not important differences between different localities. Table 8. Intra-group and inter-group genetic distances for COI gene Locality Lorient Saint-Malo Cedeira. d 0.017 0.016 0.018. SD(d) 0.003 0.003 0.006. Lorient 0.017 0.016. Saint-Malo 0.003. Cedeira 0.003 0.003. 0.017. T92+G+I model was used to build a maximum likelihood phylogeny tree for COI gene. Similarly to the results obtained for 16S gene and in accordance with the discussed inter-group genetic distances, this tree did not allow to distinguish between different localities (data not shown). Finally, the maximum likelihood phylogeny tree which was built with the concatenated sequences of 16S and COI genes did not discriminate different populations either (data not shown).. 16.
(21) Final Project – Lucía Gato Calvo 2013. 5.- DISCUSSION The genetic variability of the spiny spider crab Maja brachydactyla was studied in three coastal localities of north-eastern Atlantic. The main conclusions which can be drawn from this study are, first, that the genetic variability of the spiny spider crab is quite high in spite of the high fishing pressure that it suffers, and, second, those localities seem to be genetically homogeneous. The range of nucleotide diversity observed values in mitochondrial DNA (π=0.00925-0.02273) agrees with the mean values which have been reported for other crustaceans (π>0.01). The same is of application to haplotype diversity, which in this study varied between 0.960 and 1.000 and which has a mean value higher than 0.8 in other crustaceans (Khamnamtong et al., 2009; Inoue et al., 2007; Trontelj et al., 2005; Stamatis et al., 2004; Lavery et al., 1996). This fact contradicts the results which were obtained in the studies of Sotelo et al. (2008b), in which nucleotide diversity is an order of magnitude lower (π=0.003-0.005), and implies that the spiny spider crab Atlantic population is quite more diverse than what was found initially. However, a haplotype diversity of 1.000 is too high and that could be due to the reduced sampling size (especially in the case of Cedeira) and/or to a random sampling mistake. Anyway, the two French sampled localities have an important economic activity based in the spiny spider crab and they export huge quantities of this organism to Spain. Therefore, the strong exploitation pressure does not appear to have affected the genetic diversity of Maja brachydactyla in these areas. It would be interesting to have further individuals and sampling localities from Spanish Atlantic and Cantabric coasts, as the importation of French spiny spider crabs may be affecting the genetic structure of local communities. Unfortunately, the available data are not enough to obtain conclusive results for the moment. On the other hand, further analysis on the geographic distribution of the identified haplotypes is needed. It could contradict the apparent genetic homogeneity which has been found to reveal some kind of population structure, just as it was reported by Sotelo et al. (2008b). The remarkably usefulness of pleopods for the extraction of Maja brachydactyla genomic DNA has to be highlighted because they are not as relevant as pereiopods to commercial activity. The performance of the DNA extraction protocol was very similar to that of pereiopods and PCR amplification was equally successful. So, it is indeed possible to sample market spiny spider crabs without causing neither an extensive damage nor a reduction in price (which can derive from the lack of some of their valuable walking legs). Finally, the failure of the amplification of 16S mitochondrial gene with the primers 16Sar and 16Sbr (Palumbi et al., 1991) and the impossibility of neither sequencing nor cloning the PCR products of COI gene obtained with LCO1490 and HCO2198 primers (Folmer et al., 1994) could be explained by the universal character of these primer pairs, which were originally developed for the amplification of 16S and COI genes in any kind of organism. The spiny spider crab might have some mutation in the annealing region which could impede the association between the primers and the DNA template, and this will explain the lack of amplification of 16S gene. In the case of COI gene, it is possible that the annealing specificity is not high enough and that,. 17.
(22) Final Project – Lucía Gato Calvo 2013 consequently, primers are able to become associated with several regions along the DNA template (even with a pseudogene) to generate amplification products of different lengths and sequences. These unspecific products can severely hinder sequencing and so make it impossible to obtain the expected results. This problem was already discussed by Schubart (2009), who pointed out the fact that this primer pair is not optimized for the amplification of COI mitochondrial gene in decapod crustaceans. In conclusion, the genetic variability of the spiny spider crab Maja brachydactyla seems to be higher than initially reported and its local populations along north-eastern Atlantic coast appear to be genetically homogeneous. Nevertheless, results are not conclusive and more detailed studies should be carried out in order to determine the effect of fishing activity on this resource with accuracy.. 18.
(23) Final Project – Lucía Gato Calvo 2013. 6.- REFERENCES Abascal, F., Zardoya, R., Posada, D. 2006. GenDecoder: genetic code prediction for metazoan mitochondria. Nucl Acids Res 34: W389-W393. Andrés, M., Estévez, A., Anger, K., Rotlland, G. 2008. Developmental patterns of larval growth in the edible spider crab, Maja brachydactyla (Decapoda: Majidae). J Exp Mar Biol Ecol 357: 35-40. Balss, H. 1922. Crustacea VII: Decapoda Brachyura (Oxyrhyncha und Brachyrhyncha) und geographische Übersicht über Crustacea Decapoda. In: W. Michaelsen (ed.), Beiträge zur Kenntnis der Meeresfauna Westafrikas, pp. 69-110. Friederichsen and Co., Hamburg. Corgos, A. 2004. Estrategia vital, estructura espacial y dinámica poblacional de la centolla, Maja squinado (Decapoda: Majidae). PhD Thesis. Departamento de Bioloxía Animal, Bioloxía Vexetal e Ecoloxía. Universidade de A Coruña. Costa, F.O., deWaard, J.R., Boutillier, J., Ratnasingham, S., Dooh, R.T., Hajibabaei, M., Hebert, P.D.N. 2007. Biological identifications through DNA barcodes: the case of the Crustacea. Can J Fish Aquat Sci 64: 272-295. Folmer, O., Black, M., Hoeh, W., Lutz, R., Vrijenhoek, R. 1994. DNA primers for amplification of mitochondrial cytochrome c oxidase subunit I from diverse metazoan invertebrates. Mol Mar Biol Biotech 3: 294-299. Freire, J., Bernárdez, C., Corgos, A., Fernández, L., González-Gurriarán, E., Sampedro, M.P., Verísimo, P. 2002. Management strategies for sustainable invertebrate fisheries in coastal ecosystems of Galicia (NW Spain). Aquat Ecol 36: 41-50. Freire, J., Carabel, S., Verísimo, P., Bernárdez, C., Fernández, L. 2009. Patterns of juvenile habitat use by the spider crab Maja brachydactyla as revealed by stable isotope analyses. Sci Mar 73: 39-49. González-Gurriarán, E., Fernández, L., Freire, J., Muiño, R. 1998. Mating and role of seminal receptacles in the reproductive biology of the spider crab Maja squinado (Decapoda: Majidae). J Exp Mar Biol Ecol 220: 269-285. Hall, T.A. 1999. Bioedit: a user-friendly biological sequence alignment editor and analysis program for Windows 95/98/NT. Nucl Acids Symp Ser 41: 95-98. Herbst, J.F. 1788. Versuch einer Naturgeschichte der Krabben und Krebse nebst einer systematischen Beschreibung ihrer verschiedenen Arten. Lange H.A. (Ed.). pp. 207-238. Berlin und Stralsund. Inoue, N., Watanabe, H., Kojima, S., Sekiguchi, H. 2007. Population structure of Japanese lobster Panulirus japonicas inferred by nucleotide sequence analysis of mitochondrial COI gene. Fish Sci 73: 550-556.. 19.
(24) Final Project – Lucía Gato Calvo 2013 Khamnamtong, B., Klinbunga, S., Menasveta, P. 2009. Genetic diversity and geographic differentiation of the giant tiger shrimp (Penaeus monodon) in Thailand analyzed by mitochondrial COI sequences. Biochem Genet 47: 42-55. Larkin, M.A., Blackshields, G., Brown, N.P., Chenna, R., McGettigan, P.A., McWilliam, H., Valentin, F., Wallace, I.M., Wilm, A., López, R., Thompson, J.D., Gibson, T.J., Higgins, D.G. 2007. Clustal W and Clustal X version 2.0. Bioinformatics 23: 2947-2948. Lavery, S., Moritz, C., Fielder, D.R. 1996. Indo-Pacific population structure and evolutionary history of the coconut crab Birgus latro. Mol Ecol 5: 557-570. Librado, P., Rozas, J. 2009. DnaSP v5: a software for comprehensive analysis of DNA polymorphism data. Bioinformatics 25: 1451-1452. Matzen da Silva, J., Creer, S., dos Santos, A., Costa, A.C., Cunha, M.R., Costa, F.O., Carvalho, G.R. 2011. Systematic and evolutionary insights derived from mtDNA COI Barcode Diversity in the Decapoda (Crustacea: Malacostraca). PLoS ONE 6: e19449. Neumann, V. 1998. A review of the Maja squinado (Crustacea: Decapoda: Brachyura) speciescomplex with a key to the eastern Atlantic and Mediterranean species of the genus. J Nat Hist 32: 1667-1684. Ng, P.K.L., Guinot, D., Davie, P.J.F. 2008. Systema Brachyurorum: part I. An annotated checklist of extant brachyuran crabs of the world. Raffles B Zool 17: 1-286. Palumbi, S.R., Martin, A., Romano, S., McMillan, W.O., Stice, L., Grabowski, G. 1991. The simple fool’s guide to PCR, Version 2.0. Department of Zoology, University of Hawaii, Honolulu. Posada, D., Crandall, K.A. 1998. Modeltest: testing the model of DNA substitution. Bioinformatics 14: 817-818. Radulovici, A.E., Sainte-Marie, B., Dufresne, F. 2009. DNA barcoding of marine crustaceans from the Estuary and Gulf of St Lawrence: a regional-scale approach. Mol Ecol Resour 9: 181-187. Rotlland, G., González-Gurriarán, E., Fernández, L., Benhalima, K., Ribes, E. 2007. Ovarian maturation of the multi-spawning spider crab Maja brachydactyla (Decapoda: Majidae) with special reference to yolk formation. Mar Biol 152: 383-394. Schubart, C.D. 2009. Mitochondrial DNA and decapod phylogenies: the importance of pseudogenes and primer optimization. In: Martin JW, Crandall KA & Felder DL (Eds.), Crustacean Issues 18: Decapod Crustacen Phylogenetics, pp. 47-65. Boca Raton, Florida: Taylor & Francis/CRC Press. Sotelo, G., Morán, P., Posada, D. 2008a. Genetic identification of the northeastern Atlantic spiny spider crab as Maja brachydactyla Balss, 1992. J Crustacean Biol 28: 76-81.. 20.
(25) Final Project – Lucía Gato Calvo 2013 Sotelo, G., Morán, P., Fernández, L., Posada, D. 2008b. Genetic variation of the spiny spider crab Maja brachydactyla in the northeastern Atlantic. Mar Ecol Prog Ser 362: 211-223. Sotelo, G., Morán, P., Posada, D. 2009a. Molecular phylogeny and biogeographic history of the European Maja spider crabs (Decapoda, Majidae). Mol Phylogenet Evol 53: 314-319. Sotelo, G. 2009b. Phylogeography of the Galician crabs Necora puber and Maja brachydactyla in the NE Atlantic. PhD Thesis. Departamento de Bioquímica, Genética e Inmunología. Universidad de Vigo. Stamatis, C., Triantafyllidis, A., Moutou, K.A., Mamuris, Z. 2004. Mitochondrial DNA variation in northeast Atlantic and Mediterranean populations of Norway lobster, Nephrops norvegicus. Mol Ecol 13: 1377-1390. Tamura, K. 1992. Estimation of the number of nucleotide substitutions when there are strong transition-transversion and G+C content biases. Mol Biol Evol 9: 678-687. Tamura, K., Peterson, D., Peterson, N., Stecher, G., Nei, M., Kumar, S. 2011. MEGA5: Molecular Evolutionary Genetic Analysis using maximum likelihood, evolutionary distance and maximum parsimony methods. Mol Biol Evol 28: 2731-2739. Trontelj, P., Machino, Y., Sket, B. 2005. Phylogenetic and phylogeographic relationships in the crayfish genus Austropotamobius inferred from mitochondrial COI gene sequences. Mol Phylogenet Evol 34: 212-226.. 21.
(26)
Figure


+2

Documento similar
Although some public journalism schools aim for greater social diversity in their student selection, as in the case of the Institute of Journalism of Bordeaux, it should be
In the “big picture” perspective of the recent years that we have described in Brazil, Spain, Portugal and Puerto Rico there are some similarities and important differences,
ABSTRACT Transformation of the Specialized Knowledge of Future Primary Teachers on Fraction Division
From the phenomenology associated with contexts (C.1), for the statement of task T 1.1 , the future teachers use their knowledge of situations of the personal
Keywords: Metal mining conflicts, political ecology, politics of scale, environmental justice movement, social multi-criteria evaluation, consultations, Latin
Díaz Soto has raised the point about banning religious garb in the ―public space.‖ He states, ―for example, in most Spanish public Universities, there is a Catholic chapel
teriza por dos factores, que vienen a determinar la especial responsabilidad que incumbe al Tribunal de Justicia en esta materia: de un lado, la inexistencia, en el
Plotinus draws on Plato’s Symposium (206c4–5) – “procreate in what is beautiful” – 3 in order to affirm that mixed love (which is also a love of beauty) is fecund, although
In the preparation of this report, the Venice Commission has relied on the comments of its rapporteurs; its recently adopted Report on Respect for Democracy, Human Rights and the Rule
