TítuloEconomic Analysis of Supply Functions, Private Returns to Investment in Education and Skill Mismatch in Egypt
15
0
0
Texto completo
(2) Marwa Shibl Biltagy / European Journal of Government and Economics 8(1), June 2019, 81-95. levels of crime, high levels of democracy and high levels of political participation. These kinds of externalities are too difficult to be measured; accordingly, the returns to investment in education are underestimated. Furthermore, Becker (1994) assumes that there are two kinds of schooling costs; namely, direct and indirect costs. The direct costs consist of costs of teachers, administration staff, books, and other fees. The foregone earnings while in school represent the indirect costs of schooling. He assumes that the direct costs of schooling can be estimated easily. However, foregone earnings are too difficult to be estimated. The main objective of this paper is to estimate the demand and supply functions for schooling in Egypt, using the data of the Egypt Labor Market Panel Survey 2012 (ELMPS 2012). The methodology is based on the Mincerian estimation of the earnings-schooling model. It can be said that individuals invest in schooling until the marginal rate of return to schooling equals the discounting rate of interest. This paper is organized as follows; the second part surveys the related literature review. The third section presents the data description and the theoretical framework of the marginal rate of return and supply functions for schooling. Part four proposes the empirical model, estimation and the results and fifth part concludes.. 2. Literature Review The issue of the rate of return to education has dominated research in the area of economics of education for the last several decades based on the work of Schultz (1961) and Becker (1962). More precisely, the concept of human capital was first introduced by Mincer (1958) and then elaborated by two Nobel Prize winners, Schultz (1961) and Becker (1962). It emphasizes that people get information and skills by education and on-the-job training to increase their earnings in the future. Caudill and Mixon (2012) stated that people increase their investment in human capital when the returns on other types of capital decrease. The private rate of return to education can be estimated by two methods; either by the internal rate of return to education or by the Mincerian earnings function, introduced initially by Mincer (1974). The internal rate of return is called the full or elaborate method of estimating the demand functions of schooling. It can be defined as the discount rate that equates the net present value of schooling for an individual at a given point of time. Psacharopoulos (1994) presented a survey, which included the results related to estimating the rate of return to education for about 70 countries. The rate of return to education is particularly high when the supply of educated labor is rather scarce. Psacharopoulos (1994) and Psacharopoulos and Patrinos (2002) concluded that primary education yields a higher rate of return than other advanced stages of schooling since the expansion of primary education, in particular, reduces the. 82.
(3) Marwa Shibl Biltagy / European Journal of Government and Economics 8(1), June 2019, 81-95. level of income inequality. Also, education may create more job opportunities and hence decreases the rate of unemployment. Moreover, in general, private rates of return are higher than social rates of return because education has large impacts on earnings, employment in addition to non-market private effects. Menzies et al. (2000) stated that there is a kind of spillover from the individual investment in human capital (i.e. education) into the social level. These kinds of externalities are too difficult to be measured; accordingly, the social return to investment in education is usually underestimated. Ashenfelter and Rouse (1998) estimated a model of schooling investment using data on 700 identical twins. The empirical results indicated that higher ability individuals reach more schooling levels because of the advantage of lower marginal costs. The estimated model implies that genetically identical individuals have the same levels of schooling investment. The results suggested that the rate of return to schooling is about 9%. Moreover, it is concluded that, the marginal benefits of schooling decrease with the attainment of higher levels of education and there is a negative relationship between the level of ability and the marginal costs of schooling. Regan et al. (2006) derived the demand and supply functions of schooling using data from the National Longitudinal Survey of Youth 1979 (NLSY79). The authors estimated the demand and supply functions for schooling depending on the earnings-schooling relationship. According to the analysis of Regan et al. (2006), individuals invest in schooling until the marginal rate of return to schooling equals the discounting rate of interest. The results of estimating these equations specified that the discounting rates of interest are lower for individuals from wealthier families. Moreover, the results showed that individuals with higher ability pass through school faster. The estimation of the model indicated that the marginal rate of return to schooling is 9.6 % per year. Gasparini et al. (2011) analyzed the wage differentials and trends in the demand and supply of employees by educational level for some countries in Latin America over the decades of the 1990s and the 2000s. They explained the decline in income inequality in the specified countries by the labor force educational improvement. The authors found that the demand factors are more powerful than the supply factors in explaining the decrease in wage premia for tertiary educated individuals. Furthermore, they clarified that the change in labor demand can be attributed to some factors, such as, preferring the low skilled workforce in some industries, technological transmission or skill mismatch that may reduce the labor productivity of highly-educated people. Psacharopoulos and Patrinos (2018) highlighted the newest developments of returns to investment in education based on human capital theory depending on a record of 139 countries. They emphasized that the yearly private average global rate of return to one extra year of schooling is about 9%. They argued that private returns to higher education have increased over time and females continue to have higher average rates of return to schooling. Moreover, the returns to education are higher in developing countries.. 83.
(4) Marwa Shibl Biltagy / European Journal of Government and Economics 8(1), June 2019, 81-95. 3. Skill mismatch: some important facts Educational institutions become a source of human resource development. However, the educational sector in Egypt faces many difficulties and challenges. Among the challenges facing educational institutions is the issue of incompatibility between outputs of higher education on the one hand and the requirements of the labor market on the other, which resulted in the existence of large numbers of graduates without work (high rates of unemployment). The relationship between the outputs of the educational process and the requirements of the labor market is one of the strategic issues that affect the development in Egypt in terms of its negative repercussions on the unemployment rates, labor productivity and structural imbalances experienced by labor markets in Egypt. The problem of unemployment in the Egyptian economy can be explained not only by the quantitative gap between the size of educational outputs and available job opportunities but also by the failure of educational institutions to prepare graduates capable of responding to the requirements of the labor markets and competition at local and international levels. 1. The reasons for the gap between the outputs of higher education and the requirements of the labor market (Biltagy, 2013). Education policies and plans are adopted without taking into account the suitability of these plans and policies for the requirements of the labor market, which contributed to the existence of a real gap. For example, when the labor market is saturated with a number of disciplines such as legal and commercial studies, higher education institutions still accept large numbers of students in these disciplines, which causes unemployment amongst university graduates. Moreover, the current curricula and courses are among the reasons that led to the incompatibility between the requirements of the labor market and the outputs of the educational process. The difficulty of addressing the problem of rising unemployment rates among young graduates and low levels of labor productivity is a multidimensional issue. The determination of the size of employment opportunities and their sectoral and vocational distribution is mainly based on the package of economic and social policies contained in development plans and reform programs. Thus, employment opportunities are based on economic growth rates, income distribution issues, investment trends, social welfare levels, and export development policy. The outputs of the educational process are based on the objectives of providing basic education for the largest number of population, increasing the enrollment rates in education, quality assurance and accreditation policies, stimulating the demand for technical education and diversifying the disciplines, in order to achieve the desired structural balance in the supply of educational services. Accordingly, a comprehensive study of the link between supply forces and demand trends in the labor market is necessary. In addition to the above, the mismatch between supply and demand in the labor market reflects. 84.
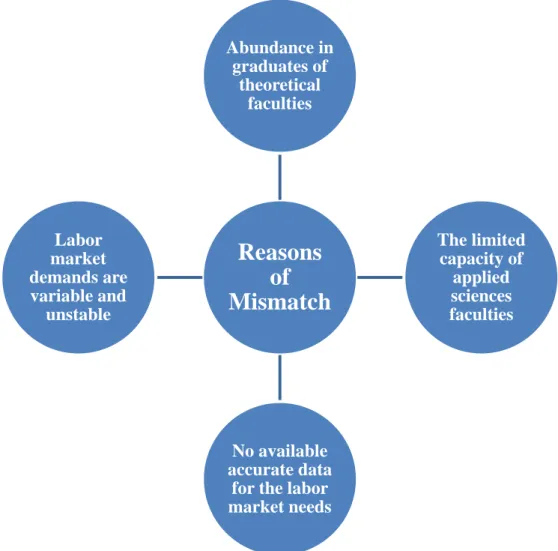
(5) Marwa Shibl Biltagy / European Journal of Government and Economics 8(1), June 2019, 81-95. a number of factors, including the inability of many university graduates to obtain a job opportunity in the fields they studied, particularly graduates of law, commercial and agricultural studies. Furthermore, employers require graduates with technical knowledge in the field of work, and who also have initial communication skills, teamwork, problem solving and adaptability to the work environment. It is important to enhance the curriculum, provide advanced practical training and reconsider the student admission policy in higher educational institutions, to keep pace with the dynamics of labor markets and to formulate a distinct personality for the student. It can be said that technical factors are among the most important aspects in the inadequacy of university graduates for the requirements of the labor market, such as poor English language, lack of computer knowledge, lack of expertise, and weak analytical abilities. As for higher education patterns, some theoretical disciplines in university education, whose graduates suffer from the absence of suitable employment opportunities in both the public and private sectors, should be reduced. Figure 1 illustrates some of the difficulties facing higher education institutions.. Abundance in graduates of theoretical faculties. Labor market demands are variable and unstable. Reasons of Mismatch. The limited capacity of applied sciences faculties. No available accurate data for the labor market needs. Figure 1: Some difficulties facing higher education institutions in achieving the needed alignment with the labor market. Source: Own elaboration based on the Survey of IDSC, 2012.. 85.
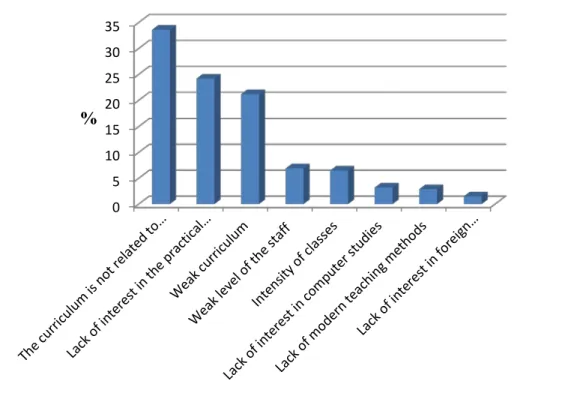
(6) Marwa Shibl Biltagy / European Journal of Government and Economics 8(1), June 2019, 81-95. The graduates of social and human sciences reached 78.1% of total graduates in 2010/2011 i.e. the graduates of faculties of commerce, arts and law represented 28.9%, 21.1% and 16.7%, respectively of the total graduates (the survey of the incompatibility of university graduates' skills and labor market requirements for commercial, legal and agricultural studies, 2012). The following figure illustrates the main reasons for the discrepancy between the outputs of education and the requirements of the labor market, according to the views of graduates.. 35 30 25. %. 20 15 10 5 0. Figure 2: The percentage distribution of the causes of imbalances in the educational system. Source: Own elaboration based on the Survey of IDSC, 2012.. In summary, the main causes of imbalances and skill mismatch in the Egyptian educational system are, the low internal efficiency of educational institutions, due to the curricula and the type of tests that depend mainly on memorization, in addition to low quantitative and qualitative external efficiency, represented in the graduation of huge numbers of graduates in disciplines not needed by the labor market, with a deficit in other specialties. 2. Suggested strategies to achieve the desired alignment between educational institutions and labor market requirements Strategy 1: To develop the main elements of the educational process in terms of objectives, curriculum, content, practical experiences, advanced assessment methods and the educational environment through:. 86.
(7) Marwa Shibl Biltagy / European Journal of Government and Economics 8(1), June 2019, 81-95. •. Reviewing the policy of students’ admission in universities.. •. Conducting a comprehensive study of the needs of the labor market and then arranging specialties according to its importance and applicability.. •. Appraising existing educational frameworks and developing new policies to provide students with a range of social, personal and technical skills that help them join the productive labor market.. •. Expanding the use of modern and advanced teaching techniques, focusing on computer skills and proficiency in foreign languages.. •. Providing appropriate educational buildings and achieving the principle of equal opportunities in education for all students in different geographical regions.. •. Linking educational institutions with advanced educational research centers in order to develop curricula according to the needs of the labor market.. •. Increasing the orientation of students towards the required scientific disciplines in the labor market.. Strategy 2: Prepare a teacher adapted to the needs of the labor market by: •. Updating the systems of preparing the teacher, in order to improve his professional and social level and enable him to acquire knowledge and skills in various scientific fields.. •. It is not sufficient to focus only on the mental skills of the students, but it is important to take into consideration the emotional side, including values and principles. This depends on the good model of the lecturer.. Strategy 3: Provide the necessary funding resources for the development of the educational institutions through (Biltagy, 2015): •. Adopting certain policies to increase the government financial resources directed to the educational sector.. •. Increasing the participation of civil society and businesspeople in support of government efforts.. •. Rationalizing the principle of free education for all, rich and poor.. •. Related to higher education, it is useful to transfer Egyptian universities to the model of productive universities, by transforming their academic units into productive research units in various fields of work and services.. •. Funding technical education and vocational training, partly by governments, but most of the funding must come from the beneficiaries, which would give them an important role in preparing study programs and training to meet the requirements of the labor market.. 87.
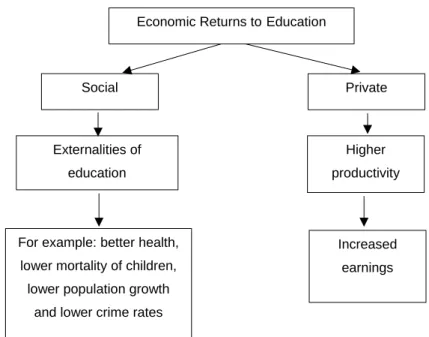
(8) Marwa Shibl Biltagy / European Journal of Government and Economics 8(1), June 2019, 81-95. 4. Marginal rate of return and supply functions for schooling: theoretical framework and data description As mentioned above, there are two kinds of economic rate of return to schooling, i.e. social and private. It is more difficult to estimate the social rate of return to education because of the 1. complexity of capturing and calculating the externalities of education . However, the relation between education and increased earnings is explained in the literature, depending on the Mincerian earnings function. Figure (3) provides a general overview of the economic returns to education.. Economic Returns to Education. Social. Private. Externalities of. Higher. education. productivity. For example: better health,. Increased. lower mortality of children,. earnings. lower population growth and lower crime rates. Figure 3: Economic Rate of Return to Education. Source: Own elaboration based on Becker (1962).. The social rate of return to schooling includes public expenditure on education, in addition to the private cost considered for the calculation of the private rate of return. Accordingly, the social rate of return takes into consideration the total cost of education. In general, the social rate of return is higher in primary education, if compared to secondary and higher education because public expenditure per student tends to increase significantly with the level of education. The analysis is conducted using the Egypt Labor Market Panel Survey 2012 (ELMPS 2012). The ELMPS 2012 is the third round of the longitudinal survey, which was also done in 1998 and 2006. The ELMPS was presented by the Economic Research Forum (ERF) in cooperation with the Central Agency for Public Mobilization and Statistics (CAPMAS) in Egypt. The ELMPS 2012 intends. 1. Foster and Rosenzweig (1995) ascertain that there are positive externalities of education on other people in the neighborhood in addition to the externalities on the educated individual’s own family.. 88.
(9) Marwa Shibl Biltagy / European Journal of Government and Economics 8(1), June 2019, 81-95. to analyze the characteristics of the Egyptian labor market. It is considered as a follow-up survey to the same households that were interviewed in 2006, in addition to a new sample, which was selected from a random sample to participate in the survey, to be able to analyze the evolution of the labor market in Egypt over time. For the purpose of this study, the size of the total sample is 7573 observations. The sample contains waged workers whose ages range from 15 to 64 years. Those individuals answer all the questions needed for the estimation of basic earnings function and the supply functions for schooling. This section includes the descriptive statistics of all variables used in the model together with a brief description of each variable. Table 1 presents the variables, which are used in estimating the demand and supply functions for schooling as follows, •. Age: The age ranges from 15 to 64 years old; the mean value of age is 36.7 years.. •. W: This variable refers to the total wage of the individual. The minimum and maximum values of the total wage in this sample are 240 and 54000 Egyptian pounds per month, respectively and the mean value is L.E. 3545 per month.. •. S: The variable S represents the number of years of schooling of an individual. The mean value of this variable is 11.8 years. The variable S takes values between 0 and 16, where the value 0 refers to illiterates and the value 16 refers to the university 2. education . •. Experience (T): This variable stands for the number of years of experience. The mean value of this variable is 16.24 years.. •. FSL: This variable symbolizes the father’s schooling level. The mean value of this variable is roughly 6 years; similarly, MSL corresponds to the mother’s schooling level. The mean value of this variable is around 3 years.. •. N: This variable represents the family size. The variable N is used in estimating the supply function for schooling. The mean value of this variable is approximately 5 persons.. It can be noticed from Table 1 that, the percentage of males in the sample is 77.2% while the percentage of females is 22.8%. In addition, the table ascertains that 78% of the individuals in the sample used are married and 56% of those individuals live in urban areas. Furthermore, 57% of the individuals in the sample used are employed in government and public enterprises. Moreover, the average number of working days is roughly 6 days per week and the average number of working hours is 8.35 hours per day.. 2 This paper follows the study of Bratsberg and Terrell (2002) in defining the variable of the number of years of schooling.. 89.
(10) Marwa Shibl Biltagy / European Journal of Government and Economics 8(1), June 2019, 81-95. Table 1: Descriptive Statistics of the Variables Variable. No. of Observations. Mean 36.7. Std. Dev.. Min. 10.87. Max. Age. 7573. 15. 64. Gender. 7573. 0.772. 0.419. 0. 1. W. 7573. 3545.3. 3675.5. 240. 54000. S. 7573. 11.79. 4.47. 0. 16. SS. 7573. 159.2. 81.44. 0. 256. Experience. 7573. 16.24. 11.17. 0. 58. Urban/Rural. 7573. 0.56. 0.49. 0. 1. Marital Status. 7573. 0.78. 0.42. 0. 1. Sector of emp.. 7573. 0.57. 0.49. 0. 1. N. of days/w. 7573. 5.70. 0.84. 1. 7. N. of hours/day. 7573. 8.35. 2.28. 1. 24. N. 7573. 4.45. 1.82. 1. 21. FSL. 7573. 5.58. 5.63. 0. 20. MSL. 7573. 2.91. 4.84. 0. 20. Source: Own elaboration based on ELMPS 2012.. 5. Empirical Model, Estimation and Results This paper derives the demand and supply functions for schooling depending on the earnings3. schooling relationship . It can be said that individuals invest in schooling until the marginal rate of return to schooling equals the discounting rate of interest. The study considers individuals who earned approximately 300 Egyptian pounds per month. The dependent variable in the log earnings function is the log of an individual's total wage. The marginal rate of return to schooling is,. δ =. ∂ ln W , ∂S. [1]. where. δ j = f (Sj).. [2]. and S is the number of years of schooling for an individual. This implies that the first derivative of the log earnings function with respect to schooling yields an individual’s demand function for schooling, i.e. the rate of return to education (the demand function for schooling) is a function in the number of years of schooling. The previous studies, such as, Schultz (1989), Ashenfelter and Krueger (1994), Glewwe (1996), Menzies et al. (2000) and Boero et al. (2003) ascertained that the earnings of an individual depend. 3. The empirical framework follows Mincer’s estimation of the schooling model.. 90.
(11) Marwa Shibl Biltagy / European Journal of Government and Economics 8(1), June 2019, 81-95. on many other factors, for example, whether an individual lives in urban or rural areas, whether he or she works in the government sector or private sector. In addition, the earnings differ depending on gender differences. Moreover, the previous studies showed that earnings differ from one person to another, depending on the number of working days per week and the number of working hours per day. The earnings also depend on the marital status of an individual; that is, marriage makes individuals more productive. The following earnings function considers all these factors.. ln W j = θ 0 + θ1 S j + θ 2T j + θ 3T j2 + θ 4 X ′ + u1 j ,. [3]. where T signifies the number of years of experience, X represents a vector of variables that affects the earnings of an individual and u1 is ∼ iid N (0, σ 1 ). The results of the estimation of this function 2. are illustrated in Table 2. Any individual seeks to maximize the present value of his/her lifetime earnings over time, and it can be represented by the log form as follows,. 𝑃𝑃 = 𝑙𝑙𝑙𝑙𝑙𝑙 − 𝑖𝑖𝑖𝑖 − 𝑙𝑙𝑙𝑙𝑙𝑙. [4]. where P is the present value of lifetime earnings and i is the discounting rate of interest. The following first-order condition can be obtained by taking derivatives with respect to S,. δ= i.. [5]. An individual’s supply function for schooling investment can be derived by using the present value function as defined in [4]. The discounting rate of interest can be defined as a function of an individual’s family characteristics (i.e. family income levels and family size). The individual's supply function for schooling can be written as,. i j = β 0 + β1 S fj + β 2 S mj + β 3 N j + u 2 j , where. [6]. S f and S m are the levels of father's and mother's schooling, N denotes the family size and. u2 is ∼ iid N (0,. σ 22 ). In equation [6], the family income levels can be represented by the schooling. levels of an individual's parents. As shown in Table 2, it is estimated that the private rate of return to education is 4.5% per year, noting that, private rate of return to education = (exp coefficient – 1) * 100. Moreover, the rate of return to the number of years of experience is 2.6% i.e. each additional year of experience will increase the earnings of an individual by 2.6% on average. Since θ3 is negative, the earnings will increase over time by decreasing rate.. 91.
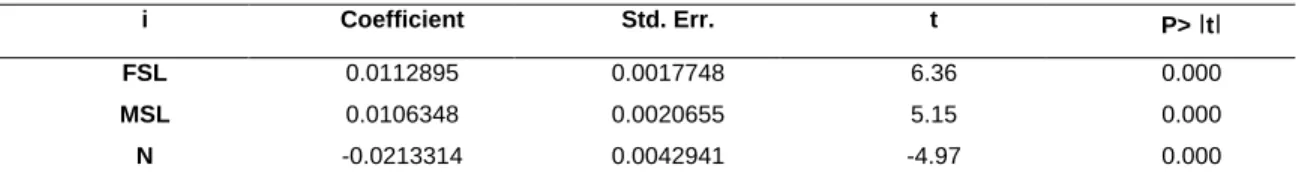
(12) Marwa Shibl Biltagy / European Journal of Government and Economics 8(1), June 2019, 81-95. Table 2: The Results of Estimation of Earnings Function lnW. Coefficient. Std. Err.. t. P> ׀t׀. S. 0.0442086. 0.0018834. 23.47. 0.000. Experience. 0.0262104. 0.0023612. 11.10. 0.000. ExpExp. -0.0002842. 0.0000549. -5.18. 0.000. Gender. 0.2554301. 0.0189975. 13.45. 0.000. Marital status. 0.1105411. 0.0196645. 5.62. 0.000. Urban/Rural. 0.1927933. 0.0149652. 12.88. 0.000. Sector of emp.. 0.0099666. 0.0175634. 0.57. 0.570. N. of days/week. -0.0104486. 0.0088547. -1.18. 0.238. N. of hours/day. 0.0270247. 0.0034664. 7.80. 0.000. cons. 6.513099. 0.0708414. 91.94. 0.000. Source: Author’s calculations based on ELMPS 2012.. Gender has a significant effect on the earnings of an individual. This means that males get more monthly earnings than females by 29.1% on average. Furthermore, keeping other factors constant, the individual who lives in urban areas gains more earnings than the one who lives in rural areas by 21.3%. The marital status of an individual plays a significant role in determining his/ her earnings. The married individual gets more earnings than a single person by 11.7%. In addition, the results show that, at 5% significance level, the variable of the sector of employment is insignificant, while working for long hours per day is associated with higher levels of earnings for an individual. As mentioned above, the supply function for schooling (the discounting rate of interest for individual j, ij) is a function in an individual's family characteristics. The results of the estimation of the supply function for schooling are demonstrated in Table 3.. Table 3: The Results of Estimation of Supply Functions for Schooling i. Coefficient. Std. Err.. t. P> ׀t׀. FSL. 0.0112895. 0.0017748. 6.36. 0.000. MSL. 0.0106348. 0.0020655. 5.15. 0.000. N. -0.0213314. 0.0042941. -4.97. 0.000. Source: Author’s calculations based on ELMPS 2012.. Table 3 shows that the variables that represent the family income (FSL and MSL) and the family size, N are significant at a 5% significance level. The supply function for schooling, i, can vary among individuals, for example, the discounting rate of interest would be higher for individuals from poor families. The same could be said for individuals from larger families as compared to individuals from smaller families. There is an indirect effect of family income on the discounting rate of interest of an individual via financial aid, then; individuals from poor families have an increased likelihood of receiving financial aid, which decreases their discounting rate of interest.. 92.
(13) Marwa Shibl Biltagy / European Journal of Government and Economics 8(1), June 2019, 81-95. 6. Conclusions and policy recommendations There is a positive relationship between the number of years of schooling and the private rate of return to schooling. It is estimated that the private rate of return to education is 4.5%. The results ascertain that working in urban areas is associated with more earnings for an individual. Moreover, married individuals get more earnings because they are more productive. The model proved that, the main independent variable that is contained in the individual's demand function for schooling is the number of years of schooling, S. On the other hand, the main independent variables that are included in the individual's supply function for schooling in Egypt are: the father's schooling level (FSL), the mother's schooling level (MSL) and the family size (N). The best possible schooling level is determined when the demand and supply functions for schooling are equal. The rate of return to education is considered one of the most important determinants in the decision-making process of investment in education. Egypt should reallocate its public resources in favor of education, especially the primary stage. Government expenditure on education has grown remarkably during the past few years. The amount of the government's budget directed to education increased from L.E. 40 billion in 2009/10 to L.E. 64.5 billion in 2012/13. Moreover, the budget in 2014/15 assigned L.E. 94 billion and 355 million to the education sector with an increase of L.E. 11 billion, compared to the amount devoted to education in 2013/14 (MOF, 2014). In 2016/2017, the state public expenditure on education was L.E. 103 billion and 962 million, which represents 10.7% of the state total public expenditure (Egypt in Figures, 2018). The participation of the private sector and civil society is also important in developing the education sector in Egypt. Moreover, it is essential to put controls on the huge population increase in Egypt because of the direct relationship between the family size and the discounting rate of interest. This paper demonstrates that family background factors are fundamental in determining the education decisions. This coincides with Coleman (1966). He showed that family background factors are very crucial in explaining different levels of academic achievement among individuals. Accordingly, it is important to increase the level of schooling of an individual's parents and to increase the real income of the family because there is a positive relationship between the family income levels and the level of schooling.. Acknowledgments This work has benefited from a financial grant from Euro-Mediterranean Network for Economic Studies (EMNES), financially supported by the European Commission.. 93.
(14) Marwa Shibl Biltagy / European Journal of Government and Economics 8(1), June 2019, 81-95. References Ashenfelter, O. & Krueger., A. (1994). Estimates of the Economic Return of Schooling from a New Sample of Twins, American Economic Review, 84(5). Ashenfelter, O. & Rouse. C. (1998). Income, Schooling and Ability: Evidence from a New Sample of Identical Twins, Quarterly Journal of Economics, 113(1). doi: https://doi.org/10.3386/w6106 Becker, G. (1962). Investment in Human Capital: A Theoretical Analysis, Journal of Political Economy, 70. doi: https://doi.org/10.1086/258724 Becker, G. (1994). Human Capital: a Theoretical and Empirical Analysis, with Special Reference to Education, (3rd ed.), Chicago, University of Chicago Press. doi:. https://doi.org/10.7208/chicago/9780226041223.001.0001 Biltagy, M. (2013). The Skills Required for Higher Education Graduates to Join the Labor Market, Policy Paper Presented to the Egyptian Cabinet, Information and Decision Support Center (IDSC). Biltagy, M. (2015). Financing Higher Education in Egypt: Problems and Suggested Alternatives, FEPS Journal, Journal of Faculty of Economics and Political Science, Cairo University, 16(3). Boero, R., M. Castellani, & Squazzoni, F. (2003). Labor Market, Entrepreneurship and Human Capital in Industrial Districts. An Agent-Based Prototype. Proceedings of the Wild@Ace Workshop, Turin, Italy. doi: https://doi.org/10.1142/9789812702258_0016 Bratsberg, B. and D. Terrell. (2002). School Quality and Returns to Education of U.S. Immigrants, Economic Inquiry, 40(2). doi: https://doi.org/10.1093/ei/40.2.177 CAPMAS. Central Agency for Public Mobilization and Statistics. (2018). Egypt in Figures, Arab Republic of Egypt. Caudill, S. & Mixon. F. (2012). Human Capital Investment and the Internment of Japanese Americans during WWII: A Public Choice Approach, International Journal of Applied Economics, 9(1). Coleman, J. (1966). Equality of educational Opportunity. Washington, D.C.: U.S. Government Printing Office. ELMPS. (2012). Egypt Labor Market Panel Survey. CAPMAS and Economic Research Forum. Foster, A. & Rosenzweig. M. 1995. Learning by Doing and Learning from Others: Human Capital and Technical Change in Agriculture, Journal of Political Economy, 103(6). doi:. https://doi.org/10.1086/601447 Gasparini, L., S. Galiani, G. Cruces Acosta, P. (2011). Educational Upgrading and Returns to Skills in Latin America: Evidence from a Supply-Demand Framework, 1990-2010, IZA DP No. 6244. doi: https://doi.org/10.1596/1813-9450-5921 Glewwe, P. (1996). The Relevance of Standard Estimates of Rates of Return to Schooling for Education Policy: A Critical Assessment, Journal of Development Economics, 51(2). doi:. 94.
(15) Marwa Shibl Biltagy / European Journal of Government and Economics 8(1), June 2019, 81-95. https://doi.org/10.1016/S0304-3878(96)00415-4 IDSC, Information and Decision Support Center, Egyptian Council of Ministers. (2012). The incompatibility of university graduates' skills and labor market requirements for commercial, legal and agricultural studies, Cairo. Lucas, R. (1988). On the Mechanics of Economic Development, Journal of Monetary Economics, 22, 3-42. doi: https://doi.org/10.1016/0304-3932(88)90168-7 Menzies, M., H. Barwick & Link, V. (2000). Scholarships, Fellowships and Human Capital Formation in National Innovation Systems. Ministry of Research Science and Technology, New Zealand. Mincer, J. (1958). Investment in Human Capital and Personal Income Distribution, Journal of Political Economy, 66. doi: https://doi.org/10.1086/258055 Mincer, J. (1974). Schooling, Experience, and Earnings. National Bureau of Economic Research, New York. MOF. (2014). Ministry of Finance, Statistical Report, The State’s General Budget, 2014/2015. Psacharopoulos, G. (1994). Returns to Investment in Education: A Global Update, World Development, 22(9). doi: https://doi.org/10.1016/0305-750X(94)90007-8 Psacharopoulos, G. & Patrinos, H,. A. (2002). Returns to Investment in Education: A Further Update. World Bank Policy Research Working Paper, No. 2881. Psacharopoulos, G. and Patrinos, H,. A. (2018). Returns to Investment in Education: A Decennial Review of the Global Literature. World Bank, Policy Research Working Paper, No. 8402. doi:. https://doi.org/10.1596/1813-9450-8402 Regan, L., G. Burghardt & Oaxaca, R. (2006). A Human Capital Model of the Effects of Abilities and Family Background on Optimal Schooling Levels. Institute for the Study of Labor, IZA. Schultz, T. (1961). Investment in Human Capital, American Economic Review, 51(1) Schultz, T. (1989). Returns to Women’s Education, PHRWD background paper 89/001, World Bank: Population, Health, and Nutrition Department, Washington DC.. 95.
(16)
Figure

+2
Documento similar