A&A 586, A52 (2016)
DOI:10.1051/0004-6361/201527507 c
ESO 2016
Astronomy
&
Astrophysics
The
Gaia-ESO Survey: Stellar radii in the young open clusters
NGC 2264, NGC 2547, and NGC 2516
,
R. J. Jackson
1, R. D. Je
ff
ries
1, S. Randich
2, A. Bragaglia
3, G. Carraro
4, M. T. Costado
5, E. Flaccomio
6,
A. C. Lanzafame
7, C. Lardo
8, L. Monaco
9, L. Morbidelli
2, R. Smiljanic
10, and S. Zaggia
111 Astrophysics Group, Keele University, Keele, Staffordshire ST5 5BG, UK
e-mail:[email protected]
2 INAF–Osservatorio Astrofisico di Arcetri, Largo E. Fermi 5, 50125 Florence, Italy
3 INAF–Osservatorio Astronomico di Bologna, via Ranzani 1, 40127 Bologna, Italy
4 European Southern Observatory, Alonso de Cordova 3107 Vitacura, Santiago de Chile, Chile
5 Instituto de Astrofísica de Andalucía-CSIC, Apdo. 3004, 18080 Granada, Spain
6 INAF–Osservatorio Astronomico di Palermo, Piazza del Parlamento 1, 90134 Palermo, Italy
7 Dipartimento di Fisica e Astronomia, Sezione AstrofiFsica, Università di Catania, via S. Sofia 78, 95123 Catania, Italy
8 Astrophysics Research Institute, Liverpool John Moores University, 146 Brownlow Hill, Liverpool L3 5RF, UK
9 Departamento de Ciencias Físicas, Universidad Andrés Bello, República 220, 837-0134 Santiago, Chile
10 Department for Astrophysics, Nicolaus Copernicus Astronomical Center, ul. Rabia´nska 8, 87-100 Toru´n, Poland
11 INAF–Padova Observatory, Vicolo dell’Osservatorio 5, 35122 Padova, Italy
Received 6 October 2015/Accepted 17 November 2015
ABSTRACT
Context.Rapidly rotating, low-mass members of eclipsing binary systems have measured radii that are significantly larger than pre-dicted by standard evolutionary models. It has been proposed that magnetic activity is responsible for this radius inflation.
Aims.By estimating the radii of low-mass stars in three young clusters (NGC 2264, NGC 2547, NGC 2516, with ages of∼5,∼35 and∼140 Myr respectively), we aim to establish whether similar radius inflation is seen in single, magnetically active stars.
Methods.We use radial velocities from theGaia-ESO Survey (GES) and published photometry to establish cluster membership and then combine GES measurements of projected equatorial velocities with published rotation periods to estimate the average radii for groups of fast-rotating cluster members as a function of their luminosity and age. The average radii are compared with the predictions of both standard evolutionary models and variants that include magnetic inhibition of convection and starspots.
Results.At a given luminosity, the stellar radii in NGC 2516 and NGC 2547 are larger than predicted by standard evolutionary models at the ages of these clusters. The discrepancy is least pronounced and not significant (10 per cent) in zero age main se-quence stars with radiative cores, but more significant in lower-mass, fully convective pre main-sese-quence cluster members, reaching
30±10 per cent. The uncertain age and distance of NGC 2264 preclude a reliable determination of any discrepancy for its members. Conclusions.The median radii we have estimated for low-mass fully convective stars in the older clusters are inconsistent (at the 2–3σ level) with non-magnetic evolutionary models and more consistent with models that incorporate the effects of magnetic fields or dark starspots. The available models suggest this requires either surface magnetic fields exceeding 2.5 kG, spots that block about 30 per cent of the photospheric flux, or a more moderate combination of both.
Key words.stars: rotation – stars: low-mass – stars: activity – open clusters and associations: individual: NGC 2264 –
open clusters and associations: individual: NGC 2547 – open clusters and associations: individual: NGC 2516
1. Introduction
1.1. The radii of low-mass stars
The radius of a star is one of its most fundamental properties, that ought to be correctly predicted by stellar models. Yet precise measurements of K- and M-dwarfs in eclipsing binary systems have shown that, for a given mass, the radii of stars with 0.2 <
M/M<0.8 are 10–15 per cent larger than predicted by current evolutionary models. Hence, for a given luminosity, the effective
Based on observations collected with the FLAMES spectrograph at
VLT/UT2 telescope (Paranal Observatory, ESO, Chile), for theGaia -ESO Large Public Survey (188.B-3002).
Full Tables 1 and 3 are only available at the CDS via anonymous
ftp tocdsarc.u-strasbg.fr(130.79.128.5) or via
http://cdsarc.u-strasbg.fr/viz-bin/qcat?J/A+A/586/A52
temperature can be underestimated by up to 7.5 per cent (e.g. López-Morales2007; Morales et al.2009; Torres et al.2010).
Stars in these short-period, tidally locked binaries are fast-rotating and highly magnetically active; a working hypothesis is that the larger radii are caused either by the suppression of convection by interior, dynamo-generated magnetic fields (e.g. Mullan & MacDonald 2001; Chabrier et al. 2007; Feiden & Chaboyer2012,2013), or by the blocking of flux at the surface by cool, magnetic starspots (Chabrier et al. 2007; Macdonald & Mullan2012; Jackson & Jeffries2014b). Similarly high lev-els of rotation and magnetic activity are also a characteris-tic of young, low-mass stars. If rotationally induced magnecharacteris-tic fields or starspots do affect the radii of fast rotating stars, then this could significantly alter the masses and ages inferred for such objects from their locations in the Hertzprung-Russell di-agram, change estimates of the radii and hence densities of any
transiting exoplanets that are discovered around them and alter the age-dependence of lithium depletion in their photospheres (Jackson & Jeffries2014a; Somers & Pinsonneault2014,2015). A suspicion remains however, that the oversized radii could be directly connected with the close binary nature of the eclips-ing stars for which precise radii and masses are available. Tidal synchronisation could modify internal rotation profiles, convec-tion patterns and magnetic activity. If an inflated radius really is a consequence of rotation/magnetic activity and not just bi-narity, then a simple test is that rapidly rotating, single K- and M-dwarfs should also be bigger than both inactive stars and the model predictions. Although the masses of single stars are inac-cessible, it is possible to measure their radii as a function lumi-nosity. Interferometric techniques have been used to determine radii for nearby K- and M-dwarfs with an estimated mass range of 0.3 < M/M < 0.8 (Boyajian et al. 2012). Unfortunately, almost all these nearby stars are magnetically inactive, so the radius-luminosity relation that can be derived is applicable to relatively old, slow-rotating, main sequence (MS) stars. This re-lationship shows satisfactory agreement with the predicted radii of evolutionary models (e.g. Baraffe et al. 1998; Dotter et al. 2008) for K- and early M-dwarfs, but later M-dwarfs (spectral types beyond M2) show lower effective temperatures than pre-dicted by evolutionary models (Veeder 1974), with current mod-els underestimating radii by∼5 per cent (Boyajian et al.2012).
Extending this comparison to magnetically active, single, low-mass stars is difficult since there are none close enough to allow precise interferometric radius measurements. Instead Jackson et al. (2009) and Jackson & Jeffries (2014b) have used the product of individual rotation periods (P) and pro-jected equatorial velocities (vsini) to estimate projected stellar radii (Rsini). Assuming random axial orientations, such mea-surements can provide average radii for groups of stars. The technique has been applied as a function of luminosity in two young open clusters (NGC 2516 and the Pleiades). Jackson & Jeffries (2014b) found that the highly magnetically active K-and M-dwarfs in these clusters (aged130 Myr – Meynet et al. 1993) showed significant radius inflation relative to the empiri-cal locus defined by inactive MS field stars; the mean increase in radius, at a given luminosity, ranges from 13±3 per cent for MS K-dwarfs to 40±4 per cent for the lower luminosity pre main-sequence (PMS) M-dwarfs that are still descending their fully convective Hayashi tracks.
1.2. The Gaia-ESO survey
TheGaia-ESO survey (GES) is employing the FLAMES multi-object spectrograph (Pasquini et al. 2002) on the VLT UT-2 (Kueyen) telescope to obtain high quality, uniformly calibrated spectroscopy of>105stars in the Milky Way over a 5 year period (Gilmore et al.2012; Randich & Gilmore 2013). The survey, which began at the end of 2011, includes stars from the halo, bulge, thick and thin discs, as well as in star forming regions and clusters of all ages. Samples are chosen from photometric surveys with the aim of characterizing the chemical and kine-matic evolution of these populations. Analysis of these spectra will provide a rich dataset of chemical and dynamical parame-ters which, when combined with proper motions and parallaxes from theGaiasatellite, will provide full three-dimensional ve-locities and chemistry for a large and representative sample of stars.
In addition to radial velocity (RV) data, the GES measures thevsiniof target stars (Koposov et al., in prep.). In the case of young clusters, RV can be used to confirm cluster membership
andvsinidata can be combined with published measurements of rotation periods to estimate theRsinivalues for members of the cluster (e.g. Baxter et al.2009; Jackson et al.2009). As the GES progresses the opportunity arises to estimate the radii of both MS and PMS stars for a number of clusters, where rotation period data are available, using uniformly derived and calibrated values ofvsini. By determining the radii of low-mass stars as a function of their luminosity in clusters of different ages, we can test evo-lutionary models, search for the signatures of radius inflation by magnetic activity and investigate if there is any dependence on whether stars have reached the zero age main sequence (ZAMS) (e.g. see Jackson & Jeffries2014b).
In this paper we use GES data to estimate the average radii for stars in three young clusters – NGC 2516, NGC 2547 and NGC 2264. In Sect. 2 we describe the clusters and our database and use the RV of spectroscopic targets to assign cluster mem-bership. In Sect. 3 we use thevsinivalues of confirmed cluster members with known periods to determine average radii as a function of luminosity. Finally, in Sect. 4 we compare the radius data for each of the three clusters with the radii as a function of luminosity and age predicted by different evolutionary mod-els, some of which include the effects of magnetic fields and starspots.
2. Cluster members and their projected rotation velocities
2.1. Cluster properties
NGC 2516 is the oldest of the three clusters considered in this paper. Meynet et al. (1993) give an age of 141 Myr. This is con-sistent with more recent estimates of age of 150 Myr from lithium depletion in low mass stars (Jeffries et al. 1998) and 125±25 Myr from the nuclear turn offfor high mass stars (Lyra et al.2006). We adopt the intrinsic distance modulus of 7.93± 0.14 mag and cluster reddening ofE(B−V)=0.12±0.02 mag given by Terndrup et al. (2002) based on main sequence fitting.
NGC 2547 is a younger cluster and our dataset may be ex-pected to contain both PMS and ZAMS stars . We adopt an age of 35±3 Myr based on lithium depletion (Jeffries & Oliveira 2005). This is consistent with the age of 38.5+3.5−6.5Myr found from main sequence fitting by Naylor & Jeffries (2006), who also give an intrinsic distance modulus of 7.79+−0.050.11mag and reddening of
E(B−V)=0.12±0.05 mag.
NGC 2264 is the youngest cluster considered here with an estimated age of 2–7 Myr depending, amongst other things, on the adopted distance to the cluster, which varies between 400 pc (Dzib et al.2014) and 913 pc (Baxter et al.2009). In this pa-per we adopt the distance 777±12 pc given by Turner (2012) based on model isochrone fitting. This is consistent with a dis-tance of 760±49 pc from fitting the ZAMS (Sung et al.1997) and the parallax-based distance of 738±45 pc obtained from two maser sources thought to be located in NGC 2264 (Kamezaki et al.2013). Having adopted the distance given by Turner (2012) we also adopt their average reddening ofE(B−V) =0.075± 0.003 mag and age of∼5.5 Myr. We note that at best this age represents a median value; Sung & Bessell 2010) estimate an age spread of 2–3 Myr about the median age.
Table 1. Photometric and spectroscopic data of GES Survey targets in clusters in NGC 2547, NGC 2516, NGC 22264 downloaded from the Edinburgh GES archive.
Cluster Object IC J2MASS H2MASS K2MASS S/N RV vsini logTeff No. ΔRV Δvsini
mag mag mag mag km s−1 km s−1 Spec km s−1
NGC 2264 06392497+0933151 15.26 13.84 13.28 13.06 8.72 31.10 4.3 3.552 2 0.54 0.66
NGC 2264 06392506+0942515 14.26 13.21 12.48 12.36 15.02 20.08 1.1 3.560 2 0.36 1.43
NGC 2264 06392535+0943147 13.74 12.05 11.19 10.90 19.39 –7.64 1.6 3.712 2 0.36 4.31
NGC 2264 06392550+0931394 15.32 13.77 12.86 12.38 27.40 17.98 4.7 3.544 2 0.29 0.23
NGC 2264 06392649+0943298 15.56 13.94 13.26 12.98 23.86 15.30 19.8 3.770 2 0.63 0.09
NGC 2264 06393939+0945215 13.97 12.90 12.04 11.54 55.61 20.18 11.8 3.621 4 0.21 0.05
NGC 2264 06393961+0945442 13.03 11.98 11.37 11.18 52.77 43.60 1.6 3.610 4 0.22 1.22
Notes.No. Spec indicates the number of separate observations co-added to produce the target spectrum;ΔRVandΔvsini are calculated values of the absolute precision in RV and fractional precision invsini, as described in Sect. 2.2. The full Table1is available at the CDS.
2.2. Cluster targets with resolved projected equatorial velocities
Targets in these clusters were observed at the VLT on a num-ber of dates between April 2012 and Decemnum-ber 2013. The tar-gets were selected using a combination of optical and infrared photometry and chosen using very broad regions of colour– magnitude space, so as to target all possible cluster members (or at least make them available for fibre placement – see Bragaglia et al., in prep.). The raw spectroscopic data were processed with pipelines developed at the Cambridge Astronomical Survey Unit, to produce wavelength-calibrated, sky-subtracted spectra and estimates of RV and vsini (Lewis et al; Koposov et al., in prep.). These were passed to spectroscopic analysis work-ing groups (e.g. Lanzafame et al. 2015), which estimated astro-physical parameters (logg,Teff) and chemical abundances for a subset of the targets with high quality spectra. The resulting data and parameters were placed in the GES archive (and made available to the GES consortium) at the Wide Field Astronomy Unit at Edinburgh University1. Data used in this paper is taken from tables Target, Spectrum, RecommendedAstroAnalysis and SpectrumNightly of the iDR2/iDR3 release of GES data.
All the relevant photometry and spectroscopic data for GES survey targets in NGC 2516, NGC 2547 and NGC 2264, were taken from the Edinburgh GES archive. The database contains RV andvsini values derived from the analysis of both indi-vidual spectra (termed nightly spectra) and combined spectra – where all available nightly spectra are co-added to produce a single target spectrum. All the results reported here are given for combined spectra observed with the intermediate resolution GIRAFFE spectrograph, using order sorting filter HR15N which gives a spectral wavelength range of 6445–6815 Å at a resolu-tion of 17 000. The targets lie in the brightness range of approx-imately 11 < V < 19 for all three clusters. The optical pho-tometry originates from Jeffries et al. (2001) and Irwin et al. (2007) for NGC 2516; from Naylor et al. (2002), Jeffries et al. (2004) and Irwin et al. (2008) for NGC 2547; and from Sung et al. (2008) for NGC 2264. 2MASS near infrared photometry is available for all targets (Skrutskie et al.2006).
The uncertainties in RV andvsiniwere estimated, as a func-tion of temperature,vsiniand S/N, using the scaling parame-tersΔRV andΔvsini, the prescription defined by Jackson et al.
(2015)2, and with the constants shown in Table3of their paper that are appropriate for order sorting filter HR15N. These scaling
1 http://ges/roe.ac.uk/
2 Note that Δ
RV is expressed as an absolute uncertainty in km s−1, whereasΔvsini is a dimensionless fractional precision – see Jackson et al. (2015) for details.
Table 2.Cluster properties and target numbers.
NGC 2516 NGC 2547 NGC 2264
Age (Myr) 141 35 5.5
(m−M)0 7.93 7.79 9.45
E(B−V) (mag) 0.12 0.12 0.075
AK(mag) 0.04 0.04 0.02
No. of targets observed 743 450 1707
No. potential membersa 618 376 1525
No. membersb 459 156 350 (604)
Targets with Known period 77 84 226
Members withRsinic 32 45 90 (157)
Notes. (a) WithS/N > 5, valid I-mag, K-mag and logg > 3.5 (if known);(b)based on the probability of membership from the RV being
>0.8;(c)member with known period,vsini>5 km s−1andΔv
sini<0.2;
Nos. in brackets are for relaxed membership criteria, see Sect. 2.4.
parameters approximate to the standard deviations for a normal distribution, but Jackson et al. showed that the underlying un-certainty distributions have extended tails and are better repre-sented by Student’s t-distributions with νdegrees of freedom, whereν=6 for RV andν =2 forvsini. The intrinsic spectral resolution of the data means that there is an effective resolution limit tovsini, such that only objects withvsini>5 km s−1have reliably detected rotation. Data downloaded from the Edinburgh GES archive including calculated values of the RV andvsini
precision for each target are listed in Table1, the full version of which is available at CDS.
Targets for each cluster were selected initially from the database as having both validIandK-magnitudes and a signal to noise ratio (S/N) of the combined spectra S/N > 5. Where possible, a further selection was made on the basis of surface gravity to remove field red giants (with logg < 3.5) from the sample. Estimates of logg were available from the Working Group (WG) analyses for 99 per cent of targets in NGC 2516 but only∼15 per cent of targets in the other two clusters. The numbers of potential targets are shown in Table2.
2.3. Target mass and luminosity
2MASS magnitudes of the targets in Table1were transformed to the CIT system using relations given by Carpenter (2001) then scaled to absolute magnitudes using the distance moduli and extinctions shown in Table2(assuming that the targets are members of the cluster). Luminosities of targets in NGC 2547 and NGC 2516 were estimated from targetMKvalues using the
1*& 1*& 1*&
1X
PEHU
SH
UEL
Q
1XPE
HU
SHU
ELQ
1X
PEHU
SH
UEL
Q
59NPV 59NPV 59NPV
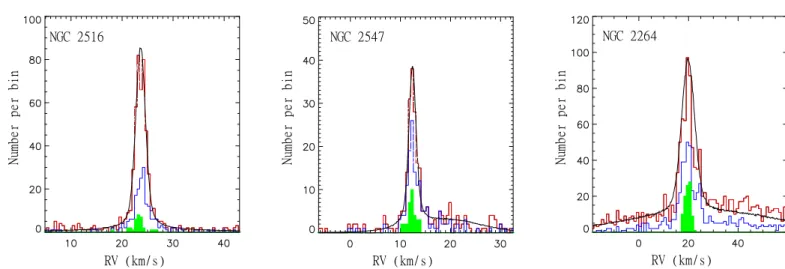
Fig. 1.Number density of GES cluster targets in open clusters NGC 2516, NGC 2547 and NGC 2264 as a function of RV. the upper (red) histograms show all potential members withS/N>5. The lower (blue) histograms show the number of faster rotators (vsini>5 km s−1) and the solid (green) histograms show stars identified as cluster members with measured rotation periods (see Sect. 3.1). The black curve shows the probability density fit to the measured data comprising of the sum of two quasi-Gaussian distributions; the first, a narrower distribution, represents cluster members, and a second much broader distribution represents non-members.
BHAC15 model isochrones (Baraffe et al.2015) interpolated to the cluster age. Masses were estimated from luminosities us-ing the same models. Luminosities in NGC 2264 were estimated fromMJvalues using the bolometic correction as a function of
(I−J) colour in order to minimise possible effects of any infra-red excess due to circumstellar discs which may still be present in this relatively young cluster.
2.4. Probability of membership
Figure1shows histograms of the RV of potential members for each clusters. Results are shown separately for (a) all potential members; and (b) those with avsini>5 km s−1. The latter group of relatively rapidly rotating stars have a higher probability of cluster membership, since older field stars are more likely to be slower rotators.
A maximum likelihood method was used to determine the probability of cluster membership as a function of RV by fitting a pair of quasi-Gaussian distributions to the data for each star. The first distribution defines cluster members, the second much broader distribution represents the background population. Each probability density function is the convolution of a Gaussian pro-file with the distribution of measurement uncertainty incorporat-ing the combined effects of measurement precision and the pro-jected orbital velocities of an estimated fraction of binary stars (see Cottaar et al.2012; Jeffries et al.2014).
For the present calculation.
– The measurement uncertainty in RV of individual targets is defined as a Student-t distribution withν=6 scaled accord-ing to the scalaccord-ing constant for measurement precisionΔRV (see Jackson et al.2015).
– Binary periods are assumed to follow the log normal distri-bution described by Raghavan et al. (2010) withlogP =
5.03 andσlogP =2.28, wherePis the period in days. – The binary fraction varies with mass as fb = 0.27 +
0.47(M/M) over the range 0.2 < M/M < 1.2. This re-lationship, estimated from the binary fraction as a function of mass given by Jeffries et al. (2001) for NGC 2516, is assumed to apply to all three clusters here.
– The binary mass ratio is represented by a flat distribution be-tween 0.1 and 1 and the eccentricity by a uniform probability density between 0 and 0.8 (Raghavan et al.2010).
– Targets outside the range±20 km s−1 of the cluster central velocity are assumed to be non-members and are excluded from the calculation. A range of±40 km s−1 is adopted for NGC 2264, which appears to have a much broader intrinsic distribution.
Figure1shows the maximum likelihood fit of the number den-sity of targets as a function of RV for each cluster. Figure2 shows the probability of membership as a function of RV for each star, which is calculated from the ratio of likelihoods that a target belongs to the cluster or field populations. This depends strongly on RV and more weakly on the RV measurement uncer-tainty. Note that the intrinsic dispersions of the clusters quoted in Fig.1are upper limits to the true dispersion. There is some ev-idence for mass-dependence in the dispersion and for a small (probably unphysical) mass-dependent systematic drift in RV which inflates the dispersion seen in a group covering a wide mass range. This is more carefully analysed in Jeffries et al. (in prep.), however the accuracy obtained using a single mass bin is easily sufficient for the current purpose of estimating the probability of cluster membership.
NGC 2516 shows an RV distribution characteristic of a re-laxed cluster, centred at 23.6 ±0.1 km s−1, with an intrinsic dispersion≤0.79±0.07 km s−1. There are 459 targets with a membership probability>0.8, about half of which havevsini>
5 km s−1. In the rest of the paper we conservatively consider this subset of stars where determining Rsini values. This sample should suffer a low level of contamination by field stars, espe-cially when we combine the RV membership probabilities with the likelihood of havingvsini >5 km s−1and the likelihood of having a measurement of their rotation periods from rotational modulation (see Sect. 3.1).
1*& 1*& 1*&
Fig. 2.Probability of cluster membership as a function of RV for open clusters NGC 2516, NGC 2547 and NGC 2264 derived from the maximum likelihood fit of a double quasi-Gaussian distribution to the data in Fig.1. Black crosses show probabilities for slower rotators (vsini≤5 km s−1), red triangles show probabilities for faster rotators. Estimated values of the mean velocity, RV and dispersionσcof the cluster population are shown on the plots.
equivalent width of the Li
i
6708 Å line to identify the pres-ence of a kinematically distinct, younger population in the line of sight towards NGC 2547, centred at RV∼19 km s−1. For our analysis we select only members of the main cluster and find 156 targets with membership probability>0.8,∼75 per cent of which havevsini>5 km s−1.NGC 2264 shows a broader peak in its RV distribution, with extended tails containing a large fraction of fast rotating stars. This is consistent with NGC 2264 being understood as a loose collection of star-forming clumps rather than as a single, dis-tinct, strongly bound cluster (Tobin et al.2015). This leads us to consider two membership samples, the first where cluster mem-bers are those associated with the peak in the RV distribution at 19.8±0.2 km s−1, giving 339 members with membership prob-ability>0.8, and a second where all 604 fast rotating stars with
vsini>5 km s−1 and−20<RV<60 km s−1 are considered to be potential cluster members.
2.5. Comparison of v sin i with other work
Both the precision and accuracy of the vsini measurements are important in estimating theRsinidistributions for stars in these clusters. The precision of thevsinimeasurements is es-timated from an empirical analysis of repeat measurements of
vsinirecorded as part of the GES project (Jackson et al.2015). However, such measurements give no indication of the abso-lute accuracy of the measurements, which is a combination of the uncertainty in measurement and the uncertainty in absolute calibration.
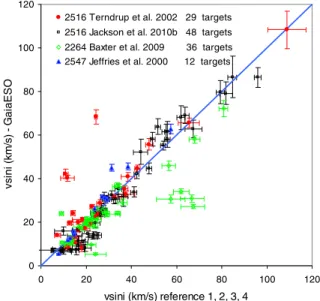
To assess the calibration uncertainty, GES vsini measure-ments were compared with previously reported measuremeasure-ments for the same targets in NGC 2516 (Terndrup et al. 1998; Jackson & Jeffries2010b), NGC 2547 (Jeffries et al.2000) and NGC 2264 (Baxter et al. 2009). Figure 3 compares measured and reported values ofvsinifor 125 targets where both sources showedvsini>5 km s−1. The uncertainties shown for the GES data areΔvsini (see Sect. 2.2). The uncertainties in the reported
values,σvsiniare taken from the source papers.
There is a good correlation between the two data sets after accounting for the measurement precisions. However, there are a number of outliers where the difference between the two esti-mates ofvsiniis much greater than the expected uncertainty in
0
vsini (km/s) reference 1, 2, 3, 4
v
Fig. 3. Comparison of GES measurements of vsini in NGC 2516, NGC 2547 and NGC 2264 with previously reported values. The insert shows the numbers of targets per cluster where matches were found with reported data.
the difference of the two values. To some extent this is expected since, at least for the GES data the measurement uncertainty is described by a Student-t distribution (withν= 2) rather than a Gaussian distribution. To eliminate these outliers the compara-tive data is clipped such that the discrepancy between the two measurements must be less than 5 times its uncertainty, which is equivalent to selecting data between the 8th and 92nd percentiles of a Student’s t-distribution with ν = 2. Linear regression of the clipped data then yields the following relation between the
vsinireported in the GES database and previously the reported values (vsiniref):
vsini=[−0.71±0.64]+[1.01±0.02]vsiniref. (1)
A
b
so
lu
te
I
m
agn
it
ud
e
Colour (I-K)0
Ab
so
lu
te
I
m
agnit
u
d
e
Colour (I-K)0
Ab
so
lu
te
I
m
agnit
u
d
e
Colour (I-K)0
Fig. 4.AbsoluteI-magnitude versus intrinsicI−Kfor GES targets in the open clusters NGC 2516, NGC 2547 and NGC 2264 using the cluster parameters shown in Table2. Points show all GES targets (with spectra that haveS/N>5). Black crosses show stars with reported periods that are cluster members based on their RV (see Sect. 2.3) withvsini>5 km s−1, red triangles show other GES targets with reported periods. Lines show solar metallicity model isochrones interpolated to the cluster age for different evolutionary models, see Sect. 4.1, solid line – BHAC15 (Baraffe et al.2015), blue dotted line – Dartmouth (Dotter et al.2008), blue dashed line – , Dartmouth modified for magnetic fields (Feiden & Chaboyer 2013).
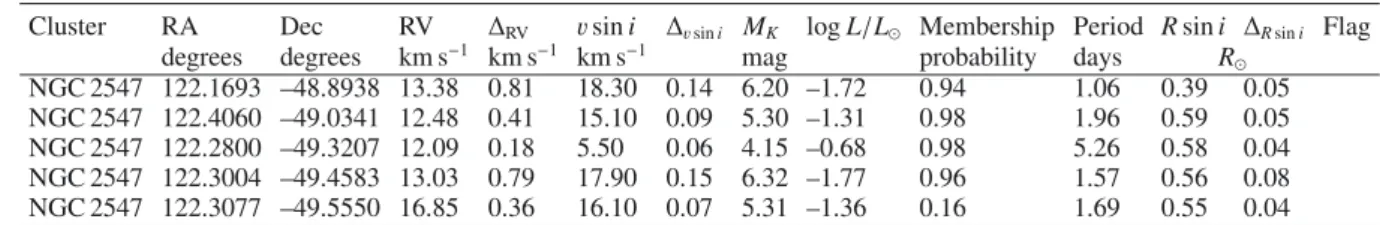
Table 3.Measured and calculated properties of cluster targets with resolvedvsiniand a reported rotation period.
Cluster RA Dec RV ΔRV vsini Δvsini MK logL/L Membership Period Rsini ΔRsini Flag
degrees degrees km s−1 km s−1 km s−1 mag probability days R
NGC 2547 122.1693 –48.8938 13.38 0.81 18.30 0.14 6.20 –1.72 0.94 1.06 0.39 0.05 NGC 2547 122.4060 –49.0341 12.48 0.41 15.10 0.09 5.30 –1.31 0.98 1.96 0.59 0.05 NGC 2547 122.2800 –49.3207 12.09 0.18 5.50 0.06 4.15 –0.68 0.98 5.26 0.58 0.04 NGC 2547 122.3004 –49.4583 13.03 0.79 17.90 0.15 6.32 –1.77 0.96 1.57 0.56 0.08 NGC 2547 122.3077 –49.5550 16.85 0.36 16.10 0.07 5.31 –1.36 0.16 1.69 0.55 0.04
Notes.NoteRsinivalues are shown only wherevsini>5 km s−1andΔv
sini <0.2 whereΔvsiniis the relative uncertainty invsiniFlag is set to 1 for targets in cluster NGC 2264 where a (H−K) colour versus (J−H) colour plot indicates possible infra-red excess. The full Table3is available at the CDS.
targets – usually≥5 per cent unless a target is observed on mul-tiple occasions.
3. Mean radii of cluster members
3.1. Targets with measured rotation period
Projected radii,Rsini, are calculated for the samples of probable members defined in Sect. 2.4 that also havevsini > 5 km s−1 and a reported rotation period in the literature. We also demand a high qualityvsinimeasurement, withΔvsini<0.2.
All three clusters have been the subject of photometric sur-veys that attempted to measure the rotation periods of low mass cluster members via the rotational modulation caused by magnetic activity and starspots. Irwin et al. (2007) found peri-ods for 362 stars in NGC 2516 over the mass range (estimated from MK using the BHAC15 models) 0.15 < M/M < 0.7.
Cross correlation with the GES target list showed 77 matches, 32 of which are both members (based on their RV) and have
vsini > 5 km s−1 andΔvsini < 0.2. Irwin et al. (2008) found
rotation periods for 176 stars in NGC 2547 over the mass range 0.1 <M/M <0.9, 84 were matched with GES targets and 45 of these are RV members with high qualityvsinimeasurements. Makidon et al. (2004), Lamm et al. (2004) and Affer et al. (2013) measured rotational periods in NGC 2264 over the approximate mass range 0.1<M/M<2.5, yielding 226 matches with GES
targets, 90 of which are RV members with high qualityvsini
measurements (or 149 if we take the broader definition of cluster membership in Sect. 2.4).
Figure 4 shows MI vs. (I − K)0 colour magnitude plots3 of the GES targets for each cluster, highlighting targets for whichRsinihas been calculated. Also shown are solar metal-licity isochrones interpolated according to the logarithm of clus-ter age for three different evolutionary models. The BHAC15 models (Baraffe et al.2015), Dartmouth models (Dotter et al. 2008) and a modified version of the Dartmouth code that in-cludes magnetic fields (Feiden & Chaboyer2013; Feiden et al. 2015, see Sect. 4.1). The (I−K) colour of targets in NGC 2516 and NGC 2547 are somewhat redder than the non-magnetic BHAC15/Dartmouth isochrones and are possibly better repre-sented by the magnetic Dartmouth models. However, this may also partly be due to unresolved binaries in the sample, or could simply reflect the fact that the BHAC15 models do appear to pre-dictI−K colours that are∼0.2 too blue atMI ∼8 (see Fig.5
in BHAC15). Results for NGC 2264 show much more scatter in colour vs. magnitude for both the GES targets and the subset of members with measured rotation period. This could be due to the presence of circumstellar material, accretion, differential
3 This colour–magnitude diagram was chosen asIandKmagnitudes
log L/L
log L/L
O
v
er-r
adi
us
%
Radius
(R
)
log L/L
log L/L
O
v
er-r
adi
us
%
R
adius
(
R
)
log L/L
log L/L
O
v
er-r
adi
us
%
Radius
(R
)
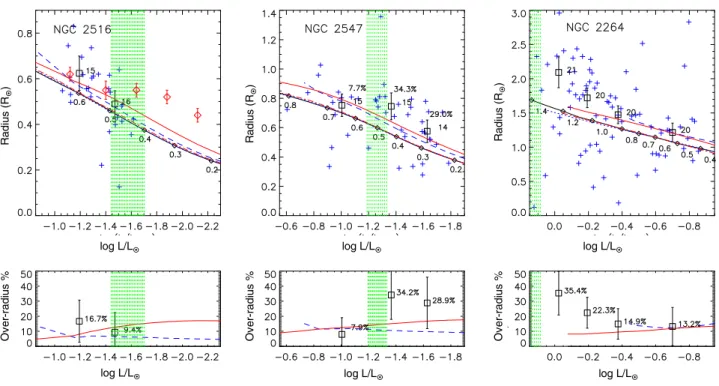
Fig. 5.Stellar radius versus luminosity for stars in the open clusters NGC 2516, NGC 2547, NGC 2264. Crosses in theupper plotsshow theRsini
of individual targets normalised by the average value of sini(see Sect. 3.2). Squares with error bars show the averaged radii in bins of luminosity; adjacent numbers indicating the numbers of targets per bin. Diamonds with error bars show averaged radii (calculated in a similar way) from an alternate data set in NGC 2516 from Jackson et al. (2009). Lines show solar metallicity model isochrones ofRversus logLinterpolated to the cluster ages in Table2from several evolutionary models (see Sect. 4.1): the black solid line (with circles indicating fiducial mass points) – BHAC15 (Baraffe et al.2015), blue dotted line – Dartmouth (Dotter et al.2008), blue dashed – Dartmouth modified for magnetic fields (Feiden & Chaboyer 2013; Feiden et al.2015), red dot-dashed – YREC, and red solid line – YREC modified for an effective spot coverage of 30 per cent (Somers & Pinsonneault2015). The shaded area indicates the range of luminosities over which stars develop radiative cores according to the BHAC15 model. Stars to the left of this region have radiative cores, while stars to the right are fully convective. Thelower plotsshow the “over-radius”, expressed as a percentage of the predicted radius from the BHAC15 model. Dashed and solid lines show the over-radius, with respect to their non-magnetic counterparts, predicted by the Dartmouth-magnetic model and the YREC with starspots model respectively.
reddening or perhaps indicate some variation in the age of cluster members.
Filled histograms in Fig.1 show cluster members with re-solved values ofRsini, i.e. those targets which are cluster mem-bers with a measured rotation period, vsini > 5 km s−1 and Δvsini < 0.2. The median vsini of this subset is 30 km s−1
for NGC 2516, 20 km s−1 for NGC 2547 and 21 km s−1 for NGC 2264. Table3lists the measured and calculated properties of all valid targets withS/N>5 and measured rotation period.
3.2. Averaged radii as a function of luminosity
The averaged radii of stars is calculated from P and vsini
following the method described by Jeffries (2007). The prod-uct of these quantities gives the projected radii in solar units,
Rsini=0.02Pvsini, wherePis in days andvsiniis in km s−1. Assuming that the stellar spin axes are randomly oriented (e.g. Jackson & Jeffries2010a) then in principle the average radius can be found by dividing the averageRsinifor a group of simi-lar stars by an average value of sini.Rsiniestimates for cluster members are divided intoK magnitude (and later luminosity) bins with approximately equal numbers of targets per bin. The radius value for each bin,Ris calculated from the median value ofRsini per bin, which is then corrected for the inclinations based on a distribution of sinivalues and measurement uncer-tainties. Taking the median value ofRsiniis preferred over the mean, since it minimises the effects of the expected extended tail in the distribution ofvsiniuncertainties.
A Monte Carlo method was used to determine the correction to the median Rsini and the uncertainty in this correction. Samples of N individual Rsini values, with estimates of measurement precision, and a known probability distribution of siniwere simulated, under the assumption that the uncertainty in
Rsiniis dominated byΔvsini(see Sect. 2.1 and Table3). It is
fur-ther assumed that the stellar spin axes are randomly distributed but thatRsinican only be resolved if sini > τ. The reason for this threshold is that stars with low inclinations do not exhibit sufficient rotational modulation to enable a rotation period de-termination or do not have sufficient equatorial velocity to yield a resolvablevsini.
Random values of sini were drawn from the distribution
P(i) = sini/cos(arcsinτ) whereτ < sini < 1. The value ofτ was estimated directly from the measured distribution ofRsini
values about the median value ofR in two absolute magnitude bins for each cluster (see Jackson et al.2009, for details). For the present data sets we find an averageτ=0.16±0.11, which corresponds to sini = 0.80 ± 0.02. (Note that the effect of τ is small, because relatively few stars have a low value of sini
in a random distribution of orientations.) Multiple realisations are modelled using the appropriate uncertainties for the dataset under consideration. The distribution of median values is then analysed to determine the value ofRand its uncertainty.
Table4shows the average radii,R, derived from theRsini
Table 4.Averaged values of stellar radii NGC 2516, NGC 2547, and NGC 2264 calculated from the product of GES measurements of
vsini and reported rotational periods, binned according to apparent
Kmagnitude.
Notes. (a) Averaged radii for members selected on RV with period,
vsini > 5 km s−1 and Δv
sini < 0.2; (b) Averaged radii for all targets with period,vsini>5 km s−1andΔv
sini <0.2.
are binned according toK magnitude with 15 to 20 targets per bin (or ∼33 if the wider membership criteria is adopted for NGC 2264) . In NGC 2547 and NGC 2516 a single outlier with an exceptionally smallK mag was excluded. The relationships betweenRand apparentK magnitude are model- and distance-independent and not affected by the estimated reddening to the cluster. Also shown in Table 4 are the model-, distance- and reddening-dependent average luminosity and mass per bin de-rived from BHAC15 model isochrones (Baraffe et al.2015) us-ing the cluster parameters shown in Table2.
The over-radius of a set of targets relative to an evolution-ary model is calculated as the median value of the over-radii of individual targets relative to the model radii at equivalent lumi-nosity, corrected for the effects of inclination and measurement uncertainties using the same Monte-Carlo model.
3.3. Measurement accuracy
The uncertainty inRand in over-radius depends on the number of targets. A simple estimate of the expected uncertainty is given by considering the ideal case where the uncertainties inPand
vsiniare small compared to the uncertainty in the mean value of sini, which (in the absence of a lower cut off) has a mean value ofπ/4±0.22/√N where N is the number of targets per bin. Hence the minimum uncertainty inRforN=15 is∼7 per cent, and would reduce to 3 per cent forN = 100. The estimates of uncertainty inR shown in Table4, from Monte Carlo sim-ulations, also take account of the measurement errors invsini
and the non Gaussian distribution of sini(see Sect. 3.2), giving average uncertainties of∼12 per cent for our bin occupancies of 14<N<34.
The procedure described in Sect. 3.2 gives an unbiased es-timate of R provided that P and vsini are themselves unbi-ased and the distribution of siniis modelled correctly. Hartman et al. (2010) pointed out that differential rotation may system-atically increase the measured values of P. However the rate of differential rotation is low for active K- and M- dwarfs (e.g. Reinhold et al.2013), and the effect of any positive bias inP pro-duced by differential rotation is offset by a corresponding neg-ative bias in measuredvsini. The net changes in inferred radii
using the method discussed here should be less than 1 per cent (see discussion in Jackson & Jeffries2014b). A second source of bias is uncertainty in the distribution of sini, in particular the effect of uncertainty in the lower cut offvalue,τ, below which
Rsinivalues cannot be obtained. However, the large uncertainty inτgiven in Sect 3.2 corresponds to only a 2 per cent system-atic error in siniandRand so is much less important than the statistical uncertainties.
A further source of uncertainty could be contributed by tar-gets that are unresolved spectroscopic binaries. For some frac-tion of these targets, the measured values of vsini could be systematically higher than the true vsini of the primary star, depending on the difference in RVs of the primary and sec-ondary stars and their relative contribution to the GES spectra. This would lead to an upward bias in the estimate ofRsini. Appendix A presents an analysis of the effects of binarity on the measured value ofvsiniwhich is then used to estimate the in-crease inRsinifor individual observations assuming the binary distribution described in Sect. 2.4. Calculations of the averaged radii (Sect. 3.2) were repeated with a correction made for this binary bias inRsini. For NGC 2516 and NGC 2547 there was a small reduction (<2 per cent) in the averaged radii whilst for NGC 2264 the downward correction was higher at∼4 per cent, due to its more massive members that have a higher assumed bi-nary fraction. The bias caused by binarity is therefore not com-pletely negligible, but is still small compared to the statistical uncertainties for the current data set.
4. Discussion
4.1. Comparison with model isochrones
Figure5compares the measured radii, as a function of luminos-ity, with the predictions of three current evolutionary models, two of which have also been adapted to explicitly include the ef-fects of magnetic fields and activity on the evolution of low-mass stars. The models considered are:
1. The solar metallicity isochrones of R versus logL for the BHAC15 model (Baraffe et al. 2015), interpolated to the cluster ages in Table2. Open circles on the isochrones mark fiducial mass points.
2. The Dartmouth (Dotter et al.2008) and Dartmouth-magnetic models (Feiden & Chaboyer2013; Feiden et al.2015). The latter is a version of the Dartmouth evolutionary code mod-ified to take account of the effect of magnetic fields on the equation of state and on mixing length theory in the stellar interior of magnetically active stars. The isochrones shown here correspond to the rotational dynamo model of Feiden & Chaboyer (2013) with a surface field strength of 2.5 kG, as described in detail by Malo et al. (2014).
fields and/or starspots is to increase radii at a given luminos-ity, although the percentage increase in radius at a given field strength or spot coverage varies with both mass and age. This over-radius, expressed with respect to their non-magnetic coun-terpart models, is compared with our measurements of average radii with respect to the BHAC15 isochrones in the lower panels of Fig.5. The shaded areas in Fig.5indicate the range of lumi-nosities over which stars are expected to develop radiative cores according to the BHAC15 model at the assumed age of the clus-ters. i.e. stars to the left of the shaded area are expected to have radiative cores, stars to the right are expected to be fully con-vective and still be descending their Hayashi tracks. The width of these regions corresponds to±0.05M, the resolution of the model grids in our possession.
The percentage increase in radius shown by the Dartmouth-magnetic model with respect to non-magnetic models is smaller for the low-mass, fully convective stars. This is consistent with the results of Feiden & Chaboyer (2012, 2013) for MS stars, where magnetic inhibition of convection can produce significant inflation for stars with radiative cores but has less effect (for a given magnetic field strength) for fully convective stars. Starspots have the opposite effect, producing a larger radius inflation for fully-convective PMS stars. Jackson & Jeffries (2014b) used polytropic models to show that starspots slow stellar contraction along Hayashi tracks, asymptotically inflating the radii of PMS stars by a factor of (1−β)−ncompared
to unspotted stars of the same luminosity, where β is the equivalent covering fraction of dark starspots andn∼0.5. This is a much stronger inflation than predicted by Spruit & Weiss (1986) for spotted MS stars with the same β. The over-radius predicted for fully convective stars in NGC 2516 and NGC 2547 by the YREC-spot model with β = 0.3 (shown in Fig.5) is 15–18 per cent, which is fully consistent with the simple scaling derived from polytropic models.
4.2. NGC 2547
We consider this cluster first since we have data for both fully convective PMS stars and ZAMS stars with radiative cores. Figure5shows averaged radii for 44 targets divided into 3 bins, one to the left of the shaded area containing stars with radia-tive cores and two to the right, containing fully convecradia-tive stars on their Hayashi tracks. The average over-radius for the full sample, relative to the predictions of the BHAC15 model is 18±7 per cent. This result applies to cluster members having
>80 per cent probability of membership according to their RV (see Sect. 2.4). There are in addition 15 targets with measured
Rsini but<80 per cent membership probability (see Table3). This latter sample is expected to contain a significant propor-tion of stars from a secondary populapropor-tion identified by Sacco et al. (2015) as kinematically distinct and much younger than NGC 2547. Taking an age of∼10 Myr (Sacco et al.2015) and assumingR ∝ t−1/3 then the radius of any stars belonging to this younger population should be∼60 per cent larger than mem-bers of NGC 2547. The mean over-radius of these 15 targets is 45±21 per cent and thus consistent with a significant proportion belonging to the younger population identified by Sacco et al.
For NGC 2547 the highest luminosity bin in Fig.5, contain-ing stars with radiative cores, hasR compatible (within ∼1σ) with both magnetic and non-magnetic evolutionary models. The low-luminosity bins containing fully convective stars show sig-nificantly higher radii than predicted by the non-magnetic evo-lutionary models. The average over-radius for data in these
two lower mass bins is 29 ± 10 per cent compared to the BHAC15 isochrone. The possible systematic errors discussed in Sect. 3.2 associated with differential rotation, uncertainties in the threshold inclination for Rsini measurement or bina-rity, are small compared with the statistical uncertainties. There are additional systematic uncertainties due to possible errors in the assumed distance modulus, reddening and age. These ef-fects are also small for NGC 2547 where the combined uncer-tainty in (m− M)0 and E(B−V) leads to an uncertainty of only 0.04 dex in estimated logLvalues, which corresponds to less than a 2.5 per cent change in radius at a fixed luminosity. A change in age of±3 Myr leads to a change of only∼±1 per cent in the average over-radius with respect to the BHAC15 mod-els. It follows that the estimated over-radius (with respect to non-magnetic models) for convective stars is significantly larger (>2σ) than both the random errors in the measurements and the systematic uncertainties in the method.
The observed over-radius of 29±10 per cent could be caused by either magnetic inhibition of convection, by starspots or by a combination of the two.
– The curve in the lower panel of Fig. 5 shows the over-radius produced by Dartmouth-magnetic models for a rota-tional dynamo and surface magnetic field strength of 2.5 kG. The over-radius amounts to about 10 per cent for the low-mass fully-convective stars. The plots in Feiden et al. (2015) suggest that a much larger surface magnetic field would be required to explain a ∼30 per cent over-radius, but this would be incompatible with the level of (integrated) mag-netic field measured on rapidly rotating M-dwarfs of 3±1 kG (Reiners et al.2009). The turbulent dynamo model of Feiden & Chaboyer (2013) has a much smaller effect on low-mass PMS stars (e.g. see Malo et al.2014).
– The YREC-spot models with β = 0.3 predict an over-radius of about 15–18 per cent for fully convective stars in NGC 2547, which is almost compatible with the observa-tions. Using the scaling relation between over-radius and spot coverage of Jackson & Jeffries (2014b), the measured over-radius would actually correspond toβ=0.43+0.08−0.11. If we adopt the temperature ratio of 0.70±0.05 between spots and unspotted photosphere, as measured by O’Neal et al. (2004a) and O’Neal (2006) in some active G/K dwarfs, this would require a spot area coverage of 57+1114 per cent. If the temper-ature ratio was larger, as advocated by Feiden & Chaboyer (2014), then this would require an even higher spot coverage. – Alternatively, the observed level of radius inflation could re-sult from the combined effects of inhibition of convection in the stellar interior and inhibition of radiative heat transfer from the stellar surface due to starspots. This scenario was considered as one of several options to account for the over-radius of PMS stars in NGC 2516 by MacDonald & Mullan (2013). If we were to assume that the effects were addi-tive, then a combination of the 2.5 kG Dartmouth-magnetic model and starspots withβ=0.32 would give an over-radius of 30 per cent in fully convective stars (coincidentally this is almost exactly the sum of the over-radii shown for the two magnetic models in the lower panel of Fig.5).
4.3. NGC 2516
these are relatively fast rotators (vsini > 5 km s−1), resulting in only 32 targets with measured Rsini. In Fig. 5 these data are divided into two bins both of which lie leftward of the shaded area indicating stars with radiative cores. According to the BHAC15 evolutionary model, stars of this luminosity and with an age of∼140 Myr should be ZAMS stars. An average over-radius of 14±9 per cent relative to the BHAC15 model is inferred from theRsini data. This falls to∼8 per cent relative to the Dartmouth-magnetic/YREC-spot models. The measure-ment uncertainties are therefore too large to discern whether the magnetic or non-magnetic models better describe the data.
Also shown in Fig.5are estimates ofRfrom previous work (Table1of Jackson & Jeffries2014b), which also used Giraffe spectroscopy to estimate vsini and periods from Irwin et al. (2007), to determineRsinifor a sample that extended to lower luminosities. The inferred mean radii from both datasets show reasonable agreement for ZAMS stars over a relatively narrow common mass range (0.45<M/M<0.65) and these are con-sistent with either magnetic or non-magnetic models. The re-sults of Jackson & Jeffries (2014b) however demonstrate a much larger over-radius (∼40 per cent) for fully convective PMS stars. This is the same situation as found in NGC 2547 and could be explained in the same way. Unfortunately no direct comparison for PMS stars in NGC 2516 can be made using the GES data.
4.4. NGC 2264
Figure 5 shows average radii for targets in the mass range 0.4<M/M <1.4 according to the BHAC15 model of Baraffe et al. (2015). All but two targets show luminosities to the right of the shaded area indicating that they are PMS stars still on their Hayashi tracks. Table 4 lists the average radii for two cases; the first calculated usingRsini values for targets iden-tified as RV cluster members in Sect. 2.2, the second using a sample of all targets with measured P andvsini > 5 km s−1 and−20 < RV < 60 km s−1. The broader sample generally shows higher radii but not at a significant level. The results, as measured, are consistent with the majority of the faster rotating targets being members of a single young cluster.
The colour–magnitude plot (Fig.4) shows a number of tar-gets with measuredRsinithat have (I−K)0 >0.5 mag redder than the BHAC15 isochrone, too red to be unresolved binaries and suggesting that a fraction of the targets in NGC 2264 show excessive reddening and/or an infra-red excess due to the pres-ence of disks, which could in turn effect their estimated lumi-nosities and consequently our estimates of over-radius. To test this hypothesis, targets with measured period were plotted on a (J−H) colour versus (H−K) colour diagram and those showing higher than expected (H−K) colour with respect to the usual red-dening band were flagged in Table3as having a possible infra-red excess. Excluding these flagged targets infra-reduces the sample size by 10–20 per cent per bin but makes no makes no measur-able difference (<2 per cent) to the averaged radii and over-radii. Hence, including the few stars with overt signs of circumstellar material appears not to significantly affect the results.
Comparison of the measured radii with the 5.5 Myr isochrone of the BHAC15 model shows an average over-radius of 19 ±5 per cent. Lower mass stars (<1 M) show an average over-radius similar to that predicted by either the Dartmouth-magnetic model or the YREC-spot model. However, for NGC 2264 the inferred over-radii depends strongly on the adopted cluster age and to a lesser extent on its distance. If we assume an uncertainty of±2.5 Myr in age at a fixed distance,
which is comparable to the age spread suggested by Sung et al. (2010), then the over-radius varies from 8±5 per cent for an age of 3 Myr to 27±5 per cent at 8 Myr. In principle, comparison of measured and predicted radii could be used to help constrain the age of very young clusters (e.g. Jeffries2007). However such comparisons are strongly model dependent since the predicted radius at a given age depends on how the effects of the rota-tionally induced magnetic fields are represented (if at all) in the evolutionary model.
5. Summary
GES determinations of RV for photometrically selected candi-dates have been used to define samples of low-mass members in the three young clusters NGC 2516, NGC 2547 and NGC 2264. By combining GES measurements of projected rotation veloc-ity and published rotation periods for a subset of these stars, we have estimated model-independent projected radii as a function ofK magnitude for all three clusters. Average radii as a func-tion of luminosity are calculated and compared with isochrones predicted by several evolutionary models, including variants that incorporate the influence of magnetic inhibition of convection or photospheric starspots.
– The radii of these young, fast-rotating stars in NGC 2547 and NGC 2516 are, on average, larger than predicted by non-magnetic evolutionary models. However, the discrepancy is mostly apparent for the lower-mass, fully convective PMS stars. The current uncertainties in the age and distance for NGC 2264 preclude any meaningful comparison of stellar radii with the models.
– The radii measured for higher-mass ZAMS stars in NGC 2547 and NGC 2516 are consistent with either non-magnetic or non-magnetic models. However, the difference be-tween the predicted radii from these models (10 per cent) is comparable to the precision with which our limited sam-ples permit the determination of average radii. A more de-cisive test would require an additional∼100 determinations of rotation periods to reduce the measurement uncertainties below 5 per cent.
– In contrast the average radii of the lower-mass PMS stars significantly exceed those predicted by non-magnetic mod-els – by 29±10 per cent for members of NGC 2547 and by ∼40 per cent for members of NGC 2516 studied pre-viously using similar techniques. To explain this inflation with the magnetic models would either require: (i) rota-tional dynamos that produce very large surface magnetic fields (>2.5 kG), that may be incompatible with direct mea-surements of surface fields on active stars; (ii) starspots that block 30–50 per cent of the photospheric flux; or a more moderate combination of both.
Gaia-ESO workshops and conferences supported by the ESF (European Science Foundation) through the GREAT Research Network Programme.
References
Affer, L., Micela, G., Favata, F., Flaccomio, E., & Bouvier, J. 2013,MNRAS, 430, 1433
Baraffe, I., Chabrier, G., Allard, F., & Hauschildt, P. H. 1998,A&A, 337, 403
Baraffe, I., Homeier, D., Allard, F., & Chabrier, G. 2015,A&A, 577, A42
Baxter, E. J., Covey, K. R., Muench, A. A., et al. 2009,AJ, 138, 963
Boyajian, T. S., von Braun, K., & van Belle, G. 2012,ApJ, 757, 112
Carpenter, J. M. 2001,AJ, 121, 2851
Chabrier, G., Gallardo, J., & Baraffe, I. 2007,A&A, 472, L17
Cottaar, M., Meyer, M. R., & Parker, R. J. 2012,A&A, 547, A35
Dotter, A., Chaboyer, B., Jevremovi´c, D., et al. 2008,ApJS, 178, 89
Dzib, S. A., Loinard, L., Rodríguez, L. F., & Galli, P. 2014,ApJ, 788, 162
Feiden, G. A., & Chaboyer, B. 2012,ApJ, 761, 30
Feiden, G. A., & Chaboyer, B. 2013,ApJ, 779, 183
Feiden, G. A., & Chaboyer, B. 2014,ApJ, 789, 53
Feiden, G. A., Jones, J., & Chaboyer, B. 2015, in Cambridge Workshop on Cool Stars, Stellar Systems, and the Sun, Vol. 18, 18th Cambridge Workshop on Cool Stars, Stellar Systems, and the Sun, eds. G. T. van Belle, & H. C. Harris, 171
Gilmore, G., Randich, S., Asplund, M., & et al. 2012,The Messenger, 147, 25
Hartman, J. D., Bakos, G. Á., Kovács, G., & Noyes, R. W. 2010,MNRAS, 408, 475
Irwin, J., Hodgkin, S., Aigrain, S., et al. 2007,MNRAS, 377, 741
Irwin, J., Hodgkin, S., Aigrain, S., et al. 2008,MNRAS, 384, 675
Jackson, R. J., & Jeffries, R. D. 2010a,MNRAS, 402, 1380
Jackson, R. J., & Jeffries, R. D. 2010b,MNRAS, 407, 465
Jackson, R. J., & Jeffries, R. D. 2014a,MNRAS, 445, 4306
Jackson, R. J., Jeffries, R. D., & Maxted, P. F. L. 2009,MNRAS, 399, L89
Jackson, R. J., & Jeffries, R. D. 2014b,MNRAS, 441, 2111
Jackson, R. J., Jeffries, R. D., Lewis, J., et al. 2015,A&A, 580, A75
Jeffries, R. D. 2007,MNRAS, 376, 1109
Jeffries, R. D., & Oliveira, J. M. 2005,MNRAS, 358, 13
Jeffries, R. D., James, D. J., & Thurston, M. R. 1998,MNRAS, 300, 550
Jeffries, R. D., Totten, E. J., & James, D. J. 2000,MNRAS, 316, 950
Jeffries, R. D., Thurston, M. R., & Hambly, N. C. 2001,A&A, 375, 863
Jeffries, R. D., Naylor, T., Devey, C. R., & Totten, E. J. 2004,MNRAS, 351, 1401
Jeffries, R. D., Jackson, R. J., Cottaar, M., et al. 2014,A&A, 563, A94
Kamezaki, T., Imura, K., Nagayama, T., et al. 2013, in IAU Symp. 292, eds. T. Wong, & J. Ott, 45
Lamm, M., Bailer-Jones, C. A. L., Mundt, R., & Herbst, W. 2004, in Stellar Rotation, eds. A. Maeder, & P. Eenens,IAU Symp., 215, 125
López-Morales, M. 2007,ApJ, 660, 732
Lyra, W., Moitinho, A., van der Bliek, N. S., & Alves, J. 2006,A&A, 453, 101
MacDonald, J., & Mullan, D. J. 2012,MNRAS, 421, 3084
MacDonald, J., & Mullan, D. J. 2013,ApJ, 765, 126
Magrini, L., & Randich, S. 2015, ArXiv e-prints [arXiv:1505.08027] Makidon, R. B., Rebull, L. M., Strom, S. E., Adams, M. T., & Patten, B. M.
2004,AJ, 127, 2228
Malo, L., Doyon, R., Feiden, G. A., et al. 2014,ApJ, 792, 37
Meynet, G., Mermilliod, J.-C., & Maeder, A. 1993,A&AS, 98, 477
Morales, J. C., Ribas, I., Jordi, C., et al. 2009,ApJ, 691, 1400
Mullan, D. J., & MacDonald, J. 2001,ApJ, 559, 353
Naylor, T., & Jeffries, R. D. 2006,MNRAS, 373, 1251
Naylor, T., Totten, E. J., Jeffries, R. D., et al. 2002,MNRAS, 335, 291
O’Neal, D. 2006,ApJ, 645, 659
O’Neal, D., Neff, J. E., Saar, S. H., & Cuntz, M. 2004,AJ, 128, 1802
Pasquini, L., Avila, G., Blecha, A., & et al. 2002,The Messenger, 110, 1
Raghavan, D., McAlister, H. A., Henry, T. J., et al. 2010,ApJS, 190, 1
Randich, S., Gilmore, G., & Gaia-ESO Consortium. 2013,The Messenger, 154, 47
Reiners, A., Basri, G., & Browning, M. 2009,ApJ, 692, 538
Reinhold, T., Reiners, A., & Basri, G. 2013,A&A, 560, A4
Sacco, G. G., Jeffries, R. D., Randich, S., & et al. 2015,A&A, 574, L7
Skrutskie, M. F., Cutri, R. M., Stiening, R., et al. 2006,AJ, 131, 1163
Somers, G., & Pinsonneault, M. H. 2014,ApJ, 790, 72
Somers, G., & Pinsonneault, M. H. 2015,ApJ, 807, 174
Spruit, H. C., & Weiss, A. 1986,A&A, 166, 167
Sung, H., & Bessell, M. S. 2010,AJ, 140, 2070
Sung, H., Bessell, M. S., & Lee, S.-W. 1997,AJ, 114, 2644
Sung, H., Bessell, M. S., Chun, M.-Y., Karimov, R., & Ibrahimov, M. 2008,AJ, 135, 441
Terndrup, D. M., Pinsonneault, M., Jeffries, R. D., et al. 2002,ApJ, 576, 950
Tobin, J. J., Hartmann, L., F˝urész, G., Hsu, W.-H., & Mateo, M. 2015,AJ, 149, 119
Torres, G., Andersen, J., & Giménez, A. 2010,A&ARv, 18, 67
Turner, D. G. 2012,Astron. Nachr., 333, 174
F
ra
c
ti
on
i
n
0.
1
k
m
/s
b
in
s
F
ra
c
ti
on
i
n
0.
5
k
m
/s
b
in
s
Increase in vsini (km/s) Offset of RV (km/s)
ǻRV ǻvsini
Fig. A.1.Distribution of the offsets in measured values of RV and of
vsinifor a population of binary stars using the binary distribution pa-rameters described in Sect. 2.4, a luminosity-mass relation ofL ∝M3 and a truevsini=20 km s−1. The black line shows the distribution as-suming all stars are unresolved binaries. The solid histogram shows the actual probability distribution ofΔvsini>0 for a random distribution of targets with an initial binary fraction of 0.5 and where targets show-ing an offsetΔRV>5 km s−1are excluded from the distribution since they would not be classified as cluster members (see Sect. 2.4).
Appendix A: Estimating the effect of binarity on measured values ofv sin i
In theGaia-ESO survey pipeline vsini is estimated from the broadening of spectral lines produced by stellar rotation. In the case of unresolved binaries, the line widths of the measured spectrum may be increased relative to those of the primary star depending on the difference in RV between the primary and sec-ondary star and the relative contribution of the secsec-ondary to the observed spectrum.
The additional broadening can be determined as a function of the line of sight velocity of the primary relative to the centre of mass, RVa, and the relative flux contribution of the secondary at the wavelength of the observed spectra,fb/fa, by measuring the FWHM,W, of a Gaussian profile fitted to the sum of two sepa-rate Gaussian profiles. The first Gaussian represents the primary star with central velocityRV+RVaand FWHMWa; the second Gaussian represents the secondary with velocityRV−RVa/qand FWHMWb, whereqis the binary mass ratio.
To a reasonable approximation the effect of rotational broadening is to increase the measure FWHM as W =
W0
1+(vsini/C)2 where W
0 is the unbroadened line width,
C is a constant dependent on the resolution,Rλ, of the spec-trograph and the speed of light,c, asC = 0.895c/Rλ, giving
C=15.8 km s−1for the Giraffe spectrograph using order sorting filter HR15N (see Jackson et al.2015, for derivation). Using this expression forW, the apparent increase in the measured rota-tional velocity relative to thevsiniof the primary is given by, Δvsini=CW2/W2
a−1 whereWa≈(c/Rλ)
1+(vsini)2/C2. FigureA.1shows the distribution of the offset in the mea-sured recession velocity,ΔRV(relative to the centre of mass) and the increase in rotational velocity,Δvsiniobtained for a random distribution of binary stars (as described in Sect. 2.3) with simi-lar true rotational velocities ofvsini=20 km s−1, where the rel-ative flux from the secondary star is assumed to vary as a fixed power of massfb/fa=qnwithn≈3. Binary pairs showing large changes in RV will mostly have a membership probability<0.8 (e.g. see Fig.2). In this example binaries withΔRV >5 km s−1 are assumed to be non-members and are not included in the dis-tribution ofΔvsini. Of course, only a fraction of stars are in bi-naries and this further reduces the proportion of stars that show large offsets invsini(see Fig.A.1).