Evaluation of filter paper collection of urine samples for detection and measurement of organic acidurias by capillary electrophoresis / C Barbas [et al ]
10
0
0
Texto completo
(2) 74. C. Barbas et al. / J. Chromatogr. B 780 (2002) 73–82. reported that most disorders of organic acid metabolism are diagnosed by GC–MS analysis. The method, which requires extraction of the organic acids and conversion into thermally and chemically stable derivatives, is quite unsuitable for large-scale newborn screening. Tandem mass spectrometry (MS–MS) is the most important development in newborn screening since the addition of hypothyroidism in the mid-1970s [13]. Between 20 and 25 disorders are screened in a blood spot, but, nowadays, with few exceptions, health department screening programs do not have and are unlikely to be able to acquire and retain the equipment and expertise required to perform adequately MS–MS analyses and interpret the results. Capillary electrophoresis (CE) is being admitted as a powerful tool for diagnostic applications suitable for detecting important changes in the metabolic profiles of body fluids [14–17]. Although when it is not coupled to an MS detector it has not the identification capabilities of the previously quoted techniques, it is easy to include in routine analytical laboratories and it can offer a rapid and simple alternative to other more sophisticated and expensive techniques, mainly for a first screening of the pathologies included in the study and for monitoring the therapy once the baby has been diagnosed. It is unquestionable that MS-related techniques are better tools for wide-ranging screening, but there is a gap between the colorimetric methods still employed in some countries and the generalised employ of MS that CE can help to solve. Our research group developed a rapid, automated and simple method [18,19] applied to urine, using capillary electrophoresis and having a low operational cost. Moreover, it requires a very small volume of urine (50 ml is enough) and no sample preparation. This method permits the separation, detection and even the identification in less than 15 min of a wide range of metabolic disorders related to the excretion of large amounts of organic acids in urine. It can be also applied to other body fluids, such as plasma, cerebrospinal fluid (data not shown) or amniotic liquids [20]. Although the frequency of these disorders is low, the rapid, automated, accurate analysis of organic acids, with a very small and easily transportable. sample, is clinically important and very useful. The organic acids that mark these disorders are mainly detected in urine because of the rapid excretion of these water soluble acids by the kidneys. No low cost screening method that can detect a multitude of organic acidurias has yet been developed. In an in-depth study considering social and economical features, Seymour concluded that in the UK the screening of only glutaric aciduria type I which can be treated if detected just after birth, could justify the cost of screening [12]. Glutaric aciduria type I is clearly detected in the present work. To simplify sample collection, it is necessary to have more data on the adequacy of filter paper sample collection for CE analysis. Therefore, we have evaluated the possibility of applying the method after specimen collection in a paper filter put on the nappy of newborns. Interferences coming from the nappy, recoveries obtained, possible correction of recoveries with creatinine and stability of the compounds have been studied. Moreover, we have optimised the media and conditions for re-extraction to give the best sensitivity and a more simple procedure.. 2. Experimental. 2.1. CE system Capillary zone electrophoresis (CZE) was performed on a Beckman System 5500 (P/ACE) equipped with a UV detector set at 200610 nm, an automatic injector, a column cartridge pretreated with polyacrylamide (Beckman, Palo Alto, CA, USA) 37 cm in length, with internal diameter 50 mm, and the detector window was set at 30.6 cm. All the experiments were carried out at 25 8C. Sample injections were made by pressure for 5 s (0.5 p.s.i.). Separation was developed with an applied reversed voltage (V ) of 10 kV.. 2.2. Chemicals and samples 2.2.1. Standards Standards, minimum 95%, were obtained from Sigma (St. Louis, MO, USA)..
(3) C. Barbas et al. / J. Chromatogr. B 780 (2002) 73–82. 2.2.2. Buffers Phosphoric acid 85% was from Merck (Darmstadt, Germany), sodium hydroxide from Panreac (Madrid, Spain) and methanol HPLC grade from Scharlau (Barcelona, Spain). Buffer solutions and all the dilutions were prepared with water purified by a Milli-pore Milli-QSystem (Millipore, Bedford, MA, USA). The electrophoretic buffer S, pH 6.0, was prepared as previously described [19], that is 0.2 M phosphoric acid adjusted to pH 6.0 with NaOH, and mixed with 10% v / v of methanol. 2.2.3. Samples Fresh normal urine samples from children under 8 ´ years old were kindly provided by Virgen del Rocıo Hospital (Sevilla, Spain) in compliance with the Helsinki declaration (1996). They were pooled, aliquoted and kept at 220 8C for the optimisation study. The same hospital provided a sample from a patient with alkaptonuria, who had been previously diagnosed and it is being monitored to study the response to therapy. A model pathological sample was prepared by spiking the normal urine with the assayed standards in the concentrations shown below. At the end of the assay, real urine samples coming from babies under 4 months were collected by volunteer parents following the designed protocol, similar to those employed in other screening [4]. 2.2.4. Peak assignment and quantification Peak assignment in urine samples or paper extracts was performed by comparison of migration time with the corresponding standards and confirmed by coinjection of the standard. Quantification was accomplished by the external standard method. 2.2.5. Creatinine Creatinine was measured spectrophotometrically by the Jaffe´ method [21]. 2.2.6. CE method A previous CE method [19] was optimised in order to detect a wide range of metabolic disorders related to the excretion of large amounts of organic acids in urine. Although 30 organic acids can be separated with this method, only 17 have been. 75. employed in this study, because some of them are not commercially available and some of them are very unstable. In Fig. 1, electropherogram F shows the separation of 17 standards of different organic acids employed in the study by CE using buffer S as electrolyte at 210 kV in less than 15 min. Working concentrations are fully in the range, or sometimes under, pathological conditions considering a typical urine containing 1 mM in creatinine. For the urine analysis, the samples were diluted (1:3) and centrifuged prior to the run with buffer S described above. If any peak with migration time corresponding to a standard was increased, a pathology was suspected and it ought to be confirmed by co-injecting the sample (or spiking) with the suspected compound. To facilitate the collection of urine samples before the CE analysis in the clinical laboratory we have also evaluated the degree of specimen impregnation employing filter paper strips located on the diaper of newborns.. 2.2.7. Optimisation of sample collection and reextraction The analysed compounds are water soluble and water would be the best solvent for CZE, but it is necessary to evaluate if these acids are re-extracted in pure water from filter paper. For testing recovery, the standards (6 ml) in concentrations around the low to medium pathological levels (Table 1) were poured onto 1036 cm pieces of absorbent filter paper. It was dried on a clean non-absorbent surface in room air over 24 h. A 20-cm 2 section was cut from the paper, fan folded, and placed in a disposable 12-ml polyethylene tube. The soluble components were eluted with 3 ml of pure water; after addition of water, the tube was mechanically shaken for 5 min, allowed to stand for 15 min and then the tube was centrifuged for 15 min at 2000 g and processed as described below. A 500-ml aliquot was removed for creatinine determination. Two different brands of filter paper were tested to evaluate differences in sample retention or possible interferences in the electropherograms. In the same way, three different brands of diapers were tested: one of them sold in pharmacy shops (mainly consisting of cellulose) and the other two.
(4) 76. C. Barbas et al. / J. Chromatogr. B 780 (2002) 73–82. were known mass market brands (with a more complex composition), all of them for babies under 6 months. For the optimisation of some preliminary parameters: solvent extraction volume, paper type and diaper, etc., some representative acids of the group were chosen. The assay was performed with ketoisovaleric and orotic acids, representatives of ketoacids and aromatic acids, and lactic as an aliphatic acid. Creatinine was also included. For the optimization of the eluant volume, nine strips of filter paper 2310 cm were impregnated with 2 ml of standard solution containing ketoglutaric acid, lactic acid, ketoisovaleric acid, pyruvic acid, orotic acid and creatinine. The extraction of the acids was carried out with 2, 3 and 4 ml of Milli-Q water, in triplicate. The extraction process was carried out as previously described. The stability of these acids on dried filter paper stored at room temperature was examined by spiking filter papers (6310 cm) with 6 ml of urine with all the standards added and assaying them after different storage times throughout 1 month, as compared with the spiked urine measured directly. Simulation of the absorption from a diaper in the whole process involved application of the urine spiked with all the acids to a filter paper put on a diaper. It was compared with the same sample poured on a filter paper over a non-absorbent surface. Optimised conditions for sample collection and processing were: absorbent filter paper 1036 cm was put on the baby’s diaper and closed. After wetting, it was allowed to dry on a clean, flat, non-absorbent surface in room air and after 24 h it was sent to the laboratory. There, strips of 2310 cm were cut, one of them was fan folded and placed in a disposable 12-ml polyethylene tube. The soluble components were eluted with 3 ml of pure water by mechanical shaking for 5 min. Then, the tube was centrifuged for 15 min and processed as previously described. Analysis ought to be performed within 2 weeks and creatinine measured to find out urine concentration and impregnation degree.. 2.2.8. Quantification The peak areas of the acids were compared with those obtained from identical concentrations of acids. without prior extraction. When samples of urine were spiked with standard acids the samples were previously quantified to determine the natural existing acids. The whole method was applied to normal urine samples by giving the papers and adequate instructions to the parents of the children. A urine sample of a patient with alkaptonuria was directly measured and then it was impregnated following the procedure previously described. Samples were re-extracted and measured after 1, 7 and 14 days.. 3. Results and discussion Recoveries of the acids and creatinine with MilliQ water from filter paper are shown in Table 1 for 12 different strips. Most of the acids have recoveries near 100%, considering the limits of confidence. Acetoacetic and propionic acids have lower recoveries because they are highly volatile, while homogentisic acid is easily oxidizable. Although extraction of creatinine is not optimal, water can be Table 1 Organic acids and creatinine recovery from filter paper with water Acid. Concentration (mM). % Organic acid recovery6C.L.. Oxalic Fumaric Ketoglutaric Malic Methylmalonic Glutaric Pyruvic N-Acetyl-L-aspartic Glycolic Acetoacetic Propionic Lactic Ketoisovaleric 3-Hydroxybutyric Pyroglutamic DL-Hydroxyisovaleric Orotic Phenyllactic Homogentisic Hippuric. 0.24 0.24 0.36 1.50 0.36 0.36 1.20 2.40 0.72 0.48 4.00 2.40 0.72 1.44 0.64 2.04 0.12 0.16 0.16 0.05. 75612 93616 80613 89615 87613 87615 91617 87615 86616 68612 962 94617 86615 87614 94620 81614 96617 89619 69615 91618. Creatinine. 0.80. 76614. n. 12. 12.
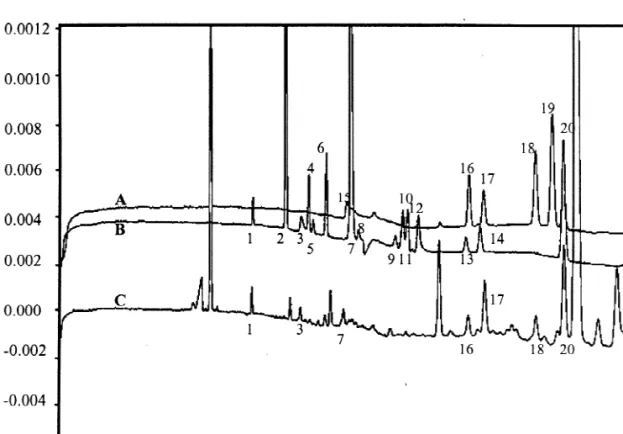
(5) C. Barbas et al. / J. Chromatogr. B 780 (2002) 73–82. considered a good solvent for extraction and it is the best for the analytical technique. The only notable peak observed on blank runs, where de-ionized water had been directly applied to both types of filter paper, was an unknown whose migration time did not interfere with the analytes (Fig. 1). No difference was found in the absorbent power either. The rest of the study was performed with Whatman paper. The same was observed with the three brands of diapers, whose blanks are also shown in Fig. 1. Moreover, there is no statistical difference in the recoveries obtained from the two filter papers and the three diapers in the assayed acids (Student t-test, P.95%). Therefore, one of them was randomly selected for the rest of the assay: Whatman filter paper and a well-known mass market diaper brand. For the comparison of the recoveries of each acid. 77. with the three different water volumes (2, 3 and 4 ml), one-way ANOVA was applied (P.95%) and no statistical differences appeared. Three ml was considered the most appropriate volume because it is easy to manipulate and in such conditions the final dilution of the acids would be very similar to that employed in the proposed CE method for urine samples [19]. Table 2 shows the recoveries of all the standards and creatinine when the filter paper was put on a diaper. Obviously recoveries decreased, as part of the sample goes into the diaper. Recoveries of the acids were near 45%, except the highly volatile (propionic and acetoacetic) or oxidizable (homogentisic) ones. Creatinine recovery is always lower and therefore recoveries may be over 100% when expressed by creatinine. Table 3 shows the values obtained for the quantifi-. Fig. 1. Electropherograms from: (A) diaper type A; (B) diaper type B; (C) diaper type C; (D) Whatman filter paper; (E) Schleicher & Schuell; (F) standards of organic acids: 1, oxalic; 2, fumaric; 3, ketoglutaric; 4, malic; 5, methylmalonic; 6, glutaric; 7, N-acetyl-L-aspartic; 8, glycolic; 9, acetoacetic; 10, propionic; 11, lactic; 12, ketoisovaleric; 13, 3-hydroxybutyric; 14, DL-hydroxyisovaleric; 15, phenyllactic; 16, homogentisic; 17, hippuric..
(6) C. Barbas et al. / J. Chromatogr. B 780 (2002) 73–82. 78. Table 2 Organic acid standards and creatinine recovery from filter paper put on a diaper Acids. % Organic acid recovery6C.L.. % Organic acid recovery with creatinine6C.L.. Oxalic Fumaric Ketoglutaric Malic Methylmalonic Glutaric Pyruvic N-Acetyl-L-aspartic Glycolic Acetoacetic Propionic Lactic Ketoisovaleric 3-Hydroxybutyric Pyroglutamic DL-Hydroxyisovaleric Orotic Phenyllactic Homogentisic Hippuric. 3765 4866 4265 4565 4665 4565 4366 4566 5066 2764 4.760.5 4566 4566 4466 4264 4566 4565 4265 2866 4267. 124611 164610 14168 15268 15466 152610 111612 153611 169616 9168 1662 150615 153615 151624 90611 151618 118612 96611 72611 107611. % Creatinine recovery6L.C.. 3465. Table 3 Concentrations of organic acids added to a urine sample in filter paper and measured on different days. Oxalic Fumaric Ketoglutaric Malic Methylmalonic Glutaric N-Acetyl-L-aspartic Lactic Ketoisovaleric 3-Hydroxybutyric Pyroglutamic Hydroxyisovaleric Orotic Phenyllactic Homogentisic Hippuric. Concentration. (mM)6C.L. S1U. 24 h. 7 days. 15 days. 30 days. 0.0860.02 0.2360.01 1.2460.04 1.460.1 0.6860.09 1.2160.04 3.6760.02 4.160.8 0.4860.05 4.860.4 1.1660.06 2.760.2 0.260.01 0.5760.04 0.160.03 8.860.5. 0.160.5 0.3360.07 1.560.3 1.760.4 0.960.3 1.760.3 561 3.160.8 0.860.2 661 1.060.3 3.960.8 0.1960.05 0.560.1 0.0760.02 862. 0.1760.06 0.3060.08 1.060.3 1.960.5 0.960.3 1.660.4 461 2.960.6 0.5060.08 662 1.060.3 361 0.1360.03 0.560.1 0.0560.02 862. 0.2160.07 0.2860.03 0.960.1 2.260.2 1.160.1 1.860.2 4.960.5 2.660.3 – 761 1.260.4 3.260.3 0.1860.05 0.560.2 0.1360.04 962. 0.260.1 – 0.260.1 0.1860.06 0.560.2 1.560.9 762 – – 2.960.8 1.160.2 2.660.5 0.1760.03 0.660.1 0.0460.01 861. S1U, standards1urine.. cation of the urine sample spiked with all the assayed acids measured directly and after being impregnated in filter paper and maintained at room temperature. for 1, 8, 14 and 28 days. p-Hydroxyphenylpyruvic and phenylpyruvic acids were not included because their instability is well-known and the degradation.
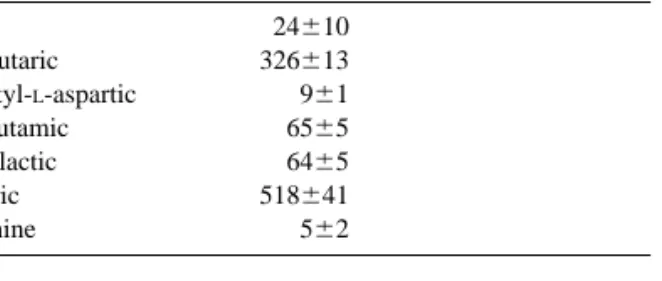
(7) C. Barbas et al. / J. Chromatogr. B 780 (2002) 73–82 Table 4 Organic acids found as naturally occurring in a urine pool from healthy children Organic acid. mmol / mol Cr6C.L. (n58). Oxalic Ketoglutaric N-Acetyl-L-aspartic Pyroglutamic Phenyllactic Hippuric Creatinine. 24610 326613 961 6565 6465 518641 562. products can interfere with the analysis. If, in some case, one of these analytes, p-hydroxyphenylpyruvic or phenylpyruvic acid, were present in a pathological sample, it would be detected, due to their high UV absorption, in spite of being partially degraded. High values for some of the standard deviations in this table and some specific increases of concentration. 79. values were not due to the analytical method, but to the collection procedure. When wet paper is not left completely flat to let dry, acids migrate irregularly and these differences appear. That is one of the arguments for measuring systematically creatinine in the strips. In order to evaluate the stability, concentrations of each acid were represented versus time. The acids whose slopes with the confidence limits (P.95%) include the zero value were considered stable. Glutaric, pyroglutamic, orotic, phenyllactic, and hippuric and orotic acids are stable in these conditions over 30 days. Methylmalonic, N-acetylaspartic, lactic, 3-hydroxybutyric, hydroxyisovaleric and fumaric acids are stable for 15 days. Ketoglutaric, fumaric, malic and ketoisovaleric are stable for 7 days. Homogentisic acid concentration, easily oxidizable, decreases quickly, but it is usually high in pathological samples and therefore easily detectable in spite of the decrease. Glycolic, acetoacetic and propionic acids, highly volatile, are not even detected. Table 5 Recovery of organic acids added to urine from filter paper without and with diaper and expressed or not by creatinine Acids. Without diaper % Organic acid recovery6C.L.. Oxalic 4169 Fumaric 113618 Ketoglutaric 111617 Malic 117620 Methylmalonic 109621 Glutaric 114617 Pyruvic – N-Acetyl-L-aspartic 124620 Glycolic – Acetoacetic – Propionic 2164 Lactic 121619 Ketoisovaleric 130618 3-Hydroxybutyric 145624 Pyroglutamic 88611 DL-Hydroxyisovaleric 124619 Orotic 8669 Phenyllactic 85610 Homogentisic 5266 Hippuric 8769 % Creatinine recovery6C.L. Cr., creatinine.. With diaper % Organic acid recovery with Cr6C.L.. % Organic acid recovery6C.L.. % Organic acid recovery with Cr6C.L.. 3964 112613 10967 11469 106614 11265 – 12168 – – 2366 11865 12867 147611 7268 12166 7066 6967 4264 7167 110613. 6965 5965 4664 4966 4166 4663 – 5064 – – – 77612 6064 5664 4064 4765 4063 4264 3963 3766. 151617 12767 10165 10668 8868 9966 – 10967 – – – 167619 132612 122610 90611 103610 8969 96611 120613 87617 4564.
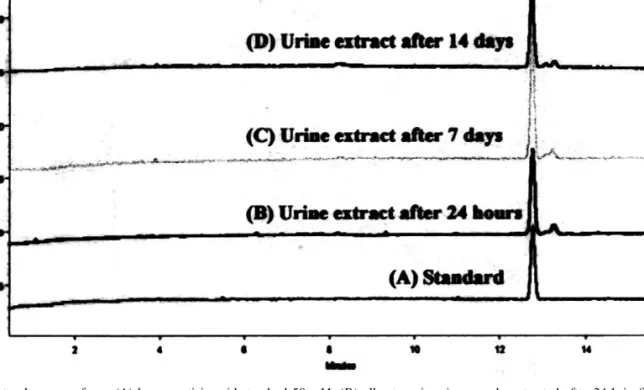
(8) 80. C. Barbas et al. / J. Chromatogr. B 780 (2002) 73–82. at 8 days. Lactic and fumaric acid signals completely disappeared at 28 days. Therefore, measurement is recommended within 2 weeks, as most of the assayed organic acids are stable at 14 days. Finally a urine pool was quantified. The acids shown in Table 4 were found as naturally occurring. This urine was spiked with all the assayed acids and recoveries from filter paper put on a nonabsorbent surface or on a diaper were calculated. Data are collected in Table 5. Results and therefore conclusions are quite similar to those obtained during optimization for standards. Once conditions were optimized, real urine samples from healthy babies (n56) collected by their parents were studied. Fig. 2 shows one of these urine extracts. The peaks identified corresponded to oxalic, ketoglutaric, N-acetylaspartic, pyroglutamic, orotic,. phenyllactic and hippuric acids. Peaks were identified by migration times as compared with standards and by co-injection with the suspected compound. The standards were divided in two groups to make the identification easier. The organic acids found in these urine samples were under pathological levels. Samples contaminated with feces or creams did not interfere with the analysis. The alkaptonuria urine sample gave a concentration of 1030 mM homogentisic acid / mol creatinine directly measured. After being impregnated in filter paper for 24 h and re-extracted, the value was 846 mM / mol creatinine (82% of the initial value), after 7 days it was 741 mM / mol creatinine (72%) and after 14 days it was 774 mM / mol creatinine (75%). Fig. 3 shows the electropherograms corresponding to homogentisic acid standard 50 mM and the different paper extracts at 24. Fig. 2. Electropherogram from: (A) standard mixture I; (B) standard mixture II; (C) urine extract. Peak identification: 1, oxalic; 2, fumaric; 3, ketoglutaric; 4, malic; 5, methylmalonic; 6, glutaric; 7, N-acetyl-L-aspartic; 8, glycolic; 9, acetoacetic; 10, propionic; 11, lactic; 12, ketoisovaleric; 13, 3-hydroxybutyric; 14, DL-hydroxyisovaleric; 15, pyruvic; 16, pyroglutamic; 17, orotic; 18, phenyllactic; 19, homogentisic; 20, hippuric..
(9) C. Barbas et al. / J. Chromatogr. B 780 (2002) 73–82. 81. Fig. 3. Electropherogram from: (A) homogentisic acid standard 50 mM; (B) alkaptonuria urine sample extracted after 24 h in filter paper; (C) the same urine after 7 days in filter paper; (D) after 14 days.. h, 7 days and 14 days. Even considering oxidation and all the experimental errors associated to the extraction process, identification is unquestionable and quantification is very good.. analysis. Finally, another strip of the same filter paper is suitable for further analysis, when an abnormal acid profile is detected, and a deeper knowledge or identification of analytes is needed by GC–MS or other techniques.. 4. Conclusion Acknowledgements The method we report has the advantages of easy sample collection, easy shipping or delivery, and rapid analysis. It could be an important point for families living far away from hospitals or in countries where deliveries are mainly at home. Moreover, this method of collection and analysis can be used for those acids, such as glutaric, for which screening is considered especially advisable [12]. CE analysis could achieve diagnostically accurate results of many metabolic disorders after elution of urine from the filter paper. The real incidence of organic acidurias detectable by this screening method is unknown. The infrastructure for statewide urine collection from babies could be the same as for mass blood screening for phenylketonuria, but with different resources for. The authors thank Dr. Gayoso for his encouragement in the execution of the present work and C.A.M. project no. 08.6 / 0001.1 / 99 and San PabloCEU University project no. 3 / 99 for financial support.. References [1] Y. Kinoshita, S. Yamada, K. Haraguchi, T. Takayanagi, Y. Mori, T. Takahashi, E. Haruki, Clin. Chem. 34 (1998) 2228. [2] R. Kerbl, C.E. Urban, R. Ladenstein, I.M. Ambros, E. Spuller, I. Mutz, G. Amann, H. Kovar, H. Gadner, P.F. Ambros, Med. Pediatr. Oncol. 29 (1997) 1. [3] J.L. Ater, K.L. Gardner, L.E. Foxhall, B.L. Therrell Jr., W.A. Bleyer, Cancer 82 (1998) 1593..
(10) 82. C. Barbas et al. / J. Chromatogr. B 780 (2002) 73–82. [4] M. Tuchman, B. Lemieux, C. Auray-Blais, L.L. Robison, R. Giguere, M.T. McCann, W.G. Woods, Pediatrics 86 (1990) 765. [5] J.A. Seviour, A.C. McGill, A.W. Craft, L. Parker, S. Bell, M. Cole, J. Smith, E. Hawkins, J. Brown, A.D. Gordon, Am. J. Pediatr. Hematol. / Oncol. 14 (1992) 332. [6] J. Hanai, T. Kawai, Y. Sato, N. Takasugi, M. Nishi, T. Takeda, Clin. Chem. 33 (1987) 2043. [7] M.T. McCann, M.M. Thompson, I.C. Gueron, B. Lemieux, ` M. Tuchman, Clin. Chem. 42 (1996) 910. R. Giguere, ` [8] B. Lemieux, C. Auray-Blais, R. Giguere, D. Shapcot, C.R. Scriver, J. Inherit. Metab. Dis. 11 (1998) 45. [9] M.T. McCann, M.M. Thompson, I.C. Gueron, M. Tuchman, Clin. Chem. 41 (1995) 739. [10] M. Tuchman, M.T. McCann, P.E. Johnson, B. Lemieux, Pediatr. Res. 30 (1991) 315. [11] B.A. Chamberlin, C.C. Sweeley, Clin. Chem. 33–34 (1987) 572.. [12] C.A. Seymour, M.J. Thomason, R.A. Chalmers, G.M. Addison, M.D. Bain, F. Cockburn, P. Littlejohns, J. Lord, A.H. Wilcox, in: Health Technology Assessment Programme, Vol. 1, 1997, p. 1. [13] H.L. Levy, Clin. Chem. 44 (1998) 2401. [14] R. Lehmann, W. Voelter, H.M. Liebich, J. Chromatogr. B 697 (1997). [15] K. Kitagishi, H. Shintani, J. Chromatogr. B 717 (1998) 327. ´ L.D. Fairbanks, J. Sevcık, ´ P. Bartak, ´ [16] T. Adam, D. Friedecky, Clin. Chem. 45 (1999) 2086. [17] C. Blessum, J.O. Jeppsson, F. Aguzzi, H. Bernon, J. Bienvenu, Ann. Biol. Clin. 57 (1999) 643. [18] C. Barbas, N. Adeva, R. Aguilar, M. Rosillo, T. Rubio, M. Castro, Clin. Chem. 44 (1998) 1340. ´ C. Barbas, R. Aguilar, M. Castro, Clin. Chem. 44 [19] A. Garcıa, (1998) 1905. [20] L. Saavedra, C. Barbas, J. Chromatogr. B 766 (2002) 235. ´ Z. Physiol. Chem. 10 (1886) 391. [21] M. Jaffe,.
(11)
Figure

Documento similar
The draft amendments do not operate any more a distinction between different states of emergency; they repeal articles 120, 121and 122 and make it possible for the President to
The performance of ceramic MFCs using cathodes based on different types of binders 303. was also evaluated in terms of urine treatment
Field experiments in organic key horticultural crops to evaluate the efficacy of organic Molluscicides- ovicides and the use of plant-traps as pests control method for land
2 shows the evolution of phenol and short-chain organic acids (mainly oxalic and formic but also maleic, acetic and traces of malonic acid) detected upon the
The existence of fully spin polarized electronic bands in a single organic monolayer can be used to produce an efficient spin filter out of graphene, because an electron current of
Chapter 5: Effect of waste paper suppression on organic fraction of municipal solid waste anaerobic digestion: Biogas and digestate evaluation.. The waste paper
75 Table 6.6 Summary of the mean contact angle value for water as a measurement liquid and its standard deviation measured by the DSA-100 for the superhydrophobic sample
Confirmation of these in vitro metabolites via the analysis of authentic samples (especially urine) has proven the suitability of the different in vitro strategies
