Full PDF
14
0
0
Texto completo
(2) 1958, Nwankwo 1984, 1993, 1996, 2000). Some published works on Lekki lagoon include Kusemiju (1973, 1976) who studied catfishes of the Lekki lagoon with particular reference to distribution, reproduction and growth of catfish Chrysichthys walkeri (Gunther). Marc et al. (2006) studied species assemblage succession in the shallow tropical lake Guiers, Senegal. Hence this paper aims on the study of the successional pattern of phytoplankton of Lekki for environmental biological monitoring. MATERIALS AND METHODS Study area: Lekki lagoon, a large expanse of shallow freshwater, is located in Lagos and Ogun States of Nigeria, where the alternation of the dry and wet seasons are phenomenal (Adesalu & Nwankwo 2009). It covers an area of nearly 247km2. A greater part of the lagoon is shallow (<3.0m), while some areas are up to 6.0m deep (Adesalu 2007). It lies between 06°25’-06°35’ N and 004°00’-004°13’ E. Two peaks of rainfall are associated with the Lekki lagoon, a major peak in July and a lesser peak in September. There are two peaks of sunshine hours which approximately correspond to the equinoxes. The environment is characterized by fringing macrophyte vegetations which are dominated by mangrove and freshwater types. The mangrove species are dominated by few genera: Rhizophora racemosa (Red mangrove), Avicennia nitida (White mangrove), Acrosticum aureum, Paspalum orbiculare and Dryopteris. The riparian vegetation is also dominated by Cocos nucifera and Terminalia cattapa trees. A number of floating macrophytes find their way through the numerous adjoining rivers, creeks and creeklets into this lagoon. Notably important is Eichhornia crassipes Solm (Mart.) that may disturb navigation by impeding traffic and fishing within the lagoon. Other observed macrophytes were Pistia stratiotes, Lemna pausicaudata and Vosia cuspidata. Associated with these plants are periphytic organisms such as algae and mollusks. The mainstay of human communities that live around this environment is artisanal fishing. 144. Collection of samples: A motorized boat and Global Positioning System (GPS) were used during the 24 months sampling period (June 2003-May 2005). Phytoplankton samples were collected monthly from 12 stations (Adesalu & Nwankwo 2009) chosen to reflect distance and confluence of rivers and creeks into the lagoon. All samples were taken using a standard plankton net of 55µm mesh size towed steadily for ten minutes at low speed, and samples preserved in 4% unbuffered formalin. For physico-chemical analysis, surface water samples were stored in 1L properly labeled plastic containers with screw caps and transported to the laboratory in ice-chests. In the laboratory, all water samples were stored in refrigera≤40C) for further analysis within 24h. All samples were collected during daylight hours of to minimize variations due to diurnal migration (Bainbridge 1972). Physical and chemical analysis of water samples: The methods described by America Public Health Association (Apha 1998) were used for physical and chemical analysis. Air and surface water temperature were measured in situ with a simple mercury thermometer. The transparency was measured using a 20cm diameter Secchi disc. The depth was measured with a calibrated pole and the water pH determined using a Phillips pH meter (Model PW950). The chemical factors determined include salinity, conductivity, dissolved oxygen (DO) and biological oxygen demand (BOD5). Salinity was determined using the Silver Nitrate Chromate titration method as described by Barnes (1980), while Dissolved oxygen content was determined using a Griffin oxygen meter. Biological Oxygen Demand was done after the dissolved oxygen had been measured using the standard method of biochemical consumption of oxygen in five days at 20°C, while conductivity was determined using the HANNA instrument (H18733) and values recorded as mS/cm at 25oC. Chemical oxygen demand and Chloride ion were determined using titrimetric and titration methods, respectively. Oil and grease values were. Rev. Biol. Trop. (Int. J. Trop. Biol. ISSN-0034-7744) Vol. 60 (1): 143-155, March 2012.
(3) determined using Soxhlet extraction method (APHA 1998). Copper and Iron analysis were done by Atomic absorption spectrophotometer (APHA 1998). The Federal Meteorological Department, Oshodi, Lagos kindly provided rainfall and sunshine hours data for the investigation period. Nutrient determination: For nitrate determination the colorimetric method was applied (Apha 1998). Phosphate-phosphorus was determined by the ascorbic acid method, and the values obtained were recorded in milligrams per liter (mg/L). Phytoplankton studies: Dilution factor was used for quantitative analysis of biological samples. From a known volume, a 0.1mL aliquot of the sample was placed in a PalmerMaloney counting chamber using Eppendorf pipette and enumerated using Olympus BX51 photomicroscope. A total of 30 fields were observed for each sample throughout the analysis. In this study, the filamentous blue green were counted using 10µm of filament length, that represented one unit (unicells), and solitary cells were tallied as separate individuals. Since many algae are colonial and consist of a few to many cells, all colonial forms were counted by the individual cell that comprised that colony, except for Microcystis sp. in which the method used for filamentous algae was applied. For further analysis, one unit was equated as one cell. Calculations for individual and total numbers of organisms per millimeter were made using the following formula: Cells/mL in sample = n(V/v)(Dilution factor) V. Calculation of number of cells per mL: Where, n=cells counted V=original sample volume. v=volume counted, which is given by the following calculation (Number of fields x volume of fields) Volume of fields=One Palmer cell count field=00008954 Number of fields=30 (Number of fields x volume of fields)=(30 x .00008954)=0.0026862 Since specific identification of most species of diatoms could not be determined using high dry objective, samples were acid cleaned using concentrated Nitric acid (HN03). Taxonomic keys employed in the identification included Hustedt (1930, 1937, 1942 and 1971), Patrick & Reimer (1966, 1975), Prescott (1961, 1973 and 1982), Komarek & Fott (1983), Round (1981), John & Robert (2003), Krammer & Lange-Bertalot (1986, 1988, 1991a, 1991b, 2000), Komarek & Anagnostids (1998, 2005) and Wolowski & Hindak (2005). Community structure: To obtain the estimate of species diversity, three community structure indices were used. The species richness given by the equation (Margalef 1970): d=. S-1 log eN. Shannon-Wiener diversity index using the following equation (Shannon & Wiener 1973): s. H1= –∑ pilog2 pi i=1. Species equitability with the following equation (Pielou 1975): J=H1 / InS. Correlation coefficient values (r): The coefficient of correlation values for the relationship between some physico-chemical parameters and different classes of phytoplankton in the study site were calculated using. Rev. Biol. Trop. (Int. J. Trop. Biol. ISSN-0034-7744) Vol. 60 (1): 143-155, March 2012. 145.
(4) √. were plotted in multidimensional space with the distance between objects representing the biological dissimilarities. All multivariate plots were obtained using the PRIMER 5 computer program of Clarke & Gorley (2001).. r = ∑XY – (∑X) (∑Y)/N (∑X2 -. (∑X)2/ N ). (∑Y2 (∑Y)2/N ). Where r=coefficient of correlation X and Y=variables under consideration N=Total number of individuals Multidimensional Scaling (MDS): Multidimensional scaling (MDS) is specifically designed to graphically represent relationships between objects in multidimensional space. Analysis of similarities (ANOSIM) using BrayCurtis dissimilarities was applied. The following equation was used: R = (-rB) – (-rW) n(n – 1)/4. Principal Component Analysis (PCA): Principal Component Analysis (PCA) objects. Results Physico-chemical parameters: The mean physico-chemical characteristics of Lekki lagoon water is shown in Table 1. Mean surface water temperature values ranged between 30.230C and 30.730C with the highest value recorded at station B. The surface water is essentially neutral as pH mean values ranged between 7.38-7.46 throughout the sampling period. Surface water salinity values were low throughout the study period (≤0.55mg/L) while phosphate-phosphorus content (mg/L). TABLE 1 Mean physico-chemical values for Lekki lagoon (concentrations in mg/L) STATIONS Surface Water temperature (0C) Air temperature (0C) Transparency (cm) Total suspended solids pH Salinity (‰) Phosphate-phosphorus Nitrate-nitrogen Chloride Conductivity (mS/cm) Dissolved Oxygen (%) Biological Oxygen demand Chemical oxygen demand Oil and grease Turbidity (FTU) Total dissolved solids Sulphate Calcium Fe Pb Hg Cu Ni Zn. 146. A 30.54 29.68 5.74 9.07 7.42 0.47 2.53 2.73 9.23 0.56 4.15 0.23 0.36 0.03 8.59 9.48 0.03 10.46 0.30 0.01 0.01 0.05 0.02 0.02. B 30.73 29.60 7.38 8.56 7.43 0.47 2.70 2.93 9.67 0.52 3.46 0.22 0.30 0.02 9.25 10.29 0.02 11.11 0.23 0.08 0.00 0.02 0.01 0.01. C 30.55 29.60 11.33 9.16 7.41 0.45 2.42 3.42 9.59 0.56 4.21 0.26 0.26 0.02 10.00 10.65 0.03 11.92 0.24 0.25 0.00 0.02 0.02 0.01. D 30.61 29.71 9.25 8.45 7.43 0.45 2.50 2.98 10.00 0.47 4.10 0.23 0.25 0.02 7.46 8.51 0.04 12.07 0.26 0.08 0.00 0.02 0.01 0.01. E 30.40 29.51 11.67 9.28 7.44 0.40 2.56 2.54 9.88 0.47 4.16 0.22 0.24 0.00 9.57 11.29 0.03 11.57 0.22 0.08 0.00 0.03 0.01 0.01. F 30.31 29.44 10.29 9.78 7.46 0.55 2.61 3.85 9.52 0.48 4.25 0.25 0.29 0.01 8.87 11.50 0.03 10.71 0.25 0.01 0.00 0.06 0.01 0.02. G 30.35 29.55 11.08 11.76 7.44 0.47 2.47 3.44 9.40 0.49 4.25 0.29 0.34 0.01 8.37 9.87 0.02 11.04 0.21 0.02 0.00 0.01 0.01 0.01. H 30.23 29.08 10.42 12.71 7.46 0.44 2.49 3.25 9.17 0.52 4.19 0.30 0.32 0.01 7.99 9.95 0.02 10.96 0.23 0.01 0.00 0.01 0.01 0.01. I 30.38 29.29 14.42 8.39 7.44 0.45 2.96 2.75 9.31 0.46 4.17 0.31 0.30 0.01 8.42 10.31 0.05 10.70 0.25 0.00 0.00 0.01 0.01 0.01. J 30.63 28.90 7.30 11.50 7.42 0.44 2.53 3.31 9.31 0.53 4.16 0.28 0.31 0.01 10.29 10.58 0.04 10.21 0.28 0.00 0.00 0.00 0.01 0.01. K 30.70 29.27 10.04 8.87 7.37 0.50 2.54 2.70 9.54 0.62 4.18 0.26 0.31 0.01 9.15 10.81 0.06 11.40 0.30 0.04 0.02 0.02 0.01 0.01. L 30.55 29.21 12.33 8.87 7.38 0.47 2.44 3.97 9.99 0.56 4.17 0.24 0.25 0.01 8.69 10.29 0.03 11.52 0.55 0.02 0.01 0.04 0.01 0.01. Rev. Biol. Trop. (Int. J. Trop. Biol. ISSN-0034-7744) Vol. 60 (1): 143-155, March 2012.
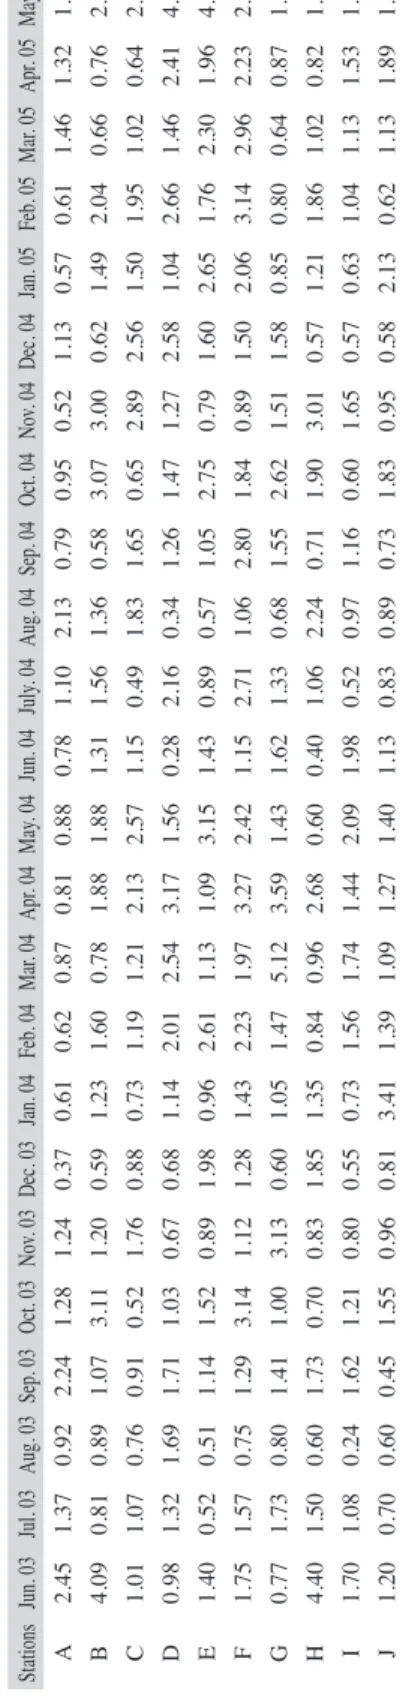
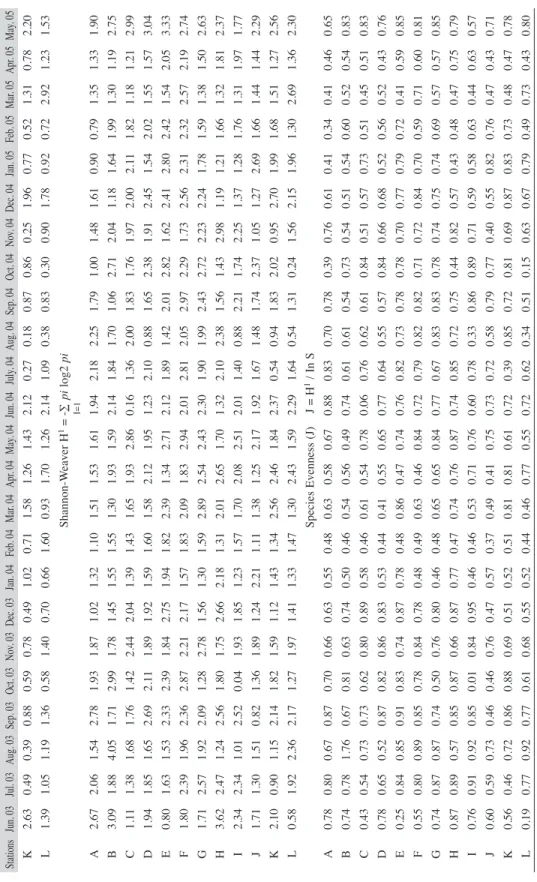
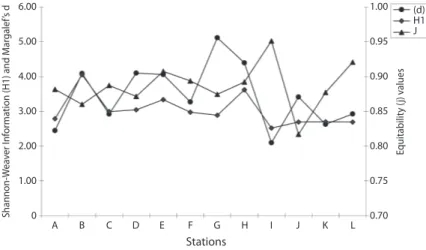
(5) May. 05 1.49 2.26 2.92 4.10 4.06 2.50 1.81 1.63 1.73 1.83 Apr. 05 1.32 0.76 0.64 2.41 1.96 2.23 0.87 0.82 1.53 1.89 Mar. 05 1.46 0.66 1.02 1.46 2.30 2.96 0.64 1.02 1.13 1.13 Feb. 05 0.61 2.04 1.95 2.66 1.76 3.14 0.80 1.86 1.04 0.62 Jul. 03 1.37 0.81 1.07 1.32 0.52 1.57 1.73 1.50 1.08 0.70. Aug. 03 0.92 0.89 0.76 1.69 0.51 0.75 0.80 0.60 0.24 0.60. Sep. 03 2.24 1.07 0.91 1.71 1.14 1.29 1.41 1.73 1.62 0.45. Oct. 03 1.28 3.11 0.52 1.03 1.52 3.14 1.00 0.70 1.21 1.55. Nov. 03 1.24 1.20 1.76 0.67 0.89 1.12 3.13 0.83 0.80 0.96. Dec. 03 0.37 0.59 0.88 0.68 1.98 1.28 0.60 1.85 0.55 0.81. Jan. 04 0.61 1.23 0.73 1.14 0.96 1.43 1.05 1.35 0.73 3.41. Feb. 04 0.62 1.60 1.19 2.01 2.61 2.23 1.47 0.84 1.56 1.39. Mar. 04 0.87 0.78 1.21 2.54 1.13 1.97 5.12 0.96 1.74 1.09. Apr. 04 0.81 1.88 2.13 3.17 1.09 3.27 3.59 2.68 1.44 1.27. May. 04 0.88 1.88 2.57 1.56 3.15 2.42 1.43 0.60 2.09 1.40. Jun. 04 0.78 1.31 1.15 0.28 1.43 1.15 1.62 0.40 1.98 1.13. July. 04 1.10 1.56 0.49 2.16 0.89 2.71 1.33 1.06 0.52 0.83. Aug. 04 2.13 1.36 1.83 0.34 0.57 1.06 0.68 2.24 0.97 0.89. Sep. 04 0.79 0.58 1.65 1.26 1.05 2.80 1.55 0.71 1.16 0.73. Oct. 04 0.95 3.07 0.65 1.47 2.75 1.84 2.62 1.90 0.60 1.83. Nov. 04 0.52 3.00 2.89 1.27 0.79 0.89 1.51 3.01 1.65 0.95. Dec. 04 1.13 0.62 2.56 2.58 1.60 1.50 1.58 0.57 0.57 0.58. Jan. 05 0.57 1.49 1.50 1.04 2.65 2.06 0.85 1.21 0.63 2.13. Rev. Biol. Trop. (Int. J. Trop. Biol. ISSN-0034-7744) Vol. 60 (1): 143-155, March 2012. Jun. 03 2.45 4.09 1.01 0.98 1.40 1.75 0.77 4.40 1.70 1.20. Seasonal succession: The seasonal succession of phytoplankton which followed different pattern as shown in Table 3. The phytoplankton abundance was higher during the dry season (November-April) for the two annual cycles.. Stations A B C D E F G H I J. Community structure: Throughout the sampling period, higher species richness (d) value (5.12) was recorded in March 2004 during the first annual cycle while the lowest value (0.18) was recorded in August 2004 of the second annual cycle. Shannon-Weiner (H1) index was generally low throughout the sampling period. The highest diversity (H=4.05) and lowest (H=0.04) values were recorded in August and October 2003 respectively throughout the 12 stations (Table 2). The HI during the wet season apparently was related to the introduction of numerous benthic forms in the phytoplankton. Highest (0.92) and lowest (0.01) equitability values were recorded during the wet season (August and October 2003) at stations I. Station L recorded highest (0.92) equitability value as station L. The Shannon-Weiner information value (H1) and species richness (d) followed almost same pattern with lowest value for species richness (2.09) corresponded with lowest value (2.52) for Shannon-Weiner index (Fig. 1).. TABLE 2 Comparison of diversity indices at different studied stations of Lekki lagoon (June 2003-May 2005). recorded mean values ranged from 2.44 to 2.96 in stations L and H respectively. High nitratenitrogen content (3.97mg/L) was recorded ata station L while the low value (2.73mg/L) was recorded in station A. Chloride ion values recorded throughout the study period was generally low with the mean highest value (10.00mg/L) recorded at Station D, and mean values for conductivity in the various stations ranged from 0.46 to 0.62mS/cm. In general, higher dissolve oxygen content with mean value (4.25mg/L) was recorded at station F. The Biological oxygen demand value ranged from 0.22-0.31mg/L while chemical oxygen demand values ranged from 0.400.36mg/L for all the stations. Oil and grease values were generally low; it ranged from 0.001 to 0.090mg/L throughout the sampling period.. 147.
(6) 148. Rev. Biol. Trop. (Int. J. Trop. Biol. ISSN-0034-7744) Vol. 60 (1): 143-155, March 2012. 2.67 3.09 1.11 1.94 0.80 1.80 1.71 3.62 2.34 1.71 2.10 0.58. 0.78 0.74 0.43 0.78 0.25 0.55 0.74 0.87 0.76 0.60 0.56 0.19. A B C D E F G H I J K L. A B C D E F G H I J K L. 0.80 0.78 0.54 0.65 0.84 0.80 0.87 0.89 0.91 0.59 0.46 0.77. 2.06 1.88 1.38 1.85 1.63 2.39 2.57 2.47 2.34 1.30 0.90 1.92. 0.67 1.76 0.73 0.52 0.85 0.89 0.87 0.57 0.92 0.73 0.72 0.92. 1.54 4.05 1.68 1.65 1.53 1.96 1.92 1.24 1.01 1.51 1.15 2.36. 0.87 0.67 0.73 0.87 0.91 0.85 0.74 0.85 0.85 0.46 0.86 0.77. 2.78 1.71 1.76 2.69 2.33 2.36 2.09 2.56 2.52 0.82 2.14 2.17. 0.70 0.81 0.62 0.82 0.83 0.78 0.50 0.87 0.01 0.46 0.88 0.61. 1.93 2.99 1.42 2.11 2.39 2.87 1.28 1.80 0.04 1.36 1.82 1.27 0.66 0.63 0.80 0.86 0.74 0.84 0.76 0.66 0.84 0.76 0.69 0.68. 1.87 1.78 2.44 1.89 1.84 2.21 2.78 1.75 1.93 1.89 1.59 1.97 0.63 0.74 0.89 0.83 0.87 0.78 0.80 0.87 0.95 0.47 0.51 0.55. 1.02 1.45 2.04 1.92 2.75 2.17 1.56 2.66 1.85 1.24 1.12 1.41 0.55 0.50 0.58 0.53 0.78 0.48 0.46 0.77 0.46 0.57 0.52 0.52. 1.32 1.55 1.39 1.59 1.94 1.57 1.30 2.18 1.23 2.21 1.43 1.33 0.48 0.46 0.46 0.44 0.48 0.49 0.48 0.47 0.46 0.37 0.51 0.44. 1.10 1.55 1.43 1.60 1.82 1.83 1.59 1.31 1.57 1.11 1.34 1.47 0.63 0.54 0.61 0.41 0.86 0.63 0.65 0.74 0.53 0.49 0.81 0.46. 0.58 0.56 0.54 0.55 0.47 0.46 0.65 0.76 0.71 0.41 0.81 0.77. 0.67 0.49 0.78 0.65 0.74 0.84 0.84 0.87 0.76 0.75 0.61 0.55. 1.51 1.53 1.61 1.30 1.93 1.59 1.65 1.93 2.86 1.58 2.12 1.95 2.39 1.34 2.71 2.09 1.83 2.94 2.89 2.54 2.43 2.01 2.65 1.70 1.70 2.08 2.51 1.38 1.25 2.17 2.56 2.46 1.84 1.30 2.43 1.59 Species Evenness (J) 0.88 0.74 0.06 0.77 0.76 0.72 0.77 0.74 0.60 0.73 0.72 0.72. 0.83 0.61 0.76 0.64 0.82 0.79 0.67 0.85 0.78 0.72 0.39 0.62. 1.94 2.18 2.14 1.84 0.16 1.36 1.23 2.10 2.12 1.89 2.01 2.81 2.30 1.90 1.32 2.10 2.01 1.40 1.92 1.67 2.37 0.54 2.29 1.64 J = H1 / In S 0.70 0.61 0.62 0.55 0.73 0.82 0.83 0.72 0.33 0.58 0.85 0.34. 2.25 1.70 2.00 0.88 1.42 2.05 1.99 2.38 0.88 1.48 0.94 0.54 0.78 0.54 0.61 0.57 0.78 0.82 0.83 0.75 0.86 0.79 0.72 0.51. 1.79 1.06 1.83 1.65 2.01 2.97 2.43 1.56 2.21 1.74 1.83 1.31 0.39 0.73 0.84 0.84 0.78 0.71 0.78 0.44 0.89 0.77 0.81 0.15. 1.00 2.71 1.76 2.38 2.82 2.29 2.72 1.43 1.74 2.37 2.02 0.24 0.76 0.54 0.51 0.66 0.70 0.72 0.74 0.82 0.71 0.40 0.69 0.63. 1.48 2.04 1.97 1.91 1.62 1.73 2.23 2.98 2.25 1.05 0.95 1.56 0.61 0.51 0.57 0.68 0.77 0.84 0.75 0.57 0.59 0.55 0.87 0.67. 1.61 1.18 2.00 2.45 2.41 2.56 2.24 1.19 1.37 1.27 2.70 2.15 0.41 0.54 0.73 0.52 0.79 0.70 0.74 0.43 0.58 0.82 0.83 0.79. 0.90 1.64 2.11 1.54 2.80 2.31 1.78 1.21 1.28 2.69 1.99 1.96. 0.34 0.60 0.51 0.56 0.72 0.59 0.69 0.48 0.63 0.76 0.73 0.49. 0.79 1.99 1.82 2.02 2.42 2.32 1.59 1.66 1.76 1.66 1.68 1.30. 0.41 0.52 0.45 0.52 0.41 0.71 0.57 0.47 0.44 0.47 0.48 0.73. 1.35 1.30 1.18 1.55 1.54 2.57 1.38 1.32 1.31 1.44 1.51 2.69. 0.46 0.54 0.51 0.43 0.59 0.60 0.57 0.75 0.63 0.43 0.47 0.43. 1.33 1.19 1.21 1.57 2.05 2.19 1.50 1.81 1.97 1.44 1.27 1.36. 0.65 0.83 0.83 0.76 0.85 0.81 0.85 0.79 0.57 0.71 0.78 0.80. 1.90 2.75 2.99 3.04 3.33 2.74 2.63 2.37 1.77 2.29 2.56 2.30. Stations Jun. 03 Jul. 03 Aug. 03 Sep. 03 Oct. 03 Nov. 03 Dec. 03 Jan. 04 Feb. 04 Mar. 04 Apr. 04 May. 04 Jun. 04 July. 04 Aug. 04 Sep. 04 Oct. 04 Nov. 04 Dec. 04 Jan. 05 Feb. 05 Mar. 05 Apr. 05 May. 05 K 2.63 0.49 0.39 0.88 0.59 0.78 0.49 1.02 0.71 1.58 1.26 1.43 2.12 0.27 0.18 0.87 0.86 0.25 1.96 0.77 0.52 1.31 0.78 2.20 L 1.39 1.05 1.19 1.36 0.58 1.40 0.70 0.66 1.60 0.93 1.70 1.26 2.14 1.09 0.38 0.83 0.30 0.90 1.78 0.92 0.72 2.92 1.23 1.53. TABLE 2 (Continued) Comparison of diversity indices at different studied stations of Lekki lagoon (June 2003-May 2005).
(7) 1.00. 5.00. 0.95. 4.00. 0.90. 3.00. 0.85. 2.00. 0.80. 1.00. 0.75. 0. A. B. C. D. E. F. G. H. I. J. K. L. (d) H1 J. Equitability (j) values. Shannon-Weaver Information (H1) and Margalef’s d. 6.00. 0.70. Stations Fig. 1. Relationships between Margalef’s d value, Equitability (j) and Shannon-Weiner Information (H1).. TABLE 3 Successional pattern of phytoplankton abundance (cells/mL) of Lekki Lagoon (Average of the totality of the stations) Months June 2003. Dominant Species Mougeotia sp. 1 (4927)*. Associated Species Chroococcus turgidus (161), Tetraspora gelatinosa (134), Microcystis aeruginosa (101).. July 2003. Mougeotia sp. 1 (1440)*. A. granulata (610), Oscillatoria germinata (595), A. islandica (431).. August 2003. Aulacoseira granulata (3439)*. A. islandica (206), A. granulata var argustissima (150), A. granulata var argustissima f. spiralis (446).. September 2003. Microcystis aeruginosa (2234)*. A. granulata var angustissma (350), A. granulata (335), Microcystis flos-aquae (246).. October 2003. A. granulata (9703)*. A. islandica (8452), A. granulata var angustissima (7350), A. granulata var angustissima f. spiralis (1084).. November 2003. A. granulata (2297)*. A. granulata var angustissima (1154), A. islandica (1431) Lyngbya hypolimnectica (323).. December 2003. **Cyanosarcina huebeliorum (1072)*. A. granulata (9576), A. granulata var angustissima (5042), A. islandica (4880).. January 2004. Microcystis aeruginosa (3469)*. A. granulata (2687), A. islandica (2346), A. granulata var angustissima (2305).. February 2004. A. granulata (4304)*. A. granulata var angustissima (3218), A. islandica (3046), A. granulata var angustissma f. spiralis(1067).. March 2004. A. granulata var angustissima (1490)* A. granulata (1450), A. islandica (1417), A. granulata var angustissma f. curvata (917).. April 2004. A. granulata (5488) *. A. islandica (3307), A. granulata var. angustissma f. spiralis (2860), A. granulata var. angus (2598).. Rev. Biol. Trop. (Int. J. Trop. Biol. ISSN-0034-7744) Vol. 60 (1): 143-155, March 2012. 149.
(8) TABLE 3 (Continued) Successional pattern of phytoplankton abundance (cells/mL) of Lekki Lagoon (Average of the totality of the stations) Months May 2004. Dominant Species Mougeotia sp.11 (3942)*. Associated Species A. granulata (3320), A. granulata var. angustissma (3320), Mougeotia sp. 1 (2829).. June 2004. A. granulata (1109)*. A. granulata var. angustissma (687), A. islandica (453), M. flos-aquae (347).. July 2004. A. granulata (8413)*. Mougetia monotaenium (722), A. islandica (603), Mougetia sp. II (588).. August 2004. A. granulata (5733)*. A. granulata var angustissma (4586), Aphanocapsa delicatissima (2788), Mougetia sp. II (409).. September 2004. Microcystis aeruginosa (1209)*. A. granulata (2747), A. islandica (2427), Chroococcus minutus (1503).. October 2004. M. aeruginosa (6053)*. A. granulata (1254), O. formosa (1079), Microcystis aeruginosa var major (1034).. November 2004. Trichodesmium lacustre (6403)*. A. granulata (5945), A. granulata var angustissma (3787), A. islandica (3132).. December 2004. M. aeruginosa (3797)*. Pseudoanabaena curta (2267), M. flos-aquae (1454), M. wesenbergii (151).. January 2005. A. granulata (9920)*. A. islandica (8526), A. granulata var angustissma (7903), A. granulata var angustissma f. spiralis (1805).. February 2005. A. granulata (2370)*. A. granulata var angustissima (2174), A. islandica (1844), Mougeotia sp. II (309).. March 2005. A. granulata (2848)*. A. islandica (2348), A.granulata var angustissma (2299), A. granulata var angustissma f. curvata (245).. April 2005. A. granulata var angustissma (2058)*. Aulacoseira granulata (2104), A. islandica (1899), Mougetia sp. II (278). May 2005. Merismopedia tennuisima (1295)*. Microcystis aeruginosa (180), Mougetia monotaenium (89), Mougetia sp. II (81).. Note: * = Phytoplankton abundance (cells/mL) ** = New species for Lagos lagoon complex.. For example, diatoms (Aulacoseira granulata and A. granulata var angustissima); blue green algae, Microcystis aeruginosa, Merismopedia tennuissima and Trichodesmium lacustre showed this trend by being the abundant species in some of these months. In the rainy season, green alga, Mougeotia sp1 dominated this season in June-July 2003 with Chroococcus turgidus, Tetraspora gelatinosa and M. 150. aeruginosa as the sub-dominant species in June while A. granulata, Oscillatoria germinata and A. islandica were sub-dominant species in July. In corresponding year (June-July 2004) the diatom, A. granutala was recorded as the dominant species with Mougeotia sp. 11, A. islandica and Microcystis flos-aquae as some of the sub-dominant species. In August 2003 and 2004 A. granulata dominated and have. Rev. Biol. Trop. (Int. J. Trop. Biol. ISSN-0034-7744) Vol. 60 (1): 143-155, March 2012.
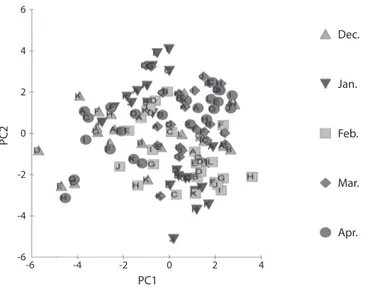
(9) Mougeotia sp. 11, Aphanocapsa delicatissima and Aulacoseira spp. as important members of the phytoplankton spectrum. M. aeruginosa remained dominant in September 2003 and 2004 while two members of the division Cyanophyta (Microcystis flos-aquae and C. minutus) were associated species in addition to Aulacoseira spp. October and November 2003 recorded Aulacoseira granulata as the dominant species while Aulacoseira spp. and Lyngbya hypolimnectica were recorded as the sub-dominant species. In October 2004, M. aeruginosa took over the succession while T. lacustre for the first time was recorded as the dominant species in November 2004. December 2003 and 2004 also recorded different cyanophytes (Cyanosarcina huebeliorum and M. aeruginosa) as the dominant species. M. aeruginosa and A. granulata were recorded as dominant species in January 2004 and 2005, respectively. For the first time A. granulata maintained the dominance throughout February to April 2004 and 2005. Mougeotia sp. 11 was dominant in May 2004 while May 2005 recorded M. tennuisima. Generally, A. granulata had variable patterns of abundance as it recorded its dominance. both in dry and wet season.The correlation values between different classes of phytoplankton and some physico-chemical parameters showed inverse relationship between Bacillariophyceae, Chlorophyceae, Euglenophyceae and Xanthophyceae with phosphate-phosphorus (Table 4). Phytoplankton dynamics from different stations showed that is being controlled by the same factors and recorded almost same species (Figs. 2 and 3).These factors according to the result generated using Primer 5 software included Phosphate-phosphorus, Nitrate-nitrogen, rainfall, pH and depth. DISCUSSION Dilution of lagoon water during the wet season and the degree of dilution and flushing depended on the amount of rainfall in the catchment areas and the attendant effects of flood waters. Flooding caused seasonal changes in the volume of water and the dilution of cations in the lagoon complex. Thomas (1966) and Biswas (1972) reported similar effects of dilution in some water bodies in Ghana. The low phytoplankton biomass in the rainy season may be due to flood water which diluted the. PO4-P. SO4. Salinity. Dissolved Oxygen. Transparency. Oil and grease. Conductivity. Chloride ion. Total suspended solids. Total dissolved solids. Bacillariophyta. 0.201. 0.328. -0.091. 0.360. 0.280. 0.167. 0.509. -0.185. 0.170. 0.682. -0.493. 0.006. Chlorophyta. 0.364. -0.054 -0.125. 0.638. 0.516. 0.083. 0.046. -0.115. 0.631. 0.121. -0.219. 0.332. Cyanophyta. -0.215 -0.152. 0.767. 0.429. -0.107. 0.107. 0.716. -0.428 -0.332 -0.008 -0.335. 0.249. Euglenophyta. -0.004. -0.345 -0.135 -0.161. 0.143. 0.119. 0.098. -0.262. 0.460. -0.189 -0.238. Xanthophyta. -0.263 -0.253 -0.139 -0.135 -0.474. 0.122. 0.207. -0.198 -0.379. 0.408. -0.148. 0.311. Chrysophyta. -0.197. 0.433. 0.340. 0.001. -0.001. 0.209. 0.644. -0.309 -0.154 -0.015 -0.120. 0.100. Dinophyta. -0.612 -0.095. 0.164. -0.071 -0.194. 0.133. 0.233. -0.248 -0.292 -0.408. -0.228. Divisions. Surface water temp.. NO3-N. TABLE 4 Correlation Coefficient (r) value of different divisions and some physico-chemical parameters in Lekki Lagoon. 0.062. Rev. Biol. Trop. (Int. J. Trop. Biol. ISSN-0034-7744) Vol. 60 (1): 143-155, March 2012. 0.496. 151.
(10) Stress: 0.28. Jun. 03. Jul. 03. Aug. 03. Sep. 03. Oct. 03. Nov. 03. Dec. 03. Jan. 04. Feb. 04. Mar. 04. Apr. 04. May 04. Jun. 04. Jul. 04. Aug. 04. Sep. 04. Oct. 04. Nov. 04. Dec. 04. Jan. 05. Feb. 05. Mar. 05. Apr. 05. May 05. Fig. 3. Phytoplankton analysis of stations G-J of Lekki lagoon throughout the sampling period using Multivariate analysis for the duration July 2003-May 2005. Note: Clustering of the symbols together indicates that there is probability of same species spreading out in different sampling sites which are then controlled by same factors.. 6. Dec. 4. Jan.. PC2. 2. Feb.. 0. -2. Mar.. -4. Apr. -6. -6. -4. -2. 0. 2. 4. PC1 Fig. 2. Principal component analysis for physico-chemical parameters in all stations of Lekki lagoon (December 2003 April 2004).. physico-chemical environment, reduced retention time, reduced transparency and flushed out phytoplankton taxa. The present observation that diatoms dominate the phytoplankton community confirms earlier reports by Imevbore (1965, 1968) and Egborge (1979) who reported 152. similar results for reservoirs of South Western Nigeria and Nwankwo (1984) for Lagos lagoon and adjacent sea. Centric diatoms were dominant almost all through each annual cycle with major floristic changes between the seasons. Centric diatoms dominance also conforms to. Rev. Biol. Trop. (Int. J. Trop. Biol. ISSN-0034-7744) Vol. 60 (1): 143-155, March 2012.
(11) Nwankwo (1984) who reported that Melosira was the dominant species in Lagos lagoon and the adjacent sea. The dominance of centric diatoms most especially Aulacoseira granulata could be an indication that Aulacoseira species needed low salinity level to thrive, since an increased salinity value especially in September 2003, favored the blue green algae during which highest relative abundance (96.7%) was recorded with Microcystis aeruginosa recording 95.5% out of the total (96.7%), this indicated that salinity range of 0.85-1.05mg/L probably favored M. aeruginosa and not Aulacoseira sp. In general, pH value recorded in this study highly favored A. granulata which remained dominant at most of the time and this supported Talling (1986) report, who by using data collected from some central African lakes suggested that the effects of pH and alkalinity in lake waters may be reflected in the occurrence of some species such as A. granulata. The phytoplankton community and the physio-chemical parameters exhibited seasonal changes closely related to the pattern of rainfall. According to Egborge (1974) and Tezuka (1984), seasonal fluctuation in abundance of phytoplankton is influenced by changes in the physical and chemical properties of the water, which themselves can be dependent on rainfall. Differences in abundance of most species during the two seasonal cycles could be attributed to significant variations in the physicochemical variables and nutrients levels within these periods. This probably explained the successional pattern of the phytoplankton taxa, which showed that between September and December 2004, the blue green dominated the phytoplankton spectrum, living Aulacoseira spp. to be sub-dominant among the blue green that dominated the phytoplankton spectrum in one month; or the other during this study were, Cyanosarcina huebeliorum (December 2003) which is a new record for Lagos lagoon complex Merismopedia tennuissima (May 2005), Trichodesmium lacustre (November 2004) and M. aeruginosa that recorded its abundance in many occasions while Mougeotia sp. 1 dominated in June and July 2003 and May 2004.. All the green and blue green algae showed dominance in the wet season, when the nitrate level was high, except for M. aeruginosa that appeared in both seasons but most abundantly in wet. The increase and decrease of phytoplankton populations and the replacement of one form by another throughout the season is controlled by the varying environmental parameters such as Phosphate-phosphorus, Nitrate-nitrogen and rainfall. Influence of the sea on phytoplankton of Lekki lagoon is not significant, because is fresh all year through and is not close to the sea as Lagos lagoon. ACKNOWLEDGMENT We acknowledge the Fulbright program for the scholarship awarded to Adesalu T.A. and Prof. Rex Lowe of Bowling Green State University Ohio, U.S.A for his assistance. RESUMEN La costa oeste de África se caracteriza por la dominancia de lagunas, como ambientes de agua dulce tienen un gran valor, en donde el fitoplancton constituye la base de las cadenas tróficas acuáticas. Con el objetivo de conocer el efecto de las variables ambientales en el fitoplancton, se llevó a cabo un estudio sucesional mensual del fitoplancton, en la laguna Lekki, durante dos años (junio 2003-mayo 2005). En 12 estaciones, se obtuvieron muestras de fitoplancton mediante una red de plancton que tiene una malla de 55μm, que posteriormente fueron preservadas en formalina al 4%. Además, se tomaron muestras de agua superficial, para análisis físico-químico. En cada año, la distribución estacional y la sucesión de fitoplancton dominante siguieron patrones diferentes. La abundancia de fitoplancton fue mayor durante la estación seca (noviembre-abril) durante los dos ciclos anuales. Esta misma tendencia la presentaron las diatomeas (Aulacoseira granulata y A. granulata var angustissima) y las algas verde azules, además de Microcystis aeruginosa, Merismopedia tennuissima y Trichodesmium lacustre, las mismas fueron especies abundantes en algunos de estos meses. En la temporada de lluvias, el alga verde Mougeotia sp. fue la que dominó. La sustitución de una forma por otra a lo largo de los ciclos estacionales fue controlada probablemente por los cambios en las variables ambientales como la lluvia, el nitrato y fósfato. Palabras clave: fitoplancton, laguna tropical, aguas someras, Laguna Lekki, cambios estacionales.. Rev. Biol. Trop. (Int. J. Trop. Biol. ISSN-0034-7744) Vol. 60 (1): 143-155, March 2012. 153.
(12) REFERENCES Adeniji, H.A. 1971. Preliminary investigation into composition and seasonal variation of plankton in the Kainji Lake, Nigeria. Abstract International Symposium on Manmade lakes. Ackermann, White and Worthington, 617-619. Adesalu, T.A. 2007. Phytoplankton dynamics in relation to water quality indices in Lekkki lagoon, Lagos. Ph.D. Thesis, University of Lagos, Lagos, Nigeria.. Holden, M.J. & J. Green. 1960. The hydrology and plankton of the River Sokoto. J. Anim. Ecol. 29: 65-84. Hustedt, F. 1937. Die Kieselalgen Deutschlands, Österreichs und der Schweiz unter Berücksichtigung der übrigen Länder Europas sowie der angrenzendenn Meeresgebiete, p. 609-920. In L. Rabenhorst (ed.). Kryptogamen Flora von Deutschland, Österreich und der Schweiz, Fischer, Stuttgart, Germany.. Adesalu, T.A. & D.I. Nwankwo. 2009. A checklist of Lekki lagoon diatoms. Int. J. Bot. 5: 126-134.. Hustedt, F. 1942. Susswasser-Diatomeen des indomalayischen Archipels und der Hawaii-Inslen. Int. Rev. Hydrobiol. 42: 1-252.. APHA. 1998. Standard Methods for the Examination of Water and Wastewater. American Public Health Association, Washington D.C., USA.. Hustedt, F. 1971. Kryptogamen-flora von Deutschland, Österreichs un der Schweiz. A Kademiscehe Vergasell Schaft M.L.H., Leipzing, Germany.. Bainbridge, R. 1972. The zooplankton of the Gulf of Guinea. Bull. Mar. Ecol. 8: 61-87.. Imevbore, A.M.A. 1965. A preliminary check-list of the planktonic organism of Eleiyele reservoir, Ibadan, Nigeria. J. West Afric. Sci. Assoc. 10: 156-160.. Barnes, R.S.K. 1980. Coastal lagoons. Cambridge University, London, England. Biswas, S. 1972. Ecology of phytoplankton of the Volta Lake. Hydrobiology 39: 277-288. Clarke, K.R & R.N. Gorley. 2001. PRIMER v5: User manual/Tutorial. Primer-e, Plymouth, England. Dahlin, J., S. Hess, P. Duncan & C.B. Powell. 1985. Composition of the Phytoplankton and zooplankton communities of the Niger Delta. Proc. International Seminar on the petroleum industry and the Nigerian environment, Kaduna, Nigeria. Eaton, J.W. 1966. Algal investigations. The first scientific report of the Kainji Biological Research Team 8-16. White, Liverpool, England. Egborge, A.B.M. 1973. A preliminary checklist of the phytoplankton of Oshun River, Nigeria. Freshwater Biol. 4: 569-572. Egborge, A.B.M. 1974. The seasonal variation and distribution of phytoplankton in the Oshun River, Nigeria. Freshwater Biol. 4: 177-191. Egborge, A.B.M. 1979. The effect of impoundment on the phytoplankton of the Oshun River, Nigeria. Nova Hedwigia 31: 401-417. Hill, M.B. & J.E. Webb. 1958. The ecology of Lagos lagoon II. The topography and physical features of Lagos harbour and Lagos lagoon. Phil. Trans. R. Soc. Lond. 241: 319-417.. 154. Imevbore, A.M.A. 1967. Hydrology and Plankton of Eleiyele reservoir, Ibadan, Nigeria. Hydrobiology 30: 154-176. Imevbore, A.M.A. 1968. Planktonic algae of Eleiyele reservoir, Nigeria. J. Sci. 2: 85-90. Imevbore, A.M.A., O.S. Adegoke & A.S. Rogers. 1969. Physical and chemical properties of the Ikogosi warm water spring, Western Nigeria. Nig. J. Mining Geol. 4: 69-81. John, D.W & G.S. Robert. 2003. Freshwater algae of North America, ecology and classification. Academic, San Diego California, USA. Kadiri, M.O. 1999. Phytoplankton distribution in some coastal waters of Nigeria. Nigerian J. Bot. 12: 51-62. Komarek, J. & B. Fott. 1983. Chlorophyceae. Chlorococcales, p. 1044. In G. Huber-Pestalozzi (ed.). Das Phytoplankton de Süsswassers, Systematik u. Biologie, Teil.1 Stuttgart, Germany. Komarek, J. & K. Anagnostidis. 1998. Cyanoprokaryota 1. Teil: Chroococcales, p. 548. In H. Ettl, G. Gärtner, H. Heynig & D. Mollenhauer (eds.). Süsswasserflora von Mitteleuropa 19/1. Fischer, Stuttgart, Germany. Komarek, J. & K. Anagnostidis. 2005. Cyanoprokaryota 2. Teil/ 2nd Part: Oscillatoriales, p. 759. In B. Budel, L. Krienitz, G. Gärtner & M. Schagerl (eds.). Süsswasserflora von Mitteleuropa 19/2. Elsevier, Heidelberg, Germany.. Rev. Biol. Trop. (Int. J. Trop. Biol. ISSN-0034-7744) Vol. 60 (1): 143-155, March 2012.
(13) Krammer, H. & H. Lange-Bertalot. 1986. Süßwasserflora von Mitteleuropa. Band 2. Bacillariophyceae. Teil 1. Naviculaceae. Fischer, Stuttgart, Germany.. Patrick, R. & C.W. Reimer. 1966. The diatoms of the United States exclusive of Alaska and Hawaii. Acad. Nat. Sci. Phil.. Krammer, H. & H. Lange-Bertalot. 1988. Süßwasserflora von Mitteleuropa. Band 2. Bacillariophyceae. Teil 2. Bacillariaceae, Epithemiaceae, Surirellaceae. Fischer, Stuttgart, Germany.. Patrick, R. & C.W. Reimer. 1975. The diatoms of the United States (exclusive of Alaska and Hawaii). Monographs. Acad. Nat. Sci. Phil.. Krammer, H. & H. Lange-Bertalot. 1991a. Süßwasserflora von Mitteleuropa. Band 2. Bacillariophyceae. Teil 3. Centrales, Fragilariaceae, Eunotiaceae. Fischer, Stuttgart, Germany. Krammer, H. & H. Lange-Bertalot. 1991b. Süßwasserflora von Mitteleuropa. Band 2. Bacillariophyceae. Teil 4. Achnanthaceae, Kritische Ergänzungen zu Navicula (Lineolatae) and Gomphonema. Fischer, Stuttgart, Germany. Krammer, H. & H. Lange-Bertalot. 2000. Süßwasserflora von Mitteleuropa. Band 2/5. Bacillariophyceae. Part 5. English and French Translation of the Keys. Fischer, Stuttgart, Germany. Kusemiju, K. 1973. A study of catfishes of Lekki lagoon with particular reference to species of Chrysichthys walkeri (Bagridae). Ph.D. Thesis University of Lagos, Lagos, Nigeria. Kusemiju, K. 1976. Distribution, reproduction and growth of the catfish Chrysichthys walkeri (Gunther) in the Lekki lagoon, Nigeria. J. Fish. Biol. 8: 453-458. Marc, B., B. Ngansoumana, K. Samba, S. Seyni, P. Marc & A. Robert. 2006. Phytoplankton community structure and species assemblage succession in a shallow tropical lake (Lake Guiers, Senegal). Aq. Microb. Ecol. 45: 147-161. Margalef, D.R. 1970. Perspective in Ecological Theory. University of Chicago, Illinois, USA. Nwankwo, D.I. 1984. Seasonal changes of phytoplankton of Lagos lagoon and the adjacent sea in relation to environmental factors. Ph.D. Thesis, University of Lagos, Lagos, Nigeria. Nwankwo, D.I. 1993. Cyanobacteria bloom species in coastal waters of South-western Nigeria. Archiv. Hydrobiol. 90: 553-542. Nwankwo, D.I. 1996. Phytoplankton diversity and succession in Lagos lagoon, Nigeria. Archiv. Hydrobiol. 135: 529-542. Nwankwo, D.I. 2000. Seasonal variation in estuarine litoral diatom population in Lagos lagoon, Nigeria. J. Pure Appl. Sci. 3: 29-38.. Pielou, E.C. 1975. The measurement of diversity to different types of biological collections. J. Theor. Biol. 13: 131-144. Powell, C.B. & A.C. Chindah. 1986. Variations in phytoplankton communities and densities along the middle and upper reaches of the Bonny/New Calabar estuary. Man and Biosphere Workshop on Wetlands in Niger Delta Port-Harcourt, Nigeria. Prescott, G.W. 1961. Algae of the western Great Lakes area with an illustrated key to the genera of desmids and freshwater diatoms. Brown, Iowa, USA. Prescott, G.W. 1973. Algae of the Western Great Lakes Area. Brown, Iowa, USA. Prescott, G.W. 1982. Algae of the Western Great Lakes area with an illustrated key to the genera of desmids and freshwater diatoms. Brown, Iowa, USA. Round, F.E. 1981. The ecology of algae. Cambridge University, London, England. Shannon, C.E. & W. Weiner. 1973. The mathematical theory of communication. University of Illionois, Illinois, USA. Solarin, B.B. 1998. The hydrobiology, fishes and fisheries of the Lagos lagoon, Nigeria. Ph.D. Thesis, University of Lagos, Lagos, Nigeria. Talling, J.F. 1986. The seasonality of phytoplankton in African lagoons. (The Useu lakes in Morocco and South Africa). Hydrobiology 138: 139-160. Tezuka, Y. 1984. Seasonal variations in the dominant phytoplankton. Chlorophyll a and nutrient levels in the pelagic regions of Lake Biwa. Jap. J. Limnol. 45: 126-137. Thomas, J.D. 1966. Some preliminary observations on the fauna and flora of a small Man-made lake in the West Africa savannah. Bull. Inst. Fondam. Afrique Noire Sci. Nat. 28: 542-562. Webb, J.E. & M.B. Hill.1958. The Ecology of Lagos Lagoon. IV. On the reactions of Branchiostoma nigeriense Webb to its environment. Phil. Trans. R. Soc. Lond. 241: 355-391. Wolowski, K. & F. Hindak. 2005. Atlas of Euglenophytes. Slovak Acad. Sci., Cracow, Poland.. Rev. Biol. Trop. (Int. J. Trop. Biol. ISSN-0034-7744) Vol. 60 (1): 143-155, March 2012. 155.
(14)
(15)
Figure
Documento similar
“The Keynesian hypothesis that investment…can be treated as an independent variable…together with the assumption of full employment, also implies that the level of prices in
An increased risk of acute myocardial infarction and heart failure is observed with all NSAIDs, while an elevated risk of hemorrhagic stroke appears to be restricted to the use
We test these features on an unsupervised classification (clustering) task, and show that they outperform primitive (low-level) features, and that have performance comparable to that
Citrus trees are strongly affected by salinity, especially in countries where irrigation is required as a semi-arid Mediterranean agronomic region. The aims of the study were i)
The Galapagos Petrel Pterodroma phaeopygia would likely be the species most sensitive to increased mortality as a result of collision, with the risk being
Method: This article aims to bring some order to the polysemy and synonymy of the terms that are often used in the production of graphic representations and to
1) Relatively low salinity and cool waters of the early Paleocene ocean conversed into warm and high salinity waters of the late Paleocene. The first assumption confirmed
The Dipilio fish remains were dark in color, an observation that could have led to a biased conclusion of burnt bones, especially since the archaeological material
