PV installation on building rooftops and façades in Chile : technical and economic potential
76
0
0
Texto completo
(2) PONTIFICIA UNIVERSIDAD CATOLICA DE CHILE ESCUELA DE INGENIERIA. PV INSTALLATION ON BUILDING ROOFTOPS AND FAÇADES IN CHILE: TECHNICAL AND ECONOMIC POTENTIAL. JOAQUÍN ESTEBAN MOLINA. Members of the Committee: DAVID EDUARDO WATTS CASIMIS HUGH RUDNICK VAN DE WYNGARD YARELA FLORES ARÉVALO GUILLERMO THENOUX ZEBALLOS Thesis submitted to the Office of Research and Graduate Studies in partial fulfillment of the requirements for the Degree of Master of Science in Engineering.. Santiago de Chile, Agosto, 2014.
(3) (A mi Madre y Abuela que han sido mi apoyo durante todos mis años de estudio, a mis amigos y profesores que me han enseñado día tras día.). ii.
(4) AGRADECIMIENTOS Agradezco al profesor David Watts Casimis por haber apoyado el desarrollo de mi tesis, con correcciones periódicas. Agradezco a mis compañeros de trabajo Rodrigo Pérez Odeh, Marcelo Valdés, Vicente Villalón, Constanza Albornoz y Danilo Jara por compartir información y gratos momentos de trabajo, en nuestras desveladas para avanzar con los proyectos y tesis. Un gran agradecimiento a Maida, Isa y Patrick por revisar rápidamente mi traducción al inglés en cada paper. Agradezco a la empresa Happy Volt que colaboró con instrumentos para adquirir datos incluidos en esta tesis, a Vilma Morales y su familia, por permitirme llenar de cables su hall de entrada, a Eduardo Cea del laboratorio de máquinas de la Universidad que me brindó consejos cuando más los necesitaba, al profesor JEC por su amistad y a todos mis amigos que han estado constantemente acompañándome. Un especial agradecimiento a mi madre Claudia Molina, abuela Zina Mossert y polola Ariany Da Silva que respetaron mis tiempos y me apoyaron durante los momentos de confusión.. iii.
(5) INDEX. Pag. CONTENT DEDICATORIA........................................................................................................... ii AGRADECIMIENTOS .............................................................................................. iii TABLES. ..................................................................................................................... vi FIGURES. ................................................................................................................. viii RESUMEN .................................................................................................................. xi ABSTRACT ............................................................................................................... xii 1.. PV INSTALLATION ON BUILDING ROOFTOPS AND FAÇADES IN CHILE: TECHNICAL AND ECONOMIC POTENTIAL ............................................... 1 1.1. INTRODUCTION ...................................................................................... 1 1.1.1. Methodology and data sources ........................................................ 3 1.2. CHILEAN SOLAR RESOURCES AND POLICY ................................... 4 1.2.1. Annual radiation by district in Chile................................................ 6 1.2.2. Population, population density and buildings by region .................. 7 1.2.3. Chilean electricity rates ................................................................... 8 1.3. ROOFTOP PV PROJECTS AND ENERGY CAPTURED AS FUNCTION OF MOUNTING ANGLES ........................................................................... 10 1.3.1. Captured radiation and energy production in different façade orientations ............................................................................................... 12 1.4. RESULTS: CALCULATION OF ECONOMIC INDICATORS ............ 16 1.4.1. Levelized cost of electricity (LCOE) for PV projects ................... 16 1.4.2. Effect of the size of the project ...................................................... 18 1.4.3. Comparing LCOE for PC projects with electricity rates ............... 18 1.4.4. Payback of PV projects .................................................................. 21 1.5. CONCLUSIONS ...................................................................................... 24.
(6) 2.. RESIDENTIAL PV ROOFTOP INSTALLATION IN CHILE: TECHNICAL AND ECONOMIC POTENTIAL .............................................................................. 27 2.1. INTRODUCTION .................................................................................... 27 2.1.1. Methodology and data sources ...................................................... 29 2.2. CHILEAN SOLAR RESOURCES AND POLICY ................................. 30 2.2.1. Annual radiation by districts in Chile ............................................ 32 2.2.2. Population, population density and houses by region.................... 33 2.2.3. Chilean electricity rates and policy ................................................ 34 2.3. ROOFTOP PV PROJECTS AND ENERGY CAPTURED AS FUNCTION OF MOUNTING ANGLES ........................................................................... 37 2.3.1. Effect of the orientation and tilt angle on the total incident radiation38 2.3.2. PV modules installed on tilted roofs .............................................. 42 2.3.3. PV generation and consumption .................................................... 44 2.4. RESULTS: CALCULATION OF ECONOMIC INDICATORS ............ 46 2.4.1. Tilt and orientation that maximizes PV generation throughout different Chilean districts ............................................................................. 46 2.4.2. Payback for different districts in Chile .......................................... 47 2.4.3. LCOE for different districts in Chile ............................................. 49 2.4.4. LCOE, Payback, Max investment cost and IRR colored maps. .... 53 2.5. CONCLUSIONS ...................................................................................... 56. ACKNOWLEDGEMENTS ....................................................................................... 58 BIBLIOGRAPHY ...................................................................................................... 59 A P P E N D I X ......................................................................................................... 62 Anex A: Submited mail confirmation ........................................................................ 63.
(7) TABLES. Pag. TABLE 1:. RADIATION. (2010),. POPULATION. (2009)/BUILDINGS, POPULATION. DENSITY FOR. DISTRICTS AT ALL REGIONS OF CHILE (Universidad de Chile, s.f.), (INE, 2012) ................ 7 TABLE 2: NON-RESIDENTIAL ENERGY RATES (BT2) FOR DISTRICTS BY REGION. AVERAGE, MAX, MIN IN $USD AND $CLP. (ORDERED BY RATE) VAT INCLUDED ............................ 9 TABLE 3: LOCATION, LCOE AND RATES EXAMPLE FOR UNDERSTANDING FIG. 1-10 ......... 20 TABLE 4: ANNUAL. GENERATION, NON-RESIDENTIAL RATES AND LEVELIZED COST. CONSIDERING 2.000 $USD/KWP INITIAL INVERSION, 15,4% EFFICIENCY PANNELS, DISCOUNT RATE OF. 10%, 1% OF ANNUAL GENERATION DECAY, 1% COST IN ANNUAL MAINTENANCE. .......................................................................................................................................... 22 TABLE 5: RADIATION, NON-RESIDENTIAL RATES AND PAYBACK PERIOD (BT2 ENERGY RATE) CONSIDERING:. 2.000 $USD/KWP INITIAL INVERSION, 15,4% EFFICIENCY PANELS, WITHOUT. DECAY IN ANNUAL GENERATION ....................................................................................... 24. TABLE 6: RADIATION, POPULATION, POPULATION DENSITY FOR DISTRICTS AT ALL REGIONS OF CHILE (Universidad. de Chile, s.f.), (INE, s.f.) ............................................................. 34. TABLE 7: NON-RESIDENTIAL DISTRICTS BY REGION.. ENERGY RATES. (BT2). AND RESIDENTIAL RATES. (BT1). FOR. AVERAGE, MAX, MIN IN $USD AND $CLP. (ORDERED BY RATE). VAT INCLUDED................................................................................................................. 36 TABLE 8: MAXIMUM SURFACE USED FOR EACH SEGMENT OF AVAILABLE ROOF CONSIDERING FRONT AT NORTH ............................................................................................................... 42. vi.
(8) TABLE 9: LOCATION, LCOE AND RATES EXAMPLE FOR UNDERSTANDING FIG. 2.4-3 ........ 50 TABLE 10: 35 DISTRICTS OF CHILE. CODE PRESENTED BY REGION AND DISTRICT CODE .... 55. vii.
(9) FIGURES. Pag. Fig. 1-1: Side facade with PV project installed.................................................................. 1 Fig. 1-2: Chilean resources – (a) GHI, (b) energy-only rate, (c) retail rate, (d) population and (e) buildings ................................................................................................................. 5 Fig. 1-3: Daily average GHI monthly 2010 in Chile by districts ....................................... 6 Fig. 1-4: Ratio of incident radiation received to maximum at optimal mounting: from tilt angle 0° (horizontal) to 90° (vertical) and orientation from 90° (East) to 270° (west) compared to the maximum radiation received (𝛼 = 27° 𝛾 = 180°) in Peñalolén District .......................................................................................................................................... 12 Fig. 1-5: Optimal PV mounting in flat rooftops in Santiago: a) orientation at N, S, W, E and b) SW, NW, NE and SE ............................................................................................ 14 Fig. 1-6: (a) Comparison of radiation captured by 1 kWp PV panels on different façade orientations in Peñalolén. (b) 10 kWp PV panels mounted on different façade orientations in a building ..................................................................................................................... 14 Fig. 1-7: (a) Horizontal PV panel: comparison of load consumption and photovoltaic generation (b) West oriented PV panel: Comparison of load consumption and photovoltaic generation (c) East oriented PV panel: comparison of load consumption and photovoltaic generation (d) Daily Generation and consumption by east and west orientations ........... 15 Fig. 1-8: PV project economic analysis 2.000 and 3.000 $USD/kW – a,b) LCOE, c,d)payback, e) grid-parity investment cost per MW and f,g) IRR.................................. 17 viii.
(10) Fig. 1-9: Districts whose levelized cost is lower than energy rate BT2 for investment of 2.000 $USD/kW and 10% discount rate (district name; 𝐿𝐶𝑂𝐸2.000) ............................ 20 Fig. 1-10: Comparison between non-residential rates (BT2 energy rates), levelized cost with 2.000 $USD/kWh investment, residential rates (BT1 retail rates) and non-residential rates (BT2) in Chile by region ......................................................................................... 21 Fig. 1-11: Payback histogram -project 2,000 $USD/kW considering energy only rates (BT2 energy rates)............................................................................................................ 23 Fig. 2.1-1: Rooftop PV project examples......................................................................... 27 Fig. 2.2-1: Chilean resources - (a) GHI, (b) energy-only rate, (c) retail rate, (d) population, (e) Houses......................................................................................................................... 31 Fig. 2.2-2: Daily average GHI monthly 2010 in Chile by districts .................................. 33 Fig. 2.2-3: Energy-only and residential rates .................................................................. 35 Fig. 2.3-1: Tilted roof, horizontal roof and facade mounting PV projects....................... 38 Fig. 2.3-2: Sampling different residential neighborhoods roof slopes in Peñalolén ....... 39 Fig. 2.3-3: Observed roof slopes in Peñalolén (District code # 13122) ........................... 39 Fig. 2.3-4: different house orientation ............................................................................. 40 Fig. 2.3-5: Ratio of radiation received to maximum: from tilt angle 0° (horizontal) to 90° (vertical) and orientation from 90° (East) to 270° (west) compared to the maximum radiation received (α=27° γ=180°) ................................................................................... 41 Fig. 2.3-6: PV projects: PV panels and inverter............................................................... 43 Fig. 2.3-7: Protection, meter, load and connection to the grid ......................................... 43 ix.
(11) Fig. 2.3-8: generation curve for West and East PV module installation .......................... 44 Fig. 2.3-9: generation curve for Summer and winter for a north PV module installation .......................................................................................................................................... 45 Fig. 2.4-1: (a) Tilt and azimuth angles for maximum radiation capture by districts in Chile, (b) radiation gain with respect to GHI for optimum angles ............................................. 47 Fig. 2.4-2: Payback range for coast and central districts in Chile.................................... 48 Fig. 2.4-3: Levelized cost and energy rates for different PV project cost (a) 2.000 USD/MW, (b) 2.500 USD/MW, (c) 3.000 USD/MW ..................................................... 50 Fig. 2.4-4: Districts whose levelized cost is lower than energy rate BT2 for investment of 2.000 $USD/kW and 10% discount rate (district name; 𝐿𝐶𝑂E 2.000) ............................ 52 Fig. 2.4-5: Districts whose LCOE is lower than residential rates (for investment from 2.000 to 3.000 USD/MW and 10% of discount rate) ....................................................... 53 Fig. 2.4-6: PV project economic analysis 2.000 and 3.000 $USD/kW– a,b) LCOE1500 and LCOE3000 (minimum per region) $USD/kW, c,d)payback, e) grid-parity investment cost $USD per MW and f,g) IRR ..................................................................................... 54. x.
(12) RESUMEN El potencial económico en techos y fachadas para proyectos fotovoltaicos en Chile ha sido estudiado analizando la radiación, generación de electricidad a partir de la instalación fotovoltaica, curvas de consumo eléctrico y tarifas eléctricas de 318 comunas a lo largo de Chile. El estudio considera curvas de generación fotovoltaica para diferentes orientaciones e inclinaciones en techos y fachadas. El sector de Chile con el mayor potencial técnico económico para instalaciones fotovoltaicas se encuentra en la región de atacama, que combina altos niveles de precios eléctricos y altos niveles de radiación. Este estudio indica que Chile es uno de los países privilegiados en Latinoamérica en donde la instalación de proyectos fotovoltaicos en techos es costo-efectivo sin necesidad de políticas de incentivos o subsidios. El período de retorno de inversión para proyectos fotovoltaicos ubicados en techos para un costo de inversión de 2.000 USD/kW varía desde los 7.7 años a más de 20 años. Por el contrario, a los precios actuales los proyectos fotovoltaicos instalados en fachadas no son costo-eficientes en ninguna región, considerando sólo los ingresos por energía generada.. Palabras Claves: (Fotovoltaico, Sistema fotovoltaico en techo, Costo Nivelado de energía, Paridad con la red, Chile, Radiación.). xi.
(13) ABSTRACT The economic feasibility of rooftop and façade PV projects in Chile has been studied by analyzing solar radiation, PV electricity generation, electricity consumption profiles, and electricity rates from 318 districts throughout Chile. The study considers PV module electricity generation curves with different inclinations and orientations on both rooftops and building façades. The sector of Chile with the highest technical and economic potential for PV installation is located in the Atacama region, which has high-electricity rates and high solar radiation. This study found that Chile is one of the privileged countries in Latin America in which rooftop PV projects are cost-effective without incentive policies and/or subsidies. The payback period for rooftop PV projects with an investment cost of $2.000/kW varied from 7,7 to more than 20 years. Conversely, at current PV prices, Façade PV projects are found to be non-cost-effective in all regions when only their energy value is considered.. Keywords: Photovoltaic; Roof-top PV System; LCOE; Grid Parity; Chile; Radiation. xii.
(14) 1. 1. PV INSTALLATION ON BUILDING ROOFTOPS AND FAÇADES IN CHILE: TECHNICAL AND ECONOMIC POTENTIAL 1.1. INTRODUCTION Chile is characterized by an increasing need for cost-effective energy and very high solar irradiation levels. This combined with photovoltaic (PV) technology development worldwide and consistently decreasing PV cost has led to strong interest in implementing PV generation in Chile. In some countries the deployment of PV systems on the ground has led to heated debate on land use. In Italy, for example, installation of PV systems on agricultural soil was forbidden in 2012 (Tudisca, Di-Tripani, Sgroi, Testa, & Squatrito, 2013). Under these circumstances, rooftop PV systems, as a prospective alternative to greenfield PV development, has drawn increasingly more attention. As a result, there has been an increasing need to identify the generation potential of rooftop and façade PV systems, and evaluate the economic benefits that could be obtained for a specific region, city, or country, providing enough information for investors, and supporting material for regulators to develop incentives and appropriate policies.. Fig. 1-1: Side facade with PV project installed.
(15) 2. Several analyses of rooftop PV systems in European countries have been published. They are often focused on generation potential or investment costs. They provide useful information of the future of the technology in some countries, such as Italy and Germany, among others (Tudisca, Di-Tripani, Sgroi, Testa, & Squatrito, 2013) (SchallenbergRodríguez, 2013) (Spertino, Di Leo, & Cocina, 2013). In addition to analyzing the technical components of PV systems (modules, inverters, protections, etc.), the technical and economic analysis PV systems for buildings and façades (see Fig. 1-1) requires information about radiation, electricity tariffs, consumption profiles, incentive policies and construction codes, which may vary by city or county. Specific knowledge of local conditions is crucial. With the support of the Chilean Construction Chamber (Cámara Chilena de la Construcción, or CChC) and the Chilean Photovoltaic Node1, an extensive evaluation of different photovoltaic projects over 318 major districts was performed, identifying the most profitable sites for PV development considering the initial investment and local electricity tariffs for different PV projects, including roofs and façades. This paper summarizes the findings of this project.. 1. Organization of main PV developers, government energy officials and universities focused on strengthening the technological. networks and the development of distributed PV generation in Chile. source: http://www.cdt.cl/2012/05/CDT-lanza-NodoFotovoltaico/.
(16) 3. 1.1.1. Methodology and data sources Technical and economic evaluation of rooftop PV potentials for each of the 318 counties required the following: 1) Having some knowledge of the location, population, housing styles, etc. Housing styles and building number for each county are based on the Chilean CASEN survey (MIDEPLAN, 2014), while population data were obtained from the last national census (2009) (INE, 2012) (Ministerio del Interior, 2014). 2) Obtaining hourly solar irradiation series from the Chilean solar map2 . For an alternative method to develop this step see (Mellit, Eleuch, Benghanem, Elaoun, & Pavan, 2010). 3) Obtaining local electricity rate structure and tariff values (CHILECTRA, 2009) for each utility in the area (from each company website), 4) Computing solar incident radiation according to the inclination and orientation angles of the system, (and according to the possibilities given by roof angles). The solar irradiation model to compute the incident radiation on the roofs is based on (Duffie & Beckman, 1991) and it was codded in MATLAB. 5) Computing generation from a typical PV project. 6) Obtaining some example electricity consumption profiles. Since Chile does not have publicly available electricity consumption profiles by customers, a short-term metering campaign was performed to develop representative. 2. Chilean irradiation data: http://walker.dgf.uchile.cl/Explorador/Solar2/.
(17) 4. profiles. Extrapolation to the rest of the year was performed using typical consumption days adjusted by the monthly billing information. Local electricity consumption profiles were measured for 6 typical clients (a cinema, a residential apartment, an office apartment, a small house, a medium house and a professional institute). In addition 12 different building load profiles were collected using university energy meters, these profiles are assumed to be invariant regardless the city. Depending on solar irradiation, electricity consumption profiles, orientation and availability of area on the building, a PV project was designed and optimized for each building profile type. 7) Comparing building consumption and PV generation for every 5-min period of the year to assess electricity consumption from the grid versus surplus electricity injected into the grid, which sometimes carries different prices. 8) Selecting the proper PV project investment cost. 9) Finally, computing levelized costs of electricity (LCOE), payback periods, and internal rate of returns as economic performance measures of the project. 1.2. CHILEAN SOLAR RESOURCES AND POLICY PV project economic feasibility on buildings is closely related to the population density of the area and its radiation. Buildings are usually located in densely populated areas, which usually have lower electricity retail rates due to economies of scale perceived by the utilities, reducing a PV projects economic feasibility. Conversely, higher radiation yields more electricity generation and more income for a given PV investment. In general, higher solar radiation in Chile is found in less populated areas (see Fig. 1-2). Solar,.
(18) 5. financial and other resources are presented through maps by districts similar to (Bergamasco & Asinari, Scalable methodology for the photovoltaic solar energy potential assessment based on available roof surfase area: Application to Piedmont Region (Italy), 2011 b) . Energy-only rate (BT2 energy rate). GHI 2010 XV 2.509. XV 58. I 2.464. III 2.187. VII 1.857. IX 1.554. XIV 1.360. III 63. III 105. XI 969 XII 833. IV 69. V 59 VI 60 VIII 57. RM 51 (XIII) VII 62 IX 56. XIV 57. X 1.222 3.000. (a). II 96. IV 2.126 RM 2.072 (XIII). 2.760 2.520 2.280 2.040 1.800 1.560 1.320 1.080 840 600 360 120 0. I 307. I 100. II 57. X 60 XI 87 XII 53. (b). V 107 VI 104 VIII 102. >200 188 176 164 152 140 128 116 104 92 80 68 56 <50. II 568 III 279. IV 124 RM 86 (XIII) VII 117 IX 100. XIV 106. V 1.740 VI 875 VIII 2.026. RM 6.815 (XIII) IV 708. VII 1.000 IX 962. XIV 378. X 826. X 117 XI 104. XI 163. XII 158. XII 102. (c). Buildings. XV 186. XV 108. I 54. II 2.438. V 1.962 VI 1.955 VIII 1.759. Retail rate Population (BT1 energy & power rate). (d). > 800 736 672 608 544 480 416 352 288 224 160 96 32 <1. (e). Fig. 1-2: Chilean resources – (a) GHI, (b) energy-only rate, (c) retail rate, (d) population and (e) buildings.
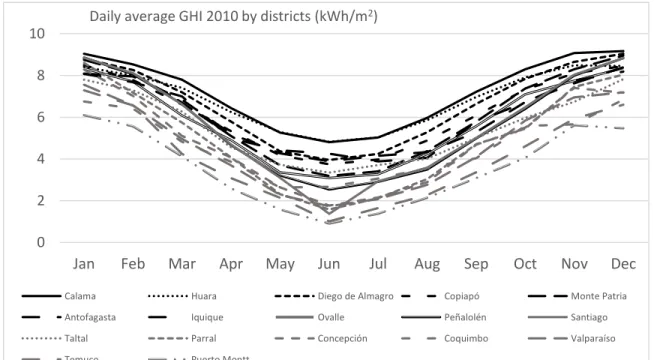
(19) 6. 1.2.1. Annual radiation by district in Chile High radiation is crucial for the economic feasibility of PV projects. The solar resource in Chile is quite high in northern areas (one of the world’s highest) and decreases towards central and southern Chile, showing a large variability throughout the country (from 730 to 2.676 kWh/(m2 yr)), while for any specific site the annual radiation varies on average less than 7% through the years (Universidad de Chile, s.f.). The annual radiation obtained for year 2010 is shown in Fig. 1-2. Sites with radiation levels over 2.000 𝑘𝑊ℎ/(𝑚2 𝑦𝑟) are attractive for PV projects and they are available in over a half of the districts. Solar radiation is highly seasonal, daily averages for Global Horizontal Irradiance (GHI) for each month are presented in Fig. 1-3. During winter months in the southern areas GHI is much smaller than summer ones, while in northern areas the variation in GHI is much more limited. Daily average GHI 2010 by districts (kWh/m2) 10 8 6. 4 2. 0. Jan. Feb. Mar. Apr. May. Jun. Jul. Aug. Sep. Oct. Nov. Dec. Calama. Huara. Diego de Almagro. Copiapó. Monte Patria. Antofagasta. Iquique. Ovalle. Peñalolén. Santiago. Taltal. Parral. Concepción. Coquimbo. Valparaíso. Temuco. Puerto Montt. Fig. 1-3: Daily average GHI monthly 2010 in Chile by districts.
(20) 7. 1.2.2. Population, population density and buildings by region Chile's population is concentrated in the central part of the country, mainly in the Metropolitan Region -referred also as “Región Metropolitana de Santiago” (RM) or XIII. This small region holds the capital city, Santiago, with 40% of the country’s population and an average density of 14.200 ℎ𝑎𝑏/𝑘𝑚2 . Similarly, buildings are concentrated in central Chile, leaving less than 2.000 buildings in the region with the highest GHI, Atacama. The most favored areas by radiation within the country are in the regions XV, I, II, III, and in the northern part of the IV region. However, the population over this area is limited to only 10% of the country’s population with an average density of 15 ℎ𝑎𝑏/𝑘𝑚2 among the five regions. A summary table with statistics for radiation, population, population density and buildings for Chilean districts is presented in TABLE 1. TABLE 1:. RADIATION. (2010),. POPULATION. (2009)/BUILDINGS, POPULATION. DENSITY FOR. DISTRICTS AT ALL REGIONS OF CHILE (Universidad de Chile, s.f.), (INE, 2012) Region XV Arica I Tarapacá II Antofagasta III Atacama IV Coquimbo V Valparaíso XIII Santiago (RM) VI B. O'Higgins VII Maule VIII Biobío IX La Araucanía XIV Los Ríos. Pop. Density GHI (kWh/𝑚2 ) M Population / Buildings Min ̅̅̅̅ Min Max 𝐼̅ 𝑃𝐷 Max 2.213 2.509 2.676 186,1/ 1.081 0,2 10 38 2.210 2.464 2.646 307,4/ 1.453 0,3 33 143 2.012 2.438 2.690 568,4/ 4.450 0,1 3 12 1.801 2.187 2.432 278,5/ 1.965 0,7 3 10 1.697 2.126 2.360 708,4/ 5.661 0,9 25 144 1.685 1.962 2.206 1.739,9/ 13.024 5,5 241 2.399 1.926 2.072 2.152 6.814,6/ 37.307 2,9 4.774 14.200 1.856 1.955 2.045 874,8/ 7.045 7,2 100 933 1.780 1.857 1.921 999,7/ 10.457 6,4 65 1.032 1.550 1.759 1.863 2.027/ 15.053 2 184 1.860 1.417 1.554 1.778 962,1/ 7.290 2,9 47 644 1.282 1.360 1.448 378,2/ 2.233 5,5 26 156.
(21) 8. X XI XII. Los Lagos Aysén Magallanes Country. 1.071 772 730 730. 1.222 969 833 1.818. 1.324 825,8/ 4.920 1.177 103,7/ 477 979 158,1/ 477 2.690 16.931.9/112.893. 0,6 30 170 0 1 8 0 1 7 0 369 14.200. 1.2.3. Chilean electricity rates Chile has different electricity tariffs schemes for low voltage (<400V) consumers, labeled as BT1, BT2, BT3 and BT4. The variation is explained by the connection capacity (and its overcurrent protection), the metering technology and peak power treatment (peak power can be measured or contracted and limited by overcurrent protections). Residential consumers have a simple energy-only meter and a retail rate (BT1) high enough to finance both its energy consumptions (E) and its power demand (P). Above 10kW, different industrial and commercial customers (BT2, BT3 and BT4 tariffs) have separate charges for E and P, according to the peak load pricing theory. Through this formula, the energy consumption tariff (E) is targeted to finance mainly the generation sector, while the power demand charge (P) is targeted to finance the distribution and transmission infrastructure. Unlike Italy or Germany, Chile currently applies no incentive policy for solar power, but electricity prices are high enough (from 2 to 4 times higher than in Midwestern US) to make solar power competitive. Electricity tariffs differ in different areas, and the retail tariff (BT1) – chiefly for residential customers – is cheaper when networks have higher density, given that lower investments are required to serve several nearby houses with the same power lines. For larger consumers (BT2, BT3 and BT4) population density does not affect the energy tariff as infrastructure is charged separately (P is splitted from the E charge). BT3 and BT4.
(22) 9. tariffs share the same energy tariff as BT2 clients. In all cases the tariff provides key information for investors to find the best places to locate or promote PV generation. Electricity rates are presented in Fig. 1-2 and TABLE 2 sorted by its value. TABLE 2: NON-RESIDENTIAL ENERGY RATES (BT2) FOR DISTRICTS BY REGION. AVERAGE, MAX, MIN IN $USD AND $CLP. (ORDERED BY RATE) VAT INCLUDED Average Energy Price (𝑃̅) Region Region name ($𝑈𝑆𝐷∗ /𝑀𝑊ℎ) ($𝐶𝐿𝑃/𝑘𝑊ℎ) ̅̅̅̅̅̅ ̅̅̅̅̅̅ ̅̅̅̅̅̅ 𝐵𝑇2 ̅̅̅̅̅̅ 𝐵𝑇1 𝐵𝑇2 𝐵𝑇1 XI Aysén 172 322 87 163 IV Coquimbo 137 246 69 124 III Atacama 125 207 63 105 VII Maule 123 232 62 118 X Los Lagos 118 231 60 117 VI Gral. B. O'Higgins 118 206 60 104 V Valparaíso 117 211 59 107 XV Arica y Parinacota 115 214 58 108 VIII Biobío 113 201 57 102 XIV Los Ríos 112 210 57 106 II Antofagasta 112 190 57 96 IX La Araucanía 112 198 56 100 I Tarapacá 106 198 54 100 XII Magallanes y Antártica 104 201 53 102 170 51 86 XIII Metropolitana de Santiago 100 Electricity rates are higher in regions XI, IV, III, but region XI is in the south and has high levels of cloudiness, rain, and thus a very low GHI. Conversely, regions IV and III have a very high solar radiation combined with high electricity tariffs. Regions I, II and XV in the north have a great GHI but electricity rates are not that high. It’s worth highlighting that the capital city, Santiago, is very densely populated and has the lowest.
(23) 10. electricity rates in the country; therefore, 40% of the population is facing very limited incentive to engage in PV projects. 1.3. ROOFTOP PV PROJECTS AND ENERGY CAPTURED AS FUNCTION OF MOUNTING ANGLES Building rooftops are often flat, but equipment installed on the top of the building (escalators, water storage and ventilation systems, etc.) may limit the available area for PV. This PV area is even more limited when partial shadows from these objects and from neighboring objects, such as other buildings and trees are considered. Fig. 1-5 shows the PV potential area of an example 2-story building with a PV array optimally installed on a flat rooftop in Peñalolén district, in the Metropolitan Region. Depending on the orientation of the building, the optimal PV project may vary. Fig. 1-5a) shows a 11,5 kWp PV project with 46 panels of 250 Wp each, mounted on 67 𝑚2 of rooftop surface, with a 74,7 𝑚2 PV area, azimuth = 180° (North) and 27° tilt. In this case, 171.4 𝑀𝑊ℎ/𝑦𝑟 incident radiation produce 23,5 𝑀𝑊ℎ/𝑦𝑟 electricity. Similarly, Fig. 1-5b) shows a 10,3 kWp PV project with 41 panels of 250 Wp each, mounted on 60 𝑚2 of rooftop surface, with a 66,6 𝑚2 PV area, azimuth = 180° (North) and 27° tilt. Incident radiation of 152,8 𝑀𝑊ℎ/𝑦𝑟 produces 23,5 𝑀𝑊ℎ/𝑦𝑟 electricity. Since Chile latitude ranges from 17° to 56°, optimal PV inclination is far from horizontal and most PV systems face a radiation gain (w.r.t. GHI) by its optimal orientation and tilt. Electricity generation varies with the change of radiation captured during a specific period.
(24) 11. of time: by the day, season or year. A proper choice for these angles is needed to maximize the total radiation captured or the value of energy produced. The Azimuth (orientation angle,γ) and inclination or slope (tilt angle, 𝛽 ) of the panel are the two free parameters/angles of fixed PV modules. The orientation w.r.t. to the south is measured clockwise by the Azimuth (γ) from 0° to 360°. Unlike other countries, in the northern hemisphere where the optimal orientation is south (Mondol, Yohanis, & Norton, The impact of array inclination and orientation on the performance of a grid-connected photovoltaic system, 2007), the maximum radiation in Chile can be captured by pointing north (Pino, Bustamante, Escobar, & Pino, 2012), this is Azimuth γ=180.. The tilt. angle refers to the angle measured from the horizontal to the surface where the plane is located and is defined between 0° (the horizontal plane parallel surfaces) and 90° (vertical surfaces). For Chile, the average optimum tilt angle is 27° and varies depending on the location within the country from 16° in the north to 30° in the south. The optimal orientation ranges are from 145° to 192°, depending on the characteristics of the location (weather, mountains, etc.). The incident radiation decreases as mounting angles depart from optimal. For Peñalolén, with changes of tilt between 10° to 30° and orientation between 140 and 220° incident radiation range drops from the optimum in less than 5% (contour 95%, see Fig. 1-4)..
(25) 12. 80. 6 0.. 70. Captura de radiación con respecto a máximo para plano inclinado fijo % 0.6 0.6 0. 0.65 0.65 55 55 0. 7 0. 6 0.7 . 0 0.75 0.7 5 65 0. 0.8 0.8 7 5 0. 0.8 0.8 0.9 75 5 0. 8 0. 0.9 5 95 0.. 65 0. 7 0.. 0. 85. 0. 9. 𝑀𝑊ℎ 𝑚2 𝑦𝑟. 85 0.. 2.2932 MWh = 27° - = 180°. 0.9 5. 30. 8 0.. 40. 75 0.. 50. 9 0.. Inclinación Tilt angle . 60. 10. 0. 9. 20. 100. 95 0.. 0.95. 120. 140. 160. 180. 200. 220. 240. 260. Azimut Azimuth. Fig. 1-4: Ratio of incident radiation received to maximum at optimal mounting: from tilt angle 0° (horizontal) to 90° (vertical) and orientation from 90° (East) to 270° (west) compared to the maximum radiation received (𝛼 = 27° 𝛾 = 180°) in Peñalolén District Locating PV modules on flat horizontal rooftops allows saving on mounting structures, but limits the opportunity for optimal orientation of the PV modules. Furthermore, mounting PV modules horizontally is not a good choice, because the modules are likely to accumulate excess dirt or mud, reducing energy capture. A tilt angle of 5º and above is often used for nearly horizontal mounting. 1.3.1. Captured radiation and energy production in different façade orientations Considering the geographic characteristics of Chile and the tendency of high-rise building in high-density area, Façade-mounted PV requires careful consideration in order to understand the potential of PV generation for this style of mounting. Most high-rise buildings have four main walls and one main rooftop. The available space in walls is mostly unoccupied and serves to separate the interior space from the exterior environment;.
(26) 13. some windows are polarized to reject energy from the sun. Polarized windows and walls have the potential for radiation capture which could be used for photovoltaic generation (see Fig. 1-1). In the southern hemisphere, the orientation of the façade to the North captures more radiation per kWp installed, followed by east and west, while south is the worst orientation for PV generation (see Fig. 1-6 a). Fig. 1-6b shows the captured isolation by a 10kW PV panel at various orientations as an example relative to the horizontal. The generation on the horizontal plane is presented as 100% (16,65 MWh per year). To the north, generation is 65,3% (10,88MWh), 53,94 and 53,89% to east and west respectively (8,98 and 8,98 MWh) and to the south is only 24,08% (4,01 MWh). This is further explained considering rooftop configuration in (Bergamasco & Asinari, Scalable methodology for the photovoltaic solar energy potential assessment based on available roof surfase area: Application to Piedmont Region (Italy), 2011) (Karteris, Theodoridou, Mallinis, & Papadopoulos, 2014) (Bergamasco & Asinari, Scalable methodology for the photovoltaic solar energy potential assessment based on available roof surface area: Further improvements by ortho-image analysis and application to Turin (Italy), 2011 a)..
(27) 14. Fig. 1-6: (a) Comparison of radiation captured by 1 kWp PV panels on different façade. West. East. South. NW. NE. North. (a). SW. SE. (b). Fig. 1-5: Optimal PV mounting in flat rooftops in Santiago: a) orientation at N, S, W, E and b) SW, NW, NE and SE. (a). 800. Power [W]. 700. 600 500. E 3,1 kWh/day 1,12 MWh/yr. GHI 5,7 kWh/day 2,08 MWh/yr. W 3,1 kWh/day 1,12 MWh/yr. (b). N 3,7 kWh/day 1,36 MWh/yr. 400 300 200 100 0. S 1,4 kWh/day 0,5 MWh/yr. Hour. orientations in Peñalolén. (b) 10 kWp PV panels mounted on different façade orientations in a building ..
(28) 15. similar. total. annual. generation,. however, they have very different. (a) 30. Surplus. 25 Power [kW]. The east and west orientation have. 20 15. 40kWp Load profile 20 kWp. 10. generation curves because the east has. 5. 10 kWp 0:00 1:15 2:30 3:45 5:00 6:15 7:30 8:45 10:00 11:15 12:30 13:45 15:00 16:15 17:30 18:45 20:00 21:15 22:30 23:45. -. the greatest amount of generation. generation during the afternoon, while the west has virtually no generation. (b). Surplus. 20 Power [kW]. during the morning and negligible. Hour. 25. 15. 40 kWp Load Profile 20 kWp. 10 5. during the morning and peaks in the (c) 25 20. under a time-of-use tariff, because. 15. Chileans face the highest electricity. 10. 40 kWp. 5. 20 kWp. consumption and prices in the late afternoon.. Surplus. Power [kW]. west façade may provide better returns. Hour. Load Profile. 10 kWp. -. 0:00 1:10 2:20 3:30 4:40 5:50 7:00 8:10 9:20 10:30 11:40 12:50 14:00 15:10 16:20 17:30 18:40 19:50 21:00 22:10 23:20. afternoon (see Fig. 1-6 a). Thus, the. 10 kWp 0:00 1:20 2:40 4:00 5:20 6:40 8:00 9:20 10:40 12:00 13:20 14:40 16:00 17:20 18:40 20:00 21:20 22:40. -. West Hour. (d) 350. East. 331. 331 306. 306. 300 Energy [kWh]. Fig. 1-7: (a) Horizontal PV panel: comparison of load consumption and photovoltaic generation (b) West oriented PV panel: Comparison of load consumption and photovoltaic generation (c) East oriented PV panel: comparison of load consumption and photovoltaic generation (d) Daily Generation and consumption by east and west orientations. 266. 264. 250 200 150 92. 100. 90. 49 50. 49. 25 -. 6. -. -. 10 kWp. 20 kWp. 40 kWp. PV project installed. 25 10 kWp. 9. 20 kWp. 40 kWp. Own Consumption [kWh] Net Consumption [kWh] Surplus [kWh].
(29) 16. The interaction between generation and consumption during the day depends on the orientation of the wall where the PV modules (see Fig. 1-7) are located. The maximum generation intervals for PV panels are those intervals of day when PV panels are directly facing the sun. Horizontally oriented generation has a peak at noon (Fig. 1-7 a), panels facing west maximize their generation during the afternoon (Fig. 1-7 b) and panels facing east have peak generation during the morning (Fig. 1-7 c). East-facing and west-facing panels produce similar amounts of energy, but at different times of the day (Fig. 1-7 d). 1.4. RESULTS: CALCULATION OF ECONOMIC INDICATORS Seventeen districts were selected to represent the differences through the country according to four characteristics: proximity to the sea, differences between energy prices in the centralized grid system (SIC) and the “Norte Grande” system (SING), high radiation, and population. LCOE, payback, grid-parity investment cost and IRR are calculated and presented in colored maps (see Fig. 1-8). Despite of some criticism to payback as an economic indicator for PV installations (Perez, Burtis, Hoff, Swanson, & Herig, 2004), it was calculated due to its spread use. 1.4.1. Levelized cost of electricity (LCOE) for PV projects The levelized cost of electricity (LCOE) is an economic assessment of the cost of the energy generated from a system and it represents the price at which electricity must be generated to break even over the lifetime of a specific project, including all costs over the project lifetime..
(30) 17. PV project investment cost was initially based on several invoices and price quotes, but since prices have been dropping consistently a range of prices was adopted from 2.000 to 3.000 $USD/kW (Fig. 1-8a and Fig. 1-8b); these represent the lowest cost found and a more typical price, respectively. PV price local projections are near 2.000 $USD/kW for the next few years. The time horizon used for evaluation is 20 years, and the discount rate utilized is 10%. However, the full study incorporates also 6% for more residential investors, 14% for energy investors. While rooftop PV installation cost is simple to define (the cost of the PV project), the cost of installing PV panels on façade is more difficult to assess, because it requires Payback Energy-only rate XV 56. XV 85. I 56. Payback Max investmen cost per MW Retail rate Energy-only rate Energy-only rate. XV 9,7. I 85. XV 5,3. I 9,7. II 55. II 83. II 9,3. II 5,6. III 61. III 92. III 9,0. III 5,6. V 68 VI 73 VIII 80. IV 63 RM 69 (XIII) VII 78 IX 84. XIV 103. X 113 XI XII -. a). IV 95. V 101 VI 109 VIII 120. RM 104 (XIII) VII 116 IX 126. XIV 154 >200 188 176 164 152 140 128 116 104 92 80 68 56 < 50. V 11 VI 10,4 VIII 11,8. X 169 XI -. IV 8,5 RM 11,2 (XIII) VII 10,5 IX 13,5. XIV 15,7. X 16,9 XI -. XII -. b). XII -. c). XV 1.957. I 5,3. III 1.854 IV 5,0 RM 6,7 (XIII). V 6,7 VI 6,2 VIII 6,9. VII 5,8 IX 7,9. XIV 8,6 <4 5 6 7 8 9 10 11 12 13 >14. I 1.776 II 1.835. IV 1.973 RM 1.404 (XIII) VII 1.554. V 1.471 VI 1.563 VIII 1.354. IX 1.176. XIV 1.035. X 976. X 9,2 XI 1.132. XI -. XII 535. XII -. d). e). > 2.500 2.300 2.100 1.900 1.700 1.500 1.300 1.100 900 700 500 300 100 <1. f). >30% 27% 24% 22% 20% 17% 15% 13% 10% 8% <5% %. g). Fig. 1-8: PV project economic analysis 2.000 and 3.000 $USD/kW – a,b) LCOE, c,d)payback, e) grid-parity investment cost per MW and f,g) IRR.
(31) 18. considering the cost associated with the integration with the building walls or windows (which is an additional cost to the building, due to PV, as opposed to a stand alone cost as PV is for rooftops). For evaluation purposes, the actual cost can be estimated as the cost of building walls/windows with the PV generator minus the cost of building walls/windows without PV generator. This is the incremental cost due to PV installations. 1.4.2. Effect of the size of the project The inverter and protections of the project are sized with the maximum generation of the PV modules. Mounting hardware, wiring and monitoring devices, as well as AC and DC over-current and over-voltage protection are also included as part of the projects. An optimized option for inverter sizing is presented in Mondol et al. (2006) (Mondol, Yohanis, & Norton, Optimal sizing of array and inverter for grid-connected photovoltaic systems, 2006). For façade PV project, the inverter should not be rated for capacity of PV modules, as incident energy and electricity generation are much lower. Optimal inverter ratios, the ratio between PV panel capacity (DC) and Inverter capacity (AC), are similar to the inverse of the percentage of radiation captured by the PV panels presented in Fig. 1-6. This means it is possible to install more than double the PV panel capacity than the inverter capacity when they are mounted East or West. 1.4.3. Comparing LCOE for PC projects with electricity rates The revenues obtained from PV generation are equal to the amount of energy sold valued at a rate similar to non-residential rate (BT2) of the district where the project is located..
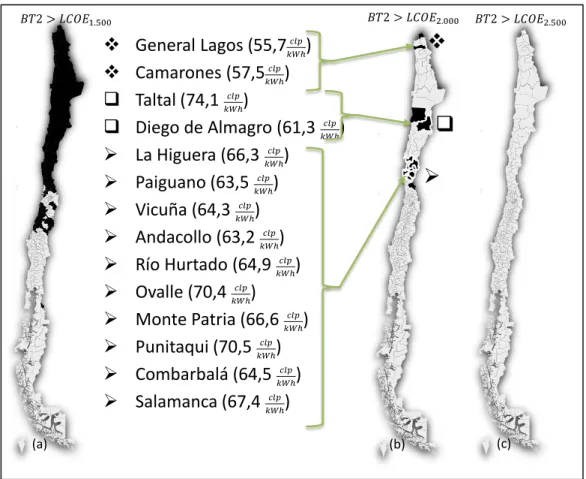
(32) 19. Economically profitable installation costs for façade-mounted PV panels facing each direction are calculated. Considering the prices has gone down quickly over the past few years, 2.000 $USD/kW is a reasonable expectation as it´s happening in other European places (G.J.H.M. van Sark, Peter Muizebelt, Vries, & Rijk, 2014). With that investment cost and with optimal inclination and orientation on flat roofs, only some districts of the third region of Chile have levelized costs of electricity generation less than the retail rate paid to the utility. Facilities on the east and west façade would require investment costs as low as 1.000 𝑈𝑆𝐷/𝑘𝑊 to achieve the levelized cost parity with the energy rate (BT2). The north facing façade requires investment costs lower than 1.300 𝑈𝑆𝐷/𝑘𝑊 to achieve parity with the cost of the grid. In turn, installation facade facing south gets generates very little and is not recommended for solar installations in Chile. A 2.000 𝑈𝑆𝐷/𝑘𝑊 PV project installed in Chile achieves a levelized cost of electricity lower than non-residential rates (BT2) in some districts of I, III and IV region, as shown in Fig. 1-9. This cost parity is expected to happen in some European countries by year 2025. Levelized cost is higher than BT1 rates in districts of XI and XII regions and in the others districts levelized cost are between BT1 and BT2 rates. That means that almost in every place in the north and middle of Chile, house owners can install photovoltaic profitable PV projects (with positive return on investments). Even some buildings with BT2 rates from some places of northern Chile can get high revenues without any subsidy or policy (see example in Table 3 and results Fig. 1-10)..
(33) 20. . General Lagos (55,7 ) Camarones (57,5 ) Taltal (74,1 ) Diego de Almagro (61,3 La Higuera (66,3 ) Paiguano (63,5 ) Vicuña (64,3 ) Andacollo (63,2 ) Río Hurtado (64,9 ) Ovalle (70,4 ) Monte Patria (66,6 ) Punitaqui (70,5 ) Combarbalá (64,5 ) Salamanca (67,4 ). (a). . . ). . (b). (c). Fig. 1-9: Districts whose levelized cost is lower than energy rate BT2 for investment of 2.000 $USD/kW and 10% discount rate (district name; 𝐿𝐶𝑂𝐸2.000 ) TABLE 3: LOCATION, LCOE AND RATES EXAMPLE FOR UNDERSTANDING FIG. 1-10 Location LCOE 2,000 Retail rate Region Number Energy Rate (BT2 rate) $USD/kW (BT1 rate) Region Name Santiago 51 72 86 XIII/RM. In 2013, several PV project investments exceed 2.300 $𝑈𝑆𝐷/𝑘𝑊 without considering maintenance. However, considering that prices of solar panels have declined sharply over the last years, using costs close to 2.000 𝑈𝑆𝐷/𝑘𝑊 and lower for photovoltaic systems is a reasonable expectation..
(34) 21. a). Energy Rates (BT2 ) –Levelized cost – Retail Rates (BT1) 58 54 57. Region. XV I II III IV V RM VI VII VIII IX XIV X XI XII. 108 100 96 105. 60 61 62 63. 69 59. 69 71. 124. 107. 76 72 76 80 85 96. 51. 60 62 57 56 57 60. 86 104. 117 102 100. 110 122. 106. 87. 117. 20. 40. 163. 102. 53. 0. 2.000 [USD/kW]. Rates $CLP/kWh. 60. BT2 Energy rates. 80. 100. LCOE2000. 120. 140. BT1 Retail rates. 160. 180. Fig. 1-10: Comparison between non-residential rates (BT2 energy rates), levelized cost with 2.000 $USD/kW investment, residential rates (BT1 retail rates) and non-residential rates (BT2) in Chile by region 1.4.4. Payback of PV projects According to payback period calculated for those 17 districts in Chile, with an initial investment of 2.000 $𝑈𝑆𝐷/𝑘𝑊, considering flat installation, the minimum payback time required is 7,7 years in Monte Patria and the maximum is 17,2 years in Puerto Montt. Installation on the north, east or west facades presents payback periods more than 44% longer, returning the investment after the life expectancy of the solar projects (see Fig. 1-8, Table 5 and Table 4), therefore the project is not economically feasible.. 200.
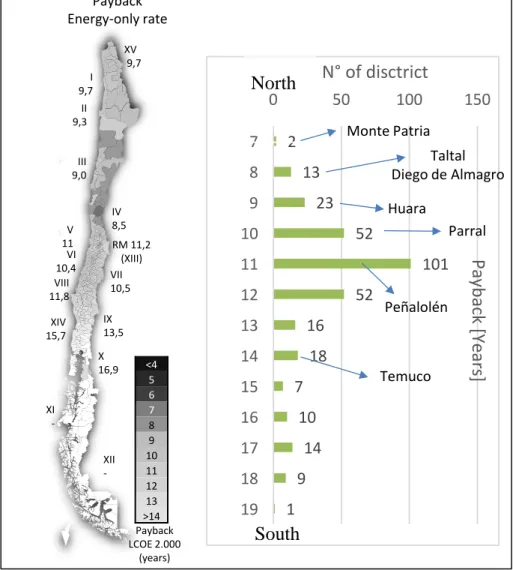
(35) 22. TABLE 4: ANNUAL GENERATION, NON-RESIDENTIAL RATES AND LEVELIZED COST CONSIDERING 2.000 $USD/KWP INITIAL INVERSION, 15,4% EFFICIENCY PANNELS, DISCOUNT RATE OF 10%, 1% OF ANNUAL GENERATION DECAY, 1% COST IN ANNUAL MAINTENANCE Annual generation 𝒌𝑾𝒉/ Levelized cost 2.000 $𝑈𝑆𝐷/ BT2 𝒌𝑾𝒑 𝑘𝑊 District $𝑪𝑳𝑷 I. Opt. I. Opt. West North East GHI West North East GHI Ang. 𝒌𝑾𝒉 Ang. I Huara 1.013 1.042 1.013 2.015 2.112 53,7 135,6 131,8 135,6 68,2 65,0 I Iquique 905 880 910 1.768 1.823 53,7 151,8 156,0 150,9 77,7 75,3 II Calama 1.075 1.141 1.070 2.106 2.238 53,7 127,8 120,4 128,3 65,2 61,4 II Antofagasta 892 967 967 1.768 1.862 53,7 154,0 142,0 142,0 77,7 73,8 II Taltal 934 921 772 1.610 1.714 79,6 147,1 149,1 177,8 85,3 80,1 III D. Almagro 1.012 1.141 987 1.946 2.102 62,9 135,7 120,4 139,2 70,6 65,3 III Copiapó 1.004 1.105 840 1.822 1.991 62,9 136,8 124,3 163,4 75,4 69,0 IV Coquimbo 882 869 646 1.358 1.489 67,7 155,8 158,1 212,5 101,2 92,3 IV Ovalle 958 1.074 814 1.694 1.866 73 143,3 127,8 168,8 81,1 73,6 IV M. Patria 966 1.134 903 1.791 1.970 73 142,1 121,2 152,1 76,7 69,7 V Valparaíso 796 807 699 1.353 1.434 59,1 172,6 170,2 196,5 101,5 95,8 RM Santiago 885 1.024 884 1.642 1.789 49,9 155,2 134,2 155,4 83,6 76,8 RM Peñalolén 898 1.087 897 1.665 1.839 49,9 152,9 126,3 153,1 82,5 74,7 VII Parral 825 964 779 1.463 1.609 65,9 166,4 142,4 176,2 93,9 85,4 VIII Concepción 797 993 787 1.425 1.590 56,4 172,3 138,3 174,5 96,4 86,4 IX Temuco 704 806 644 1.182 1.290 57,3 195,2 170,4 213,4 116,2 106,4 X P. Montt 625 741 597 1.034 1.132 56,8 219,7 185,3 230,2 132,9 121,3. In addition, 205 districts can recover their PV investment in 10 and 12 years, 38 districts in less than 10 years and 75 districts in more than 12 years (see Fig. 1-11). The payback period for PV projects is presented in 17 districts for each orientation and optimum angle, the latter is available on horizontal surfaces. The levelized cost of electricity is lower than the BT2 electricity rate in Monte Patria, located in Region IV, because of the amount of radiation and high retail rate of energy..
(36) 23. Payback Energy-only rate XV 9,7 I 9,7. 0. II 9,3. 7 III 9,0. XIV 15,7. 50. IX 13,5 X 16,9. XI XII -. <4 5 6 7 8 9 10 11 12 13 >14 Payback LCOE 2.000 (years). Taltal Diego de Almagro. 13. 9. RM 11,2 (XIII) VII 10,5. 23. 10. Huara Parral. 52. 11. 101. 12. 52. 13. 16. 14. 18 7. 16. 10. 17. Peñalolén. Temuco. 15. 14. 18 19. 150. Monte Patria. 2. 8 IV 8,5. 100. Payback [Years]. V 11 VI 10,4 VIII 11,8. N° of disctrict. North. 9 1. South. Fig. 1-11: Payback histogram -project 2,000 $USD/kW considering energy only rates (BT2 energy rates).
(37) 24. TABLE 5: RADIATION, NON-RESIDENTIAL RATES AND PAYBACK PERIOD (BT2 ENERGY RATE) CONSIDERING: 2.000 $USD/KWP INITIAL INVERSION, 15,4% EFFICIENCY PANELS, WITHOUT DECAY IN ANNUAL GENERATION. Captured Radiation kWh/m2 BT2 Payback Period Districts Opt. $𝑪𝑳𝑷 Opt. West North East GHI West North East GHI Ang. 𝒌𝑾𝒉 Ang. I Huara 1.266 1.303 1.266 2.519 2.640 53,7 18,6 18,1 18,6 9,3 8,9 I Iquique 1.131 1.101 1.137 2.210 2.279 53,7 20,8 21,4 20,7 10,6 10,3 II Calama 1.343 1.426 1.338 2.632 2.798 53,7 17,5 16,5 17,6 8,9 8,4 II Antofagasta 1.115 1.209 1.209 2.210 2.327 53,7 21,1 19,5 19,5 10,6 10,1 II Taltal 1.167 1.151 966 2.012 2.143 79,6 13,6 13,8 16,4 7,9 7,4 III D. Almagro 1.265 1.426 1.234 2.432 2.628 62,9 15,9 14,1 16,3 8,3 7,6 III Copiapó 1.255 1.381 1.050 2.277 2.489 62,9 16,0 14,5 19,1 8,8 8,1 IV Coquimbo 1.102 1.086 808 1.697 1.861 67,7 16,9 17,2 23,1 11,0 10,0 IV Ovalle 1.198 1.343 1.017 2.118 2.332 73 14,4 12,9 17,0 8,2 7,4 IV M. Patria 1.208 1.417 1.128 2.239 2.463 73 14,3 12,2 15,3 7,7 7,0 V Valparaíso 995 1.009 874 1.691 1.792 59,1 21,5 21,2 24,5 12,6 11,9 RM Santiago 1.106 1.280 1.105 2.053 2.236 49,9 22,9 19,8 22,9 12,3 11,3 RM Peñalolén 1.123 1.359 1.122 2.081 2.299 49,9 22,6 18,6 22,6 12,2 11,0 VII Parral 1.032 1.205 974 1.829 2.011 65,9 18,6 15,9 19,7 10,5 9,5 VIII Concepción 996 1.242 984 1.781 1.987 56,4 22,5 18,0 22,8 12,6 11,3 IX Temuco 879 1.008 805 1.478 1.613 57,3 25,1 21,9 27,4 14,9 13,7 X P. Montt 781 927 746 1.292 1.415 56,8 28,5 24,0 29,8 17,2 15,7. 1.5. CONCLUSIONS Roof-mounted and façade-mounted PV systems for electricity generation in residential and commercial buildings have been promoted worldwide as an important concept for sustainable cities. Considering different radiations and rates, mounting position, optimum and feasible mounting direction, and inclination of PV panels in various regions of the country and the optimal configuration of the projects, the economic profitability of PV-.
(38) 25. on-building projects was evaluated, with detailed information for 318 districts presented on colored maps and 17 representative districts presented on tables. PV-on-building project profitability is closely related to the population density, solar radiation in the area, and the rates of the area. With the current rate policy in Chile, by 2014 Chile's most economically feasible area for PV installation is in region III, where high electricity rates and high solar radiation levels co-exist. This set of circumstances makes Chile the only country in Latin America that makes rooftop PV projects economically feasible without incentives. The average optimum inclination angle for PV panels in Chile is 27° and varies from 16° to 30° depending on the area of the country. The optimal orientation ranges are from 145° to 192°, depending on the characteristics of the location. On roofs with a slope, the photovoltaic modules are installed in parallel to the slope. The radiation captured for a tilt from 10° to 30° and orientation between 140 and 220° range leads to radiation capture departing from the optimum by less than 5%. Chilean PV projects investment costs have achieved 2.000 $𝑈𝑆𝐷/𝑘𝑊, much lower than in the US, and a cost low enough to make this technology competitive. Façade-mounted PV projects facing north (the best orientation for facade), requires an even lower investment cost to be profitable (less than 1.300 $𝑈𝑆𝐷/𝑘𝑊). This means PV costs need to keep going down in order to be feasible in building façades and only projects where the PV modules constituent a part of the building wall or window, so that the cost of materials is considered part of the present structure, would be feasible..
(39) 26. Payback period can be as low as 7.7 years (in Monte Patria oriented skyward installation, parallel to the surface) and as large as 17.2 years (in Puerto Montt for an installation of the same characteristics). Façade installations north side, east and west presents more than 44% extra longer payback period, going beyond the limit of average life expectancy of solar projects (20 years). Very high electricity prices, very high radiation levels, as well as very low PV investments costs are turning Chile into a photovoltaic paradise, even without subsidies..
(40) 27. 2. RESIDENTIAL PV ROOFTOP INSTALLATION IN CHILE: TECHNICAL AND ECONOMIC POTENTIAL 2.1. INTRODUCTION Chile is characterized by an increasing need for cost-effective energy and very high solar irradiation levels. This combined with photovoltaic (PV) technology development worldwide and consistently decreasing PV cost has led to strong interest in implementing PV generation in Chile. In some countries the deployment of PV systems on the ground has led to heated debate on land use. In Italy, for example, installation of PV systems on agricultural soil was forbidden in 2012 (Tudisca, Di-Tripani, Sgroi, Testa, & Squatrito, 2013). Under these circumstances, rooftop PV systems, as a prospective alternative to greenfield PV development, has drawn increasingly more attention. As a result, there has been an increasing need to identify the generation potential of rooftop PV systems, and evaluate the economic benefits that could be obtained for a specific region, city, or country, providing enough information for investors, and supporting material for regulators to develop incentives and appropriate policies. 4. 1 5. 6. 7. 3. 2. Fig. 2.1-1: Rooftop PV project examples.
(41) 28. Several analyses of rooftop PV systems in European countries have been published. They are often focused on generation potential or investment costs. They provide useful information of the future of the technology in some countries, such as Italy and Germany, among others (Tudisca, Di-Tripani, Sgroi, Testa, & Squatrito, 2013) (Schallenberg-Rodríguez, 2013) (Spertino, Di Leo, & Cocina, 2013). In addition to analyzing the technical components of PV systems (modules, inverters, protections, etc.), the technical and economic analysis PV systems for rooftops (see Fig. 2.1-1) requires information about radiation, electricity tariffs, consumption profiles, incentive policies and construction codes, which may vary by city or county. Specific knowledge of local conditions is crucial. With the support of the Chilean Construction Chamber (Cámara Chilena de la Construcción, or CChC) and the Chilean Photovoltaic Node3, an extensive evaluation of different photovoltaic projects over 318 major districts was performed, identifying the most profitable sites for PV development considering the initial investment and local electricity tariffs for different PV projects, including tilted and horizontal roofs. This paper summarizes the findings of this project.. 3. Organization of main PV developers, government energy officials and universities focused on strengthening the technological. networks and the development of distributed PV generation in Chile. Source: http://www.cdt.cl/2012/05/CDT-lanza-NodoFotovoltaico/.
(42) 29. 2.1.1. Methodology and data sources Technical and economic evaluation of rooftop PV potentials for each of the 318 counties required the following: 1) Having some knowledge of the location, population, housing styles, etc. Housing styles and the quantity of houses for each county are based on the Chilean CASEN survey (MIDEPLAN, 2014), while population data were obtained from the last national census (2009) (INE, 2012) (Ministerio del Interior, 2014). 2) Obtaining hourly solar irradiation series from the Chilean solar map4. For an alternative method to develop this step see Mellit et al. (2010) (Mellit, Eleuch, Benghanem, Elaoun, & Pavan, 2010). 3) Obtaining local electricity rate structure and tariff values (CHILECTRA, 2009) for each utility in the area (from each company website), 4) Computing solar incident radiation according to the inclination and orientation angles of the system, (and according to the possibilities given by roof angles). The solar irradiation model to compute the incident radiation on the roofs is based on Duffie and Beckman (Duffie & Beckman, 1991) and it was codded in MATLAB. 5) Computing generation from a typical PV project. 6) Obtaining examples of electricity consumption profiles. Since Chile does not have publicly available electricity consumption profiles by customer, a short-term metering campaign was performed to develop representative. 4. Chilean irradiation data: http://walker.dgf.uchile.cl/Explorador/Solar2/.
(43) 30. profiles. Extrapolation to the rest of the year was performed using typical consumption days adjusted by the monthly billing information. Local electricity consumption profiles were measured for 2 typical clients (a residential apartment and a medium house). In addition 12 different building load profiles were collected using university energy meters, these profiles are assumed to be invariant regardless the city. Depending on solar irradiation, electricity consumption profiles, orientation and availability of area on the rooftop, a PV project was designed and optimized for each building profile type. 7) Comparing building consumption and PV generation for every 5-min period of the year to assess electricity consumption from the grid versus surplus electricity injected into the grid, which sometimes carries different prices. 8) Selecting the proper PV project investment cost. 9) Finally, computing levelized costs of electricity (LCOE), payback periods, and internal rate of returns as economic performance measures of the project. 2.2. CHILEAN SOLAR RESOURCES AND POLICY PV installation potential depends on the radiation, energy tariff and population. Northern Chile has levels of radiation that exceeds 2.500𝑘𝑊ℎ/(𝑚2 𝑦𝑟), higher than the maximum annually captured radiation by countries with high PV development projects as Germany and Spain (1.200 y 1.850 𝑘𝑊ℎ/(𝑚2 𝑦𝑟) respectively). Highly populated areas have more houses, leading to lower costs for distribution service (economies of scale leading to lower rates). High levels of radiation are found in northern Chile, but the North has less than 10% of the total national population. Rates, radiation.
(44) 31. and other resources are presented by district similar to the material presented in (Bergamasco et. al, 2011) (Bergamasco & Asinari, Scalable methodology for the photovoltaic solar energy potential assessment based on available roof surfase area: Application to Piedmont Region (Italy), 2011) . Energy-only rate (BT2 energy rate). GHI 2010 XV 2.509. XV 58. I 2.464. III 2.187. VII 1.857. IX 1.554. XIV 1.360. III 63. III 105. XI 969 XII 833. IV 69. V 59 VI 60 VIII 57. RM 51 (XIII) VII 62 IX 56. XIV 57. X 1.222 3.000. (a). II 96. IV 2.126 RM 2.072 (XIII). 2.760 2.520 2.280 2.040 1.800 1.560 1.320 1.080 840 600 360 120 0. I 307. I 100. II 57. X 60 XI 87 XII 53. (b). V 107 VI 104 VIII 102. >200 188 176 164 152 140 128 116 104 92 80 68 56 <50. II 568 III 279. IV 124 RM 86 (XIII) VII 117 IX 100. XIV 106. V 1.740 VI 875 VIII 2.026. IV 708 RM 6.815 (XIII) VII 1.000 IX 962. XIV 378. X 826. X 117 XI 104. XI 163. XII 158. XII 102. (c). Houses. XV 186. XV 108. I 54. II 2.438. V 1.962 VI 1.955 VIII 1.759. Retail rate Population (BT1 energy & power rate). (d). > 800 736 672 608 544 480 416 352 288 224 160 96 32 <1. (e). Fig. 2.2-1: Chilean resources - (a) GHI, (b) energy-only rate, (c) retail rate, (d) population, (e) Houses.
(45) 32. 2.2.1. Annual radiation by districts in Chile The economic feasibility of PV projects requires high levels of solar radiation. The solar resource in northern Chile has a maximum of 2.676 kWh/(m2 yr)), one of the highest radiation levels worldwide. Radiation varies throughout the country, the radiation levels decrease towards the south to less than 730 kWh/(m2 yr) (see Table 1 with the average radiation by region for year 2010). The variation across years for the same place is less than 7% (Universidad de Chile, s.f.). Annual radiation obtained during 2010 is shown in Fig. 2.2-1 (a). Regions in the north of the metropolitan area have an radiation average of over 2.000 kWh/(m2 yr), levels that in European countries are attractive for photovoltaic projects. Solar radiation depends significantly on seasons; the maximum radiation is captured in summer and the minimum in winter, with differences of more than 50% of monthly captured radiation. The variation in radiation between seasons is sharper in the south than in the north of the country. The average daily radiation per month and region is presented in Table 1..
(46) 33. Daily average GHI 2010 by districts (kWh). 10. 8 6 4 2 0. Jan. Feb. Calama Monte Patria Peñalolén Concepción Puerto Montt. Mar. Apr. May Huara Antofagasta Santiago Coquimbo. Jun. Jul. Aug. Sep. Diego de Almagro Iquique Taltal Valparaíso. Oct. Nov. Dec. Copiapó Ovalle Parral Temuco. Fig. 2.2-2: Daily average GHI monthly 2010 in Chile by districts 2.2.2. Population, population density and houses by region Most of Chileans are located in the Metropolitan Region (RM or XIII region) located in the center of the country. This small region contains 40% of the population with an average population density of 14.200 ℎ𝑎𝑏/𝑘𝑚2 . The amount of roofs in the XIII (RM) region is much higher than districts in the north, however have up to 20% less annual radiation. The most favored area by radiation are regions XV, I, II, III, and IV at the North. However, these regions have less than 10% of the total population with an average population density of 15 ℎ𝑎𝑏/𝑘𝑚2 . A summary of the population, density of population and homes is presented in Table 1..
(47) 34. TABLE 6:. RADIATION, POPULATION,. REGIONS OF CHILE (Universidad. POPULATION. DENSITY FOR. DISTRICTS. AT ALL. de Chile, s.f.), (INE, s.f.). Pop. Density GHI (kWh/𝑚2 ) M Population 5 ̅ Min Max /M home inhab. Min ̅̅̅̅ Max 𝐼 𝑃𝐷 Arica y 2.213 2.509 2.676 186,1/164,4 0,2 10 38 Tarapacá 2.210 2.464 2.646 307,4/283 0,3 33 143 Antofagasta 2.012 2.438 2.690 568,4/178,1 0,1 3 12 Atacama 1.801 2.187 2.432 278,5/90,1 0,7 3 10 Coquimbo 1.697 2.126 2.360 708,4/238 0,9 25 144 Valparaíso 1.685 1.962 2.206 1.739,9/524,8 5,5 241 2.399 Santiago (RM) 1.926 2.072 2.152 6.814,6/5.831,1 2,9 4.774 14.200 B. O'Higgins 1.856 1.955 2.045 874,8/809,9 7,2 100 933 Maule 1.780 1.857 1.921 999,7/952,2 6,4 65 1.032 Biobío 1.550 1.759 1.863 2.027/1.900,7 2 184 1.860 La Araucanía 1.417 1.554 1.778 962,1/ 922,1 2,9 47 644 Los Ríos 1.282 1.360 1.448 378,2/ 119,5 5,5 26 156 Los Lagos 1.071 1.222 1.324 825,8/ 790,4 0,6 30 170 Aysén 772 969 1.177 103,7/ 950,9 0 1 8 Magallanes 730 833 979 158,1/ 142,5 0 1 7 Country 730 1.818 2.690 16.931,9/15.342,9 0 369 14.200 Region. XV I II III IV V XIII VI VII VIII IX XIV X XI XII. 2.2.3. Chilean electricity rates and policy Chile has different electricity tariffs schemes for low voltage (<400V) consumers, labeled as BT1, BT2, BT3 and BT4. The variation is explained by the connection capacity (and its overcurrent protection), the metering technology and peak power treatment (peak power can be measured or contracted and limited by overcurrent protections). Residential consumers have a simple energy-only meter and a retail rate (BT1) high enough to finance both its energy consumptions (E) and its power demand (P). Above. 5. Considering inhabitants with homes (in thousands). CASEN 2011.
(48) 35. 10kW, different industrial and commercial customers (BT2, BT3 and BT4 tariffs) have separate charges for E and P, according to the peak load pricing theory (see Fig. 2.2-3). Through this formula, the energy consumption tariff (E) is targeted to finance mainly the generation sector, while the power demand charge (P) is targeted to finance the distribution and transmission infrastructure. Unlike Italy or Germany, Chile currently applies no incentive policy for solar power, but electricity prices are high enough (from 2 to 4 times higher than in Midwestern US) to make solar power competitive. Residential rates (BT1) Small consumption (Dem. Max. 10 kW). Electricity consumption rate BT1 Electricity exported to grid BT2. Social house (1kW). Residential house (2kW). 10 kW Medium consumption (10kW<Max. Dem. <100 kW). Electricity consumption rate BT2 Electricity exported to grid BT2. Department (17kW). Office (55kW). Big consumption (100kW < Dem. Max.<500 kW). Cine (170 kW). Professional institute (260kW). Non-residential rates (BT2). Fig. 2.2-3: Energy-only and residential rates Electricity tariffs differ in different areas, and the retail tariff (BT1) – chiefly for residential customers – is cheaper when networks have higher density, given that lower investments are required to serve several nearby houses with the same power lines. For.
(49) 36. larger consumers (BT2, BT3 and BT4) population density does not affect the energy tariff as infrastructure is charged separately (P is split from the E charge). BT3 and BT4 tariffs share the same energy tariff as BT2 clients. In all cases the tariff provides key information for investors to find the best places to locate or promote PV generation. Electricity rates are presented in Table 7 and sorted by value. TABLE 7: NON-RESIDENTIAL ENERGY RATES (BT2) AND RESIDENTIAL RATES (BT1) FOR DISTRICTS BY REGION. AVERAGE, MAX, MIN IN $USD AND $CLP. (ORDERED BY RATE). VAT INCLUDED Average Energy Price (𝑃̅) $𝑈𝑆𝐷 ∗. Reg.. XV I II III IV V XIII VI VII VIII IX XIV X XI XII. Region name. $𝐶𝐿𝑃. Energy Ratio. ̅̅̅̅̅̅ 𝐵𝑇1 108 100 96 105 124 107 86 104 117 102 100 106 117 163 102. 𝐶𝑎𝑝𝑎𝑐𝑖𝑡𝑦 + 𝐸𝑛𝑒𝑟𝑔𝑦 𝐸𝑛𝑒𝑟𝑔𝑦 1.86 1.85 1.68 1.67 1.80 1.81 1.69 1.73 1.90 1.79 1.79 1.86 1.95 1.87 1.92. Dollar ( 𝑀𝑊ℎ ) CLP ( 𝑘𝑊ℎ ). ̅̅̅̅̅̅ 𝐵𝑇2 Arica y Parinacota 115 Tarapacá 106 Antofagasta 112 Atacama 125 Coquimbo 137 Valparaíso 117 Metropolitana de Santiago 100 Gral. B. O'Higgins 118 Maule 123 Biobío 113 La Araucanía 112 Los Ríos 112 Los Lagos 118 Aysén 172 Magallanes y Antártica 104. ̅̅̅̅̅̅ 𝐵𝑇1 214 198 190 207 246 211 170 206 232 201 198 210 231 322 201. ̅̅̅̅̅̅ 𝐵𝑇2 58 54 57 63 69 59 51 60 62 57 56 57 60 87 53. Electricity rates are higher in the XI, IV and III regions, but region XI is in the south and has high levels of cloudiness, rain, and thus a very low GHI. Conversely, regions IV and.
(50) 37. III have a very high solar radiation combined with high electricity tariffs. Regions I, II and XV in the north have a great GHI but electricity rates are not as high. It’s worth highlighting that the capital city, Santiago, is very densely populated and has the lowest electricity rates in the country; therefore, 40% of the population is facing very limited incentive to engage in PV projects. 2.3. ROOFTOP PV PROJECTS AND ENERGY CAPTURED AS FUNCTION OF MOUNTING ANGLES The installation of photovoltaic modules on the surface of a house can be done in pitched roofs, flat roofs or facades (see Fig. 2.3-1 a,b,c). The installation of PV modules on pitched roofs tend to be located parallel to the roof surface to minimize installation costs, the same applies with modules located on facades. Horizontal PV modules prevent easy water drainage and increase the amount of dust and dirt accumulation, therefore reducing their productivity. Modules installed on horizontal surfaces include a structure to provide tilt and orientation to avoid the decrease in productivity. Tilt and orientation angle (see Fig. 2.3-1 d, e) directly affects the amount of radiation captured during the year. The economic potential of the installation of PV panels is increased for tilt and orientation angles that maximize the incident radiation..
(51) 38. 2.3.1. Effect of the orientation and tilt angle on the total incident radiation Flat rooftops. Tilted rooftops 4 1 5 6. Façades. 7. 3. 2. a). b). c). Rooftop tilt angle. =30° d). Front orientation. 30° =30°. North. e). East. Northeast Northwest. South. West. Southwest Southeast. Fig. 2.3-1: Tilted roof, horizontal roof and facade mounting PV projects The roof tilt angles of the houses depend on each country´s regulations. Regulation defines minimum and maximum according to technical and social requirements. Concerning technical requirements, PV mounting angles must be sufficient to drain the water from rainfall and resist the force of the wind. With respect to social needs, there are certain neighborhoods who want to share similar aesthetic or wish to limit the amount of shade produced on neighboring territories. Chilean standard provides minimum to guarantee rainwater drain and a maximum not exceeding a certain angle from the edges of the territory. The maximum and minimum depend on the rules of each district. Because of rainfall, roofs of households in the South have a higher mandatory tilt than in the north..
(52) 39. Due to the wide range of possible angles to use in each district, a sample of roof angles is required to establish the predominant slope. For the particular case of Peñalolén located in the Metropolitan Region of Chile (District code # 13122), a sampling of the main districts is performed (see Fig. 2.3-2). The most commonly used inclination for roofs in Peñalolén varies between 20° and 40° (see Fig. 2.3-3).. Fig. 2.3-2: Sampling different residential neighborhoods roof slopes in Peñalolén 17°. 25° 20°. 25° 20°. 36° 20°. 27°. 20°. 37° 30°. 15°. 20° 30°. 40°. 45°. 20° 15° 40°. 22°. 45°. 30°. 15° 22°. 40° 30°. 45°. 15°. 23° 10°. 12°. 0°. 0°. 30°. 15°. 15°. 10°. 40°. 40°. 23° 33°. 20°. 45°. 30° 40° Rooftops tilt angles. 45°. 50°. 60°. 70°. Fig. 2.3-3: Observed roof slopes in Peñalolén (District code # 13122).
(53) 40. The orientation of the construction of houses is varied and depends on the access road. Two identical houses can have very different PV installation potential for different orientations. The particular case of houses with flat roof, orientation influences only in the number of structures that can be assembled according to the geometry of the surface. a). b). North. Northeast. North. Northeast. East. Southeast. East. Southeast. South. Southwest. South. Southwest. West. Northwest. West. Northwest. Fig. 2.3-4: different house orientation.
(54) 41. Optimum PV panels orientation and inclination angles that maximize photovoltaic generation depend on the geographic location. For example for Peñalolén district, maximum capture radiation occurs for a north facing (asimuth 180°) and tilt 27°. The 5% contour of maximum incident radiation consists of a +-15° range centered on the optimum tilt and between 130 and 210° orientation. In the case of Peñalolen, the orientation and inclination of the roof to maximize the incident radiation is between 12° and 32° (see Fig. 2.3-5). Captura de radiación con respecto a máximo para plano inclinado fijo % 0.6 0.6 0. 5 0 65 0. 55 .65 5 0. .7 0 6 0.7 0. 0. 6 0.75 0.7 5 5 6 . 0 0.8 0.8 7 . 0 0.85 0.8 0.9 75 5 0. 8 . 0 0.9 5 95 . 0. 80 70. 65 0.. 60. 7 0.. =10°. 2.2932 MWh. = 27° - = 180°. 10. 0. 95. 20 0. 9. =20°. 0. 9. 30. 0.9 5. =30°. 0. 85. 40. 85 0.. =40°. 8 0.. 50. 75 0.. =50°. 9 0.. Inclinación angle Tilt. =60°. 100. West. 0.95. 120. 140. Northwest. 160 180 Azimuth Azimut . North. 200. 220. 240. Northeast. 260. East. Fig. 2.3-5: Ratio of radiation received to maximum: from tilt angle 0° (horizontal) to 90° (vertical) and orientation from 90° (East) to 270° (west) compared to the maximum radiation received (α=27° γ=180°).
Figure


+7
![Fig. 1-5: Optimal PV mounting in flat rooftops in Santiago: a) orientation at N, S, W, E and b) SW, NW, NE and SE 0100200300400500600700800Power [W] HourGHI 5,7 kWh/day 2,08 MWh/yrE3,1 kWh/day1,12 MWh/yr W 3,1 kWh/day 1,12 MWh/yrS1,4 kWh/day0,5 MWh/](https://thumb-us.123doks.com/thumbv2/123dok_es/7294391.445914/27.918.167.810.172.510/fig-optimal-mounting-rooftops-santiago-orientation-power-hourghi.webp)


Documento similar
