Length weight relationships for 25 kelp forest associated fishes of northern and central Chile
5
0
0
Texto completo
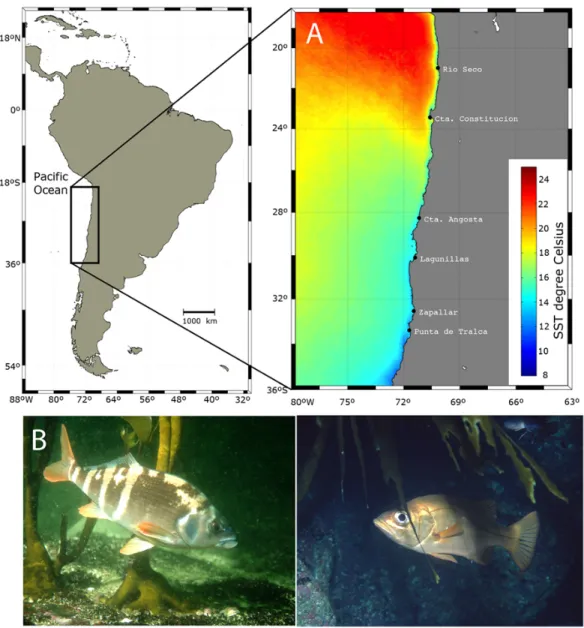
(2) Figure 1. Map of the sampling and collection sites along with: A) interannual average night sea surface temperature from 5th July 2002 to 1st August 2013 which represent the temporal framework of the species collections (see methods for details) for each site. Nighttime Sea Surface Temperature (NSTT) data was acquired and extracted from the moderate resolution imaging spectroradiometer ‘MODIS AQUA L3’ satellite data (incorporating standard atmospheric corrections)1 with a resolution of 1.2 km at high temporal frequency validated. B) pictures of representative species collected such as Cheilodactylus variegatus (bilagay) and Hemilutjanus macrophthalmos (apañao) (photo credit: A. Pérez-Matus) / Mapa de los sitios de muestreo y colecta de peces con: A) Promedio de la temperatura superficial del mar, registro nocturno, entre el 5 de julio de 2002 al 1 de agosto de 2013 representando la escala temporal de la colecta de especies (ver métodos para más detalles). La temperatura superficial del mar fue extraída de una imagen satelital de resolución moderada (1,2 km) del espectroradiómetro ‘MODIS AQUA L3’ (incorporando correcciones atmosféricas)1 y validada en alta frecuencia temporal. B) Fotografías de especies de peces representativas tales como Cheilodactylus variegatus (bilagay) y Hemilutjanus macrophthalmos (apañao) (créditos: A. Pérez-Matus). 1. <ftp://podaac.jpl.nasa.gov>, thermal IR SST, 4 km and 0.1°C resolution from MODIS databases. 142 Pérez-Matus et al. Length-weight relationship of kelp forest fishes.
(3) DATA ANALYSIS We used Huxley’s (1932) power function, W = αL , where L represents the total or fork length (cm) size, W the total weight (g), α the intercept (initial growth coefficient or condition factor) and b the slope (growth coefficient, i.e., fish relative growth rate), to express the scaling relationship of length-weight for the 25 fish species included in the model below. Length-weight allometry was quantified by deriving exponent α by regressing the natural logarithm of the length of each species against the natural logarithm of body mass and obtaining the slope. b. Slopes were calculated using regression ordinary least squares (OLS) and the association degree between L and W was calculated by the determination coefficient r2. Additionally, 95% confidence limits of α intercept and b slope and the statistical significance level of r2 were estimated. All data management and analysis were performed using the R statistical software, version 3.0.0 (R Development Core Team 2012) with R base packages (see S2 supplementary data in Pérez-Matus et al. 2014). Regression ordinary least squares and testing for the different species regressions were computed using package ‘smatr’, version 3.4 (Warton et al. 2012). Equally, we tested the relationship of L-W discriminated by study sites to test if growth coefficient changed due to geographical (i.e., latitudinal) range. We spatially pooled the information since no statistical differences among slopes were detected among sites (P > 0.05), hence years (see above).. RESULTS AND DISCUSSION A total of 760 individuals from 25 different species were collected in the present study, with length-weight equations applying to most teleost species commonly found on shallow subtidal reefs in northern and central Chile (Angel & Ojeda 2001, Pérez-Matus et al. 2007). L-W relationships, growth coefficients, and length-weight equations, along with different descriptive statistics for all species collected are presented in Table 1. Values of growth coefficient (b) ranged from 1.44 to 3.75, with a mean of 2.85 ± 0.48 (SD). The comparison between obtained values of t-test and the respective tabled critical values allowed for the determination of the b-values statistical significance, and their inclusion in the isometric range (b = 3) or allometric ranges (negative allometry: b < 3 or positive allometry: b > 3). The value of 2.85 was less than the rate of isometric growth of 3, meaning that. on average, fishes associated to large brown macroalgae have a negative allometric growth; hence size (i.e., growth) was not proportional to weight. This differed to reef fishes from other temperate kelp forest systems as New Zealand, where growth has been shown to be nearly isometric (i.e., fish structure remains constant with growth; Taylor & Willis 1998). Slopes of the length-weight regressions were not significant for the following species: Labrisomus philippii, Paralichthys adspersus, Nexilosus latifrons, Sebastes oculatus and Helcogrammoides chilensis, suggesting that these 2 variables were dependent to one another. In other words, data for these fish species did not spanned a reasonable size range to estimate α and b parameters (Table 1). Despite differences in cumulative sea surface temperature (see Fig. 1), the L-W relationship was constant. This is consistent with results from other systems such as the north Atlantic (Morato et al. 2001), suggesting that temperature primarily affects fish by altering their growth rates, not their weight at a given length. Sexual dimorphism in length-weight relationships could occur in Semicossyphus darwini and Graus nigra, because of sequential hermaphroditism in the former and energy allocation hypothesis in the latter. We did not have sufficient males for S. darwini and no females for G. nigra. Nonetheless, Flores & Smith (2010) reported a slight sexual dimorphism in L-W relationship in G. nigra, with males having an isometric growth and females a negative allometric growth. Our estimates were similar to those reported by Flores & Smith (2010) for G. nigra, confirming the low variation in growth estimates among the species at different sites. Beside that study, no other source of information regarding length-weight relationships existed for kelp-forest associated fishes of northern-central Chile. This is relevant considering the fishing pressure that many of these populations are currently experiencing (Godoy et al. 2010).. ACKNOWLEDGMENTS We thank Fabian Ramirez, Catalina Ruz (SUBELAB) and Francisco Díaz for assistance in the field. Fondecyt # 11110351 granted to APM provided funding for this research. We also thank the Marine Conservation Center, ICM - P10-033F, (funds from ‘Fondo de Innovación para la Competitividad, del Ministerio de Economía, Fomento y Turismo’). We would like to thank Dr. Richard Taylor and one anonymous referee for valuable comments on earlier draft.. Vol. 49, Nº 1, 2014 Revista de Biología Marina y Oceanografía. 143.
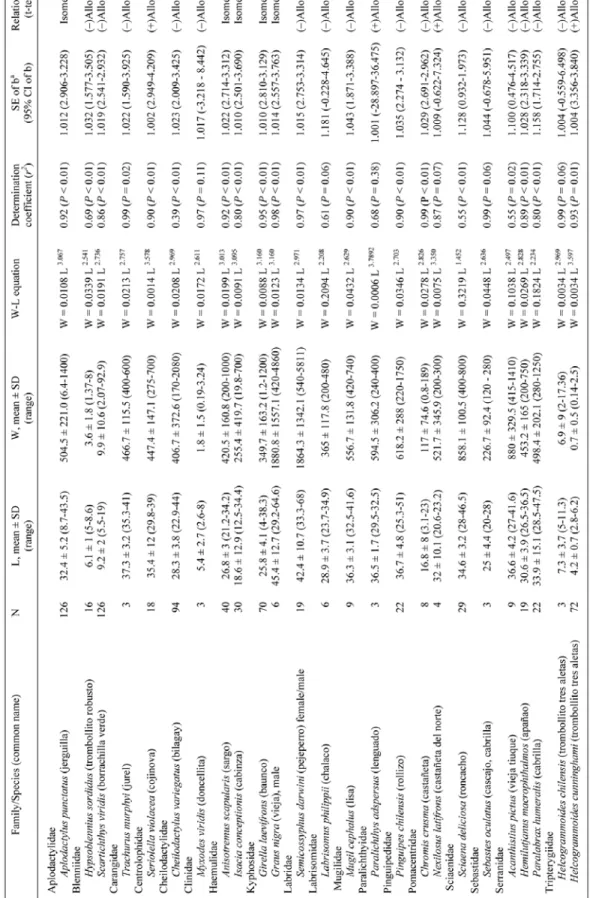
(4) 144 Pérez-Matus et al.. Length-weight relationship of kelp forest fishes. Table 1. Descriptive statistics and L-W relationship parameters for 25 kelp forest-associated fishes of the South East Pacific Coast (Chile). N: sample size; L: total length (cm); W: fresh weight (g); SD: standard deviation; SE: standard error; CI: Confidence interval; a: intercept; b: slope. After the scientific name, the common name is indicated in parentheses / Estadísticos descriptivos y relación de los parámetros de L-P para 25 especies de peces asociados a macroalgas de la costa Este del Pacifico Sur (Chile). N: Numero de muestras; L: longitud total (cm); W: peso fresco (g); SD: desviación estándar; SE: error estándar; CI: Coeficientes de intervalo; a: intercepto; b: pendiente.
(5) LITERATURE CITED Angel A & P Ojeda. 2001. Structure and trophic organization of subtidal fish assemblages on the northern Chilean coast: the effect of habitat complexity. Marine Ecology Progress Series 217: 81-91. Csirke J. 1980. Introduction to the dynamics of fish populations. FAO Fisheries Technical Paper 192: 1-82. Flores H & A Smith. 2010. Biología reproductiva de Graus nigra (Perciformes, Kyphosidae) en las costas del norte de Chile. Revista de Biología Marina y Oceanografía 45: 659-670. Godoy N, S Gelcich, J Vásquez & JC Castilla. 2010. Spearfishing to depletion: evidence from temperate reef fishes in Chile. Ecological Applications 20: 1504-1511. Huxley JS. 1932. Problems of relative growth, 276 pp. Methuen & Co., London. Mora C, O Aburto-Oropeza, A Ayala-Bocos, P Ayotte, S Banks, A Bauman, M Beger, S Bessudo, D Booth, E Brokovich, A Brooks, P Chabanet, J Cinner, J Cortés, J Cruz-Motta, A Cupul-Magaña, E DeMartini, G Edgar, D Feary, S Ferse, A Friedlander, K Gaston, C Gough, N Graham, A Green, H Guzman, M Hardt, M Kulbicki, Y Letourneur, A LópezPérez, M Loreau, Y Loya, C Martinez, I MascareñasOsorio, T Morove, M-O Nadon, Y Nakamura, G Paredes, N Polunin, M Pratchett, H Reyes- Bonilla, F Rivera, E Sala, SA Sandin, G Soler, R Stuart-Smith, E Tessier, D Tittensor, M Tupper, P Usseglio, L Vigliola, L Wantiez, I Williams, S Wilson & F Zapata. 2011. Global human footprint on the linkage between biodiversity and ecosystem functioning in reef fishes. PLoS Biology 9: <DOI: 10.1371/ journal.pbio.1000606>. Morato T, P Afonso, P Lourinho & J Barreiros. 2001. Lengthweight relationships for 21 coastal fish species of the Azores, north-eastern Atlantic. Fisheries Research 50: 297-302. Pérez-Matus A, L Ferry-Graham, A Cea & J Vásquez. 2007. Community structure of temperate reef fishes in kelpdominated subtidal habitats of northern Chile. Marine and Freshwater Research 58: 1069-1085. Pérez-Matus A, S Pledger, F Díaz, L Ferry-Graham & J Vásquez. 2012. Plasticity in feeding selectivity and trophic structure of kelp forest associated fishes from northern Chile. Revista Chilena de Historia Natural 85: 29-48. Pérez-Matus A, S Carrasco & A Ospina-Álvarez. 2014. Length-weight relationship of kelp forest fishes. Figshare <http://dx.doi.org/10.6084/m9.figshare.895042> R Development Core Team. 2012. R: A Language and Environment for Statistical Computing. R Foundation for Statistical Computing, Vienna. < http://www.R-project.org> Santos M, M Gaspar, P Vasconcelos & C Monteiro. 2002. Weight-length relationships for 50 selected fish species of the Algarve coast (southern Portugal). Fisheries Research 59: 289-295. Taylor R & T Willis. 1998. Relationships amongst length, weight and growth of north-eastern New Zealand reef fishes. Marine and Freshwater Research 49: 255-260. Warton D, R Duursma, D Falster & S Taskinen. 2012. Smatr 3 –an R package for estimation and inference about allometric lines. Methods in Ecology and Evolution 3: 257-259. Wootton R. 1999. Ecology of teleost fishes. Fish and Fisheries Series 24: 1-404. Springer-Verlag, New York.. Received 11 September 2013 and accepted 24 January 2014 Associate Editor: Mauricio Landaeta D.. Vol. 49, Nº 1, 2014 Revista de Biología Marina y Oceanografía. 145.
(6)
Figure
Documento similar
The fitness function we have used for the genetic algorithm computes the distance between two pieces of music by expressing both as note-length pair sequences (the third
Since forest variables (forest productivity and for- est biomass) and abiotic factors (climate variables, soil texture and nu- trients, and soil topography) were only calculated at
We evaluated the performance of Partial Least Squares Regression (PLS) models to predict crude protein (CP), neutral detergent fibre (NDF), acid detergent fibre (ADF) and
The metrics used to classify the graphs are the characteristic path length L, the characteristic cluster C [21], the number of biconnected components B [25], and the average
The total charge increases in general with magnetic field but, for finite length wires, it does so by jumping abruptly a quantity equal or smaller than e at each parity crossing
Factors of the length of the rack, L, and mean d discharge coefficient, C qH , for different slopes, void ratios, and longitudinal slopes are presented for the design of the
On the other hand it has been found that this concretion also acts as a protective layer against corrosion, considerably reducing the rate of corrosion of iron in seawa- ter, and
A catchment model for river basins and a hydrodynamic model were combined in order to simulate the spreading of the turbidity plume produced by sediment discharges from the
