Chemical and phisical characterization of problem soils in the Atlantico no 3 irrigation district, Atlántico, Colombia
43
0
0
Texto completo
(2) CHFMICAL. AND. PHYSICAL. CHARACTERIZATION. SOILS IN THE ATLANTICO. #3. ATLANTICO,. OF. PROBLEM. IRRIGATION DISTRICT,. COLOMBIA. D. W. James' T. M. Fullertonl W. L. Rubinkl Hugo Garcia S.2. Support for this project was provided by the United States Agency for International Development under contract AID/ta-C-1103 with Utah State University. Al1 reported opinions, conclusions, or recommendations are those of the authors and not those of the funding agency or the United States government.. 1Professor of Soils, Research Asso. Graduate Research Assistant, Utah State 'Irrigation Engineer Institute of Agriculture.. and. Station. Prof. of Soils, and former University, Logan, Utah. Superintendent,. Calombian.
(3) 1. RESUMEN Y CONCLUSIONES. E n e l D i s t r ito de Riego Atlántico No. 3 en Colombia, se llev6 cabo un Proyecto cooperativo Manejo de Agua a n i v e l bre de 1.973.. de. sobre. Granja,. L a s enti dades. Investigación. y. Demostración. desde Octubre de 1.971,. i nvolucradas. fueron. el. (ICA) y U t a h. fueron. evaluar. los. State. University.. potenciales. de. Los. objetivos. Instituto. producci6n. de. del. cultivos. de. hasta Octu-. biano de la Reforma Agraria ( NCORA), e l I n s t i t u t o C o l o m b i a n o cuario. a. ColomAgrope-. proyecto bajo. riego. e n e l á r e a , evaluar las interacciones de humedad del suelo con otros f a c t o r e s d e c r e c i m i e n t o d e l o s c u l t i v o s , y a d a p t a r l a tecnologra moderna de riego a las condiciones de suelos y clima en el 6rea Proyecto suelos informe. del. Atlántico. No.. 3.. Una prueba del proyecto se localizó sobre. textura. fina. del. distrito,. suministran. los. resultados. de se. en. la de. Granja los. En es te. Malambito.. análisis. de. las. propie-. dades físicas y químicas efectuados a los mencionados suelos. Catorce. ensayos. fueron. efectuados. durante. vos de maíz, ajonjolí, algodón, sorgo, soya, dación. en con. otra. el. estudio,. con. culti-. y arroz secano y de ìnun-. Con excepción del arroz (cuyos resultados se han reportado parte). los. producciones. cultivos. fueron. relativamente. altamente. variables. en. el. campo. bajas.. Al comienzo de los ensayos de cultivos, se observó que los campos experimentales lo mismo que los de propietarios de los alrededores fueron altamente variables en cuanto a cree ción. se. refiere.. miento de plantas y produc-. Muchos intentos para la e iminación. de esta variabilidad.
(4) 2. fueron inútiles.. Por. consiguiente, l o s o b j e t i v o s o r i g i n a l e s s e m o d i f i -. caron con el fin de encontrar la causa y la soluciõn. de las irregulari-. dades del crecimiento de los cultivos y as1 lograr al tas y uniformes producciones con manejo bajo riego. Se. utilizaron. qurmicas. diferentes. clases. de. fertilizantes. y. enmiendas. con el objeto de identificar y superar la causa de la varia-. bilidad de los cultivos.. Estos incluyeron fertilizantes de nitrógeno,. fósforo y potasio; tratamientos con los elementos menores de hierro, .manganeso, cobre, y boro; y tratamientos al suelo con cal y yeso. Ninguno. de. estos. ensayos. dieron. Los resultados de loS. resultados. satisfactorios.. análisis qu7micos. de suelos tomados de un. intenso muestreo del drea indicaron que los suelos no estaban afectados por. sales. Se efectuaron otros tipos de análisis químicos con el objeto de. identificar. las. causas. de. los. desórdenes. en. los. cultivos.. Las mues-. tras fueron enviadas a Utah State University en Logan, Utah, U.S.A. Se hicieron anS1 isis para pH, CEC, c a t i o n e s i n t e r c a m b i a b l e s , s a l e s s o l u b l e s , f6sforo. t o t a l y a s i m i l a b l e y F e , Cu, C o , M n , Z n , y N i extra-. ibles con DTPA. Los resultados de estos anál isi s y las observaciones de campo se resumen en las conclusiones definitivas y en las especulativas.. Conclusiones Definitivas 1.. Fitopatología Todas las pruebas efectuadas para microbios patógenos en las. plantas. fueron. negativas,. indicando que los desórdenes en el creci-. miento de la planta no tuvieron relación ninguna con enfermedades infecciosas..
(5) 2.. Humedad. del. suelo. Se observó anorma 1. crecimiento. de. los. cultivos. tanto. en. la. estación. húmeda como durante la es tac i 6 n s e c a b a j o r i e g o . P o r c o n s i g u i e n t e , l a humedad del suelo no fue un factor que afectare el desarrollo de los cultivos.. 3.. Sales El. del. suelo. contenido. total. de. sales. en. la. parte. principal. de. la. zona. radicu-. lar estuvo en un nivel más bajo que el que puede causar problemas en las plantas. 4. pH d e l. suelo. El pH del suelo estuvo en el rango bptimo los. para el crecimiento de. cultivos.. 5.. Nitrdgeno d e l s u e l o La deficiencia de nitrógeno no fue un factor limitante aún donde. el. fertil. 6.. izante. de. nitrógeno. no. fue. aplicado.. Potasio y magnesio S e a p l icaron. fertilizantes con K y Mg, pero no se observaron bene-. ficios en el cultivo.. Los. análisis. de. suelos. indicaron. niveles. adecua-. dos de dichos elementos.. 7.. Fósforo y metales pesados El fósforo asimilable en el suelo fue de moderado a muy alto. El. fósforo total fue extremadamente alto y el Fe, Cu, Zn, Co, y Ni extraibies. fueron altos a muy al tos.. Todos es tos elementos fueron i ndÍgenos. al suelo. 0. C a r a c t e r í s t i c a s a. área. flsicas. Como consecuencia de las ondulaciones en la topografía, el. tenÍa. depresiones. superficiales. que. contribuyeron. a. los. problemas.
(6) de drenaje. ci6n. Esto podría corregirse por sencillas operaciones de. nivela-. de terreno. b.. Texturalmente el suelo de la superficie era arci 1 losa a franco-. arci 1 losa.. El subsuelo tenla lentes de limo y arena desde los 0,8 m a. 1 ,5 m de profundidad; abajo de los 1 ,5 m la textura era arenosa definidamente.. No se observaron problemas especiales con las condiciones ffsicas. del suelo las cuales no podrlan ser manejadas con oportunas operaciones de preparación del suelo.. Concl 1.. us iones Especulati vas Fósforo El extraordinario suministro de f6sforo. fue causa de excesiva asimi-. lación por las plantas lo cual indujo o contribuyó a un desequilibrio de nutrientes. 2.. Metales pesados Fe, Cu, y Zn, uno de el los o varios en conjunto, estuvieron en. exceso.. Los niveles relativamente altos de Co y Ni extraibles pudieron. haberse involucrado en desórdenes nutricionales de la planta. Ninguna conclusión podría hacerse sobre manganeso por cuanto éste fue afectado por la esterilizaci6n. 3.. por vapor de las muestras de suelo.. Recuperaci6n El exceso de f6sforo. material parental. y metales pesados fueron suministrados por el. del suelo, y por cuanto estos materiales tienen solu-. bil idad 1 imitada la recuperaci6n de. rutina.. no puede ser lograda con procedimientos.
(7) Summary and Conclusions A. cooperative. On-Farm. Project was conducted in from. October,. 1971,. to. Water. the Atlantico October,. Colombian. Institute. of Agrarian. culture,. and. State. Utah. to evaluate. Management #3. 1973.. The. The. agencies Colombian. lantico í13 area. soils. and. were. Institute. of. the. growth factors,. One component. of. the. chemical. district. the. of Agri-. project. the irrigationcropproduction potentials ín the area,. modern irrigation technology to soils and climatic. cal. Demonstration. involved. objectives. soil moisture interactions with other crep. textured. and. irrigation district of Colombia. Reform, the. University.. Research. were evaluate. and to adapt. conditions of the At-. of the project was located on the fineat. Granja. Malambito.. studiesmadeonthefine-textured. Results. soils. from. physi-. arereported. here.. During the study a total of 14 cropping trials were conducted with corn, sesame, rice.. cotton,. sorghum,. soybeans, and. both. upland. and. With the exception of rice (the results of which have. elsewhere). the crops. were highly variable in. inundated been. reported. the field and relatively low. yields were produced. Upon mental in. initiating. fields. and. the. also. cropping surrounding. plant growth and yield.. were unsuccessful.. trials, it was observed that the experí-. Many. Accordingly,. farmers' fields attempts. the. original. find the cause and the solution of'the crep bring. about. uniform. high. yields. to. under. were. eliminate objectives. highly this. variability. were. growth disorders in. irrigation. management.. variable. modified. to. order to.
(8) Various kinds of fertilizers and chemical amendments were used in the attempts to identify and overcome the cause of the crep variability.. These included N, P, and K fertilizers; Fe, Mn, Cu, and. B minor element treatments; and ground limestone and gypsum treatments. None of these trials gave satisfactory results. Results from chemical analyses of soils taken from an intensive sampling of the area indicated that the soils were not affected by Salt. Other kinds of chemical analyses were made to identify causes of the crep disorders.. Samples were shipped to Utah State University at. Logan, Utah, U.S.A.. Analyses were made for pH, CEC, exchangeable. cations, soluble salts, available and total P, andDTPA-extractable. Fe,. Cu, Co, Mn, Zn, and Ni. Results from these analyses and the field observations are summarized as definitive and speculative conclusions. Definitive Conclusions 1.. Plant pathogens Tests made for plant pathogens were al1 negative, indicating that the plant growth disorders were not related to infectious diseases.. 2.. Soil moisture Erratic crep growth was seen both during the wet season and under irrigation during the dry season.. Therefore, soil moisture. was not a factor in the lack of crep performance. 3.. Soil salts The total salt burden in the main part of the root zone was below those levels known to cause stress in plants..
(9) 4.. Soil pH. for 5.. The. measured soil pH was in the range considered. plant. growth.. Soil nitrogen Nitrogen fertilizer. 6.. deficiency was not a factor even. was. Potassium. where no nitrogen. applied.. and. magnesium. K and Mg fertilizers were applied, but no crep. 7.. benefits were. observed.. Soil analyses indicated adequate levels of K and Mg.. Phosphorus. and. heavy. metal. elements. Available soil P was moderate extremely very 8.. to be optimum. Physical. Al1. of. these. elements. were. Topographically,. contributed. to. land. the. the area. drainage. leveling. had shallow closed. problems.. operations.. and sandy lenses occurred between ,8 texture. was. soil. distinctly. physical. soil. tillage. basins which. This could be corrected by. Texturally, the surface soil was clay. b.. timely. indigenous.. characteristics. a.. the. high. Total soil P was. high, and extractable Fe, Cu, Zn, Co, and Ni were high to. high.. simple. to very. conditions. which. loam.. could. problem was observed with not. be. managed. through. operations.. Speculative Conclusions 1.. Phosphorus The. extraordinarily. large. Silty. and 1.5 m; below 1.5 m the. No special. sandy.. to clay. supply. of. soil. phosphorus. was.
(10) 8. 1. causing excessive uptake by plants and as such was inducing or contributing to nutrient imbalances.. 2.. Heavy metals Fe, Cu, and Zn, either singly or collectively, were in excess. The relatively high levels of extractable Co and Ni may have been involved ín plant nutritional disorders. No conclusions could be made on Mn which was affected by steam sterilization of the soil samples.. 3.. Reclamation The excessive phosphorus and heavy metals were indigenous to the soil parent material, and since these materials have limited solubility, reclamation cannot be achieved by routine procedures..
(11) CHEMICAL. AND. PHYSICAL. CHARACTERIZATION _. SOILS IN THE ATLANTICO 113 IRRIGATION ATLANTICO,. OF. PROBLEM. DISTRICT,. COLOMBIA. Introduction The. Atlantico. #3. Irrigation. Project is. part of the Department of Atlantico on. located. in. the north coast. the. southern. of Colombia.. It involves about 45,000 ha of land that was formerly marshy and subject. to periodic flooding from the Magdalena River.. farms were located in. Three. experimental. the district so as to represent the principal. soil types as described. in a 1965 soil survey.. Malambito,. the. largest of the three, was created specifically to evaluate. second. the capabil-. ities of the fine-textured soils which occupy nearly 45 percent of the total. project A. project. area.. cooperative was. Institute. initiated in. of. Agrarian. Agriculture (USAID),. on-farm. (ICA),. water. Atlantico. Reform United. í13. in was. the. centered. at. Colombian. for. soils. demonstration the. the. Colombian. Institute. International. drainage of. and. involving. One component. emphasized. toarse-textured. research. 1971,. the. Agency. and Utah State University.. reclamation. in. (INCORA),. States. centered at Santa Lucia, which. component. management. of. Development. of this project was and. salty. district.. soil. Another. Malambito, which was designed to evaluate. the optimum combination of soil moisture and fertility for crep production. on. the. fine-textured soils. of. the. district.. The. report was made by Olsen and Christiansen (10). A report on duction at Malambito was made by Fullerton, et al. (6).. drainage rice pro-. The purpose of.
(12) 10. this on. report is. to present the results of physical and chemical analyses. fine-textured soils in. poor. crep. an. attempt to identify the reasons for the. growth that was observed in. commercial. fields. Observed. Field. experiments. Plant. were. Growth. carried. sorghum and soybeans; but crep trolled. both experimental plots and _.. experimental. variables. fertility treatments. previously,. but. only. The. Disorders. out. involving. obscured. effects. problems. information. seedlings. tended. sesame. were. of. to. stick. together.. was characteristic. leaves. and. grown on. generally. The upper leaves. a. and produced. areas. the. general. among. grow. well.. crep. later. stages on. The corn. farmers. available.. affected. com,. emergence. of. the. of. growth,. severe. stunting. the perimeter of the older were. present.. was. that. died in some. that. In the past, researchers. explanation. after. was. The corn. areas.. Throughout. of the district, it had previously been. growth problems to saline, sodic,. Another. nature. soon. soil. recognized. as follows:. chlorotic. Growth disorders were also. extent.. were. and. reached only a fraction of the ordinary heights. the fine-textured soil. lesser. sesame,. of the young plants were deformed and. In. very few ears.. concensus. irrigation. qualitative. interveinal chlorosis. these areas. of. encountered. Necrotic patches. general. cotton,. growth variability not related to con-. The nature of the problem may be described sorghum, and. com,. low. soil. nothing except. present in and or. would. grasses but to a. others. degraded. fertility,. grasses. had sodic. brought. attributed soil about. the. conditions. by exces-. sive leaching of the soil in topographic depressions, induced. poor crep. growth.. physical. However, there. were. few. attempts. to. correlate. soil.
(13) 11 and. chemical. analyses. Sorghum crep. in. and. with. cotton. crep. were. performance.. produced. more. extensively. than. any. other. the irrigation district at the time the water management program. was established.. Sorghum. was. cotton in a l-2 sequence. generally. planted. first. during the calendar year.. and. Sesame. rotated was. with. widely. grown by irrigation district farmers during 1970 and 1971 but with little. success.. Fewer than 10 hectares. tion in this sector in late crep. of soybeans were under cultiva-. 1971 because. was unsuited to the area.. Corn. was. of the general idea that this produced. throughout Atlantico. #3 for home consumption but not as a cash crep. No rice was grown in the. district. Summary. of. at. the. Field. Cotton,. time. the. project. activities. in. given. the. in. corn,. soybeans,. sorghum, sesame. October,. 1971.. project. terminal. The. detailed. and. both. upland. report.. Table. 1. of these summarized. flooded. trials the. were. observed. studied, only rice yielded. levels.. Although irrigation was the main factor studied in other factors. and. the two-year period. results. and expected yield results; of the six crops at acceptable. initiated.. Experiments. rice were grown in a series of 14 tests over beginning. were. tested in. the crep. trying to overcome the yield deficiencies. trials, were. N, P, K, S, B, Fe, Mn, Mg, Cu, gypsum and lime. Yield increases some. cases.. were obtained with low rates of N fertilizer in. In other cases no effects were seen. results could be explained by an from previous seasons and also by the deficient part of the crep. crops.. appreciable. from N.. growth problem.. No. nevertheless, positive. modest. carryover of fertilizer N. by the limited demand on. It is clear,. These. soil N reserves. that N was not a. responses. were. obtained.
(14) 12. Table 1.. Expected yields, average experimental and commercial yields and estimates of production required to return investment in kilograms per hectare. Atlantico #3 Irrigation District, Colombia.1. Crop. Expected yields. Experimental yields Malambito 1971-1973. Corn Cotton Upland rice Inundated rice Sesame Sorghum Soybeans. 4000 1600 3100 6200 800 4000 2200. 1475 1393 3951 7302 569 2445 1722. Production required to return investment2 1464 710 -2583 305 1470 975. Commercial yields3 1968-1972 Sta. Lucia Atlantico region 83 --. --. 1088. 1335. 137 973 30. 220 1678 956. 'Adapted from "Terminal Report, On-farm Water Management Research at Granja Malambito, Atlantico, Colombia. By T. M. Fullerton, Hugo Garcia S., and D. W. James. 'Estimates of production required to cover investment were based on 1970-72 cost data obtained from the INCORA Office of Statistics, Atlantico 83. The estimate for inundated rice was based on 1970 data of the Boliver fl district and does not include fixed costs. means representing two to five seasons of production. Growing seasons where complete crep loss was experienced were not utilized in calculating averages.. % eighted.
(15) 13 to P fertilizer with any. crep, but a significant. yield with a 50 kgm P205/ha seen. decrease. treatment was observed.. in sesame. No. effects. from K, S, lime, gypsum, B or foliar-applied Fe and Mg.. positive. visual. response. was seen. with. evidently had no lasting effect on. foliar-applied. Mn,. were. One. but. this. the crep.. A series of phytopathological tests were made to assay the role of disease organisms in in. diseased. sorghum. the affected crops.. plants.. One. organism. This was a bacterium, a species. which can be present as a parasite or a saprophyte. point. was. was. Since. identified of Erwinnia,. no infection. found, the organism was thought to be functioning as a. saprophyte, and its presente infection.. A. Fusarium. was interpreted as being a secondary. organism. was. tentatively. identified. in. corn,. occurence of this pathogen was not related to variable crep. but. growth in. the area. It. was. concluded. that. valid. irrigation. production. could not be developed until the cause of crep field. could. be. determined. and. corrected, or. well-adapted to the conditions of the area objectives. information. variability in. unless. the. alternative. could be found.. of the project were thus modified to include. crops. The original. these considera-. tions. The purpose of this report is to present the results of an program. which. properties. of. istics to crep. was. designed. the. soil.. to. the. chemical. and. physical. An attempt was made to relate these character-. growth. Materials. Site. characterize. analytical. and. Methods. Description The. site. at Malambito has an. undulating topography typical of.
(16) 14 flood. plain. (alluvial). the 320 meter square. soils.. study area was 1.5 meters,. slope of about 0.5 percent. from 10 to 20 cm. collected. The undulations. vegetative. and disking). consisted. (and other trailing no recognizable physical. formed. principally. and Chenopodium. of weeds. Chenopodium, between. Ipomea,. inhabited. initial. clearing Ipomea. and some grasses.. the higher,. and analysis. occurred. intervals.. at 20 m. grid intersections. and analyzed. soil samples. were collected. to represent. points. metals. which. There were. and either. the. but the weeds did show and some Gramineae. in the lower parts of the landscape,. the grids. seldom. flooded. in two phases. on a square. Soil samples. were. while. portions.. along transects. that were known. on pH, ECe, organic. Some of these samples. First,. within. with. collected. at the. carbon,. Additional. the general. to vary widely. an. grid system. for pH and ECe at Malambito.. were taken to Utah State University. analysis. cations.. the area ranged. such as Malva,. Convulvaceae,. 8 ha was surveyed. detailed. an average. depressions. weed growth. area of approximately. samples. across. and Analysis. Soil sampling. These. within. after. of the soil or topography,. to be most prevalent. giving. closed. cover (revegatation. vines),. disorders.. Soil Sampling. extremes. in elevation. water.. relationships. features. some growth. Malva. Vertical. rain and irrigation. Typical. seemed. The net difference. area. in crep growth. at Logan. for. CEC and exchangeable. were analyzed. for phosphorus. and heavy. also. The other phase of sampling. analyses. control. A series. was especially. of 12 composite. plots of a field corn trial.. soil samples Plant. for P and heavy metal was collected. samples. from. were taken to estimate.
(17) 15. the dry matter at each. soil sampling point.. were taken at various places to estimate. Another. group. vertical changes. of. samples. in soil. properties. Al1. of the soil samples that were transported to Utah State. University Plant. were. subjected. Quarantine. Methods. of. method. Station. Soil. Particle (1).. to in. Physical. size. autoclave Miami,. and. steam. sterilization. the. USDA. Florida.. Chemical. Analysis. was. by. distribution. at. done. Subsamples of 40 g were used. the. Bouyoucos. hydrometer. for this analysis.. Results. are reported as percent sand, silt, and clay. Measurements of soil pH were made using saturated paste, 1:l water and 1:2 soil-.Ol. MCaC12. systems.. ECe. was measured on the. saturation extract.. Oxidizable carbon. was estimated by the micro-. procedure. (3).. plus. of. determined. Chesnin. with. an. Exchangeable. atomic. absorption. soluble. cations. spectrophotometer. after. were triple. extraction of 5 g of soil with neutral, normal, ammonium acetate, the. procedure. outlined. milliequivalents (CEC). per. 100. by g. Jackson of. (8).. oven-dry. soil-. Results soil.. are Cation. using. reported in exchange. capacity. was determined by the micromethod of Kinney and Bremner (7).. Results for CEC (meq/lOO. milliequivalents per 100 g of soil. g> .. Phosphorus (HC03-P). are expressed in. analyses. included. both. (12) and a perchloric acid. the. Olsen. test. for. available. P. digestion for total P (14). The. Olsen test results are given as ppm and the perchloric acid. digestion. results are given as percent of total P in the soil. Heavy metal analyses in. the soils were done by extracting soil. samples with DTPA according to the procedure given by Lindsay and Norvell.
(18) 16. (9) *. The interpretation of DTPA soil analyses was given by Viets and. Lindsay. (16).. Their. work is. Malambito. soils.. summarized in. Appendix A for comparison. with. the. used. to analyze for Cu, Co, Ni, Mn, Fe and Zn.. An. atomic. absorption. spectrophotometer The. results. for. was these. elements are given as ppm in the soil. There are severa1 reports in. the literature (4, 5, 15) which. indicate. that heat treating of soil (as in. process). sharply increases. of. comparison,. senting Utah in. an. irrigated fields in. treated with. autoclave.. Appendix. the leve1 of extractable Mn.. For. purpose. therefore, a series of twelve Utah soil samples repre-. commercial. were. the steam sterilization. DTPA. before. a four-county area. and. after. steam. of northern. sterilization. The results of this series of analyses are given in. B. Results. Soil Morphology Soil the. texture was slightly finer in. difference. in clay. classified. as. clay. variability. of. subsoil. content. loam. was not great and al1 surface soil was. texture. regardless. texture because. of. position.. exist. The A. surface. vertical soil. typical. soil. 1.. O-40 cm.. was. variations darkened. profile. were. Dark colored. related. slightly. description. was. wide. The soil in. alluvial origin; therefore, no genetic. is of recent. The. There. of silty or sandy lenses. In. general, the texture was distinctly sandy below 1.5 m. this area. However,. the topographic 10~s.. by. to. depositional. organic. matter. horizons strata.. accumulations.. follows:. clay to silty clay, massive and hard. when dry, little structure,. plastic and very. sticky when.
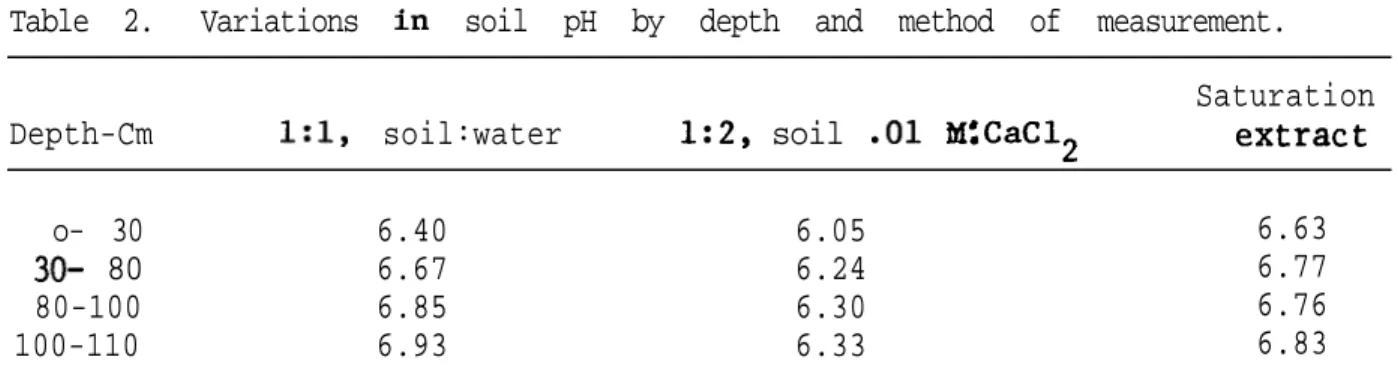
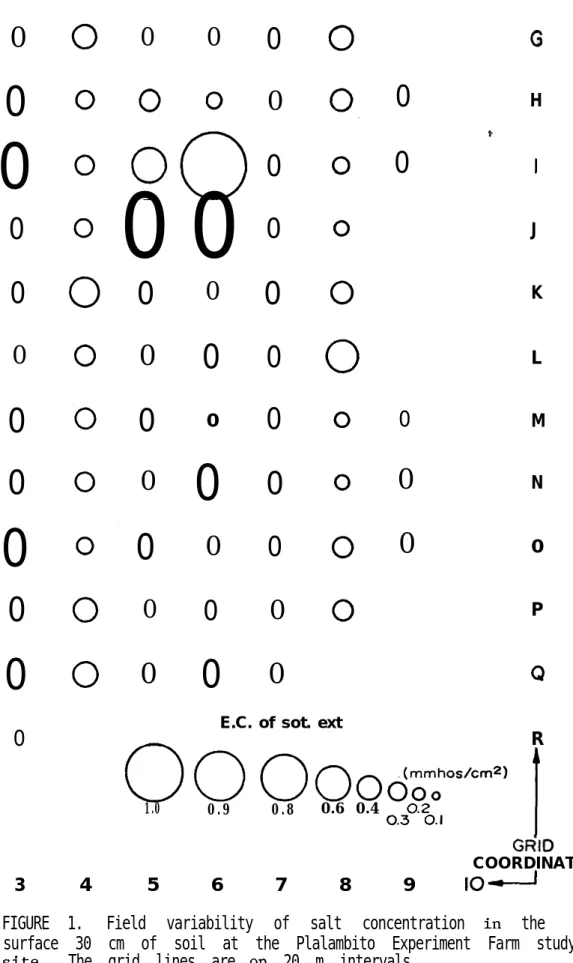
(19) 17 wet, abundant. 2.. 40-80 cm.. roots,. gradual. Light colored. structureless, mottled,. 3.. 80+ cm.. Silty. non-plastic,. loam. transition. silty clay, some. roots,. grading. to. to. the. next. stratum.. hard when dry, boundary uneven.. sandy. loam,. structureless,. few fine roots.. The water table fluctuated between 1 and 2 m of the surface, corresponding. to. the. wet. and. dry. seasons,. respectively.. Preliminary Chemical Analyses Laboratory. results. obtained in. Atlantico. indicated. that. soil. pH. The pH ranged from. was lowest as measured in the 0.01 m CaCl 2 system.. 5.5 to 6.5 in the surface 30 cm and increased gradually to a range of 6 to 6.8 at the lower depths. slightly. higher.. pH in the saturation extract. was. Table 2 shows the averages of soil pH at four depths. by the three methods at 30 soil sampling points. Horizontal surface. soils. concentration and. horizontal. variation. indicated. here,. increased in. salt. of with. salts. varied. depth.. concentration. Figure in. 1 the. mmhos at one point.. in. demonstrates sampling. the ECe ranged as high as 1 mmho/cm.. values (not shown) were much. the the. area.. Subsoil. As. ECe. more variable, ranging as high as 9. However, the average ECe. representing the 30 to 95 cm depth range in was 1.9.. continuously. from 40 samples, two different transects,. In two other sampling transects, the ECe. was never above. 1.5. at any depth. Detailed Physical and Done at Logan, Utah. Chemical. Analyses. A set of 30 soil samples of the O-30 cm layer of soil, representing one transect through an area. of good and bad crep. growth, was.
(20) 18. Table 2.. Variations in. soil pH by depth and method of measurement.. Depth-Cm. l:l,. 1:2, soil .Ol M:CaC12. o- 30 30- 80 80-100 100-110. soil:water 6.40 6.67 6.85 6.93. 6.05 6.24 6.30 6.33. Saturation extract 6.63 6.77 6.76 6.83.
(21) 19. 0. 0. 0. 0. OO 00. 0 0. 0. G. 0. 0. 0. 0. H + I. 0. J. 0. 0. 0. K. 0. 0. 0. 0. L. 0. 0. 0. 0. 0. M. 0. 0. 0. 0. 0. N. 0. 0. 0. 0. 0. 0. 0. 0. 0. 0. P. 0. 0. 0. 0. Q. E.C. of sot. ext. R. 0. 0 1.0. 3. 4. 5. 0.9. 6. 0.8. 7. 0.6 0.4. 8. 0.3%.1. 9. 1. GRID COORDINATES. IOd. FIGURE 1. Field variability of salt concentration in the surface 30 cm of soil at the Plalambito Experiment Farm study site. The grid lines are on 20 m intervals..
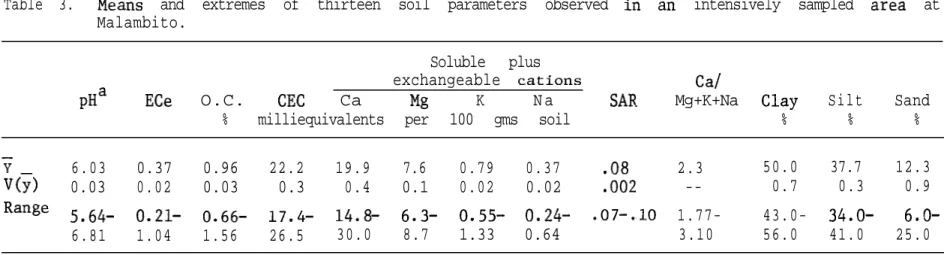
(22) 20 analyzed. for. ll. summarized in those. parameters.. Table 3.. obtained. substantiated. soil. in. The results of these analyses are. The results for pH and ECe. Colombia.. the clay. The. loam. analyses. texture. for. different. from. arable. productive. textura1. estimated in. the parameters given in Table 3 indicate. were analogous to classifications. the field.. that this soil was markedly. soils. for. these. particular. Correlations were run between the parameters given in corn The. coefficient. of. determination 0.30. from. between. the. linear. soluble. Other. coefficients. and not worthy of note.. The. of. weak. association. and Ca, Mg, K and Na might indicate this. possibility. crep. trials.. was,. As. however, not. stated. determination. had little or no effect on the crep. calcium. + K + Na. were. between. much. corn. VS.. smaller plant. height. an imbalance of these nutrients; substantiated. previously,. analysis. exchangeable. and plant height and that r2 = 0.36 for the ratio Ca/Mg height.. the transect.. regression. plus. measurements.. Table 3 and. plant height as observed at the 30 sampling points in. indicated that the r2 =. plant. None of. potassium. during. the. fertilizer. actual applications. production and neither did applica-. tions of gypsum or lime. Phosphorus. and. Heavy. Metal. Analyses. The first phase of sampling, represented by the 30 soil samples of Table 3, were anlayzed for HCO -extractable P, total P, and DTPA3 extractable Co, Cu, Fe, Mn, Ni, and Zn. The results are summarized in Tables 4 and 5. Phosphorus For soils of pH 6.8 and above, sufficiency. for. the crops. tested. 10 ppm of HC03-P would indicate. (Table. 1).. Therefore,. the. range in. P.
(23) Table 3.. Means and extremes of thirteen soil parameters observed in Malambito. Soluble plus exchangeable cations O.C. CEC Ca K Na Mg % milliequivalents per 100 gms soil. pHa. ECe. Y VG>. 6.03 0.03. 0.37 0.02. 0.96 0.03. 22.2 0.3. 19.9 0.4. 7.6 0.1. 0.79 0.02. 0.37 0.02. .08 .002. Range. 5.646.81. 0.211.04. 0.661.56. 17.426.5. 14.830.0. 6.38.7. 0.551.33. 0.240.64. .07-.lO. aAs determined in .Ol M CaCl. 2'. SAR. an. intensively sampled area. Ca/ Mg+K+Na. at. Clay %. Silt %. Sand %. 2.3 --. 50.0 0.7. 37.7 0.3. 12.3 0.9. 1.773.10. 43.056.0. 34.041.0. 6.025.0.
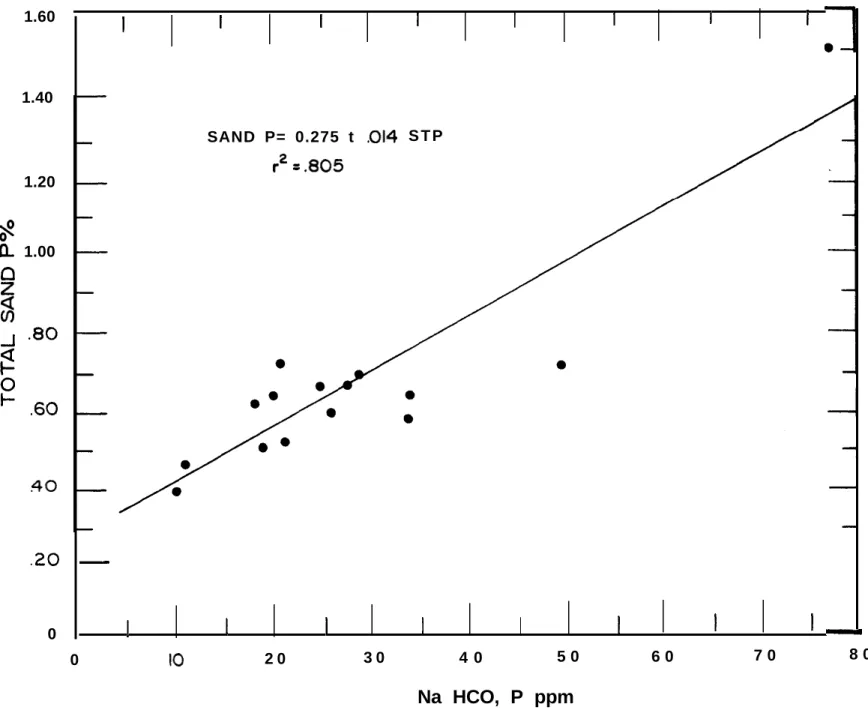
(24) 22 Table 4 of 6 to 77 ppm P indicates high. among. the. points. sampled.. that available P was low to very. The average soil test P (as would be. obtained from a composite sample from the area). for the area. (24.2 ppm,. Table 4) would be interpreted as meaning no plant stress of any. kind. from available soil P. The estimates for total P (Table 5) were probably conservative since. the procedure used. thorough the. methods. sand. here. (14).. fraction. with more. The results for total P in the whole soil and. were. the whole soil P is. underestimates P as compared. quite. comparable. (Table. 5).. It. appears. that. controlled by the sand, and ultimately therefore,. the rock from which the sand originated.. Brady. (2). reported. the. results. for total P analyses from three groups of 36 surface USA soils. These soils averaged .074 among. the. percent of P and ranged from .04 to 0.15 percent P. different. soil. indicating. are quite remarkable-5 to 20 times as much Available 2. illustrates. relationship. to. portray. available. another unusual,. that. results in the. Table 5, therefore,. Malambito. soils. contained. was strongly correlated with total P.. association.. total P is usually very. The. P.. This undoubtedly is due to the fact. low.. Therefore, the results of Figure 2. if not unique, finding. total P, that total P controls. P. then HC03-P. availability in. availability. could. for. the. P availability to plants.. would have to be qualified as a direct this soil. limit. Figure. For normal soils total soil P bears no. Malambito. It may be inferred from the strong relationship between HC03-P. true,. from. P as the average of the 36 soils reported by Brady.. or HC03-P this. groups.. crep. It is growth.. that. soil.. and. If this is indicator. possible that the excessive P. of.
(25) 23. Table 4.. The means and extremes of soil extractable P, Co, C y9 Fe, Mn, Ni, and Zn from a transect of 30 soil samples.5 Element--ppm cu Fe. Mean. 24.2. 0.68. Range. 6.077.2. 0.241.32. "HC03. Table 5.. 2.387.12. extraction for P.. DTPA. Mn. Ni. 46.32. 40.61. 2.11. 18.296.2. 22.474.0. 1.083.50. extraction. Zn. 2.1611.00. for metals.. The means and extremes and regression values of total P in the sand fraction and whole soil Total Sand Mean Range. .661 .40-1.51. P. percent Whole soil .698 .40-1.65. Soil total P = -. 036 + 1.112 sand total P r2 = .981.
(26) 24. 1.60. I. I. 1. I. I. I. I. I. /. 1.40 SAND P= 0.275 t .Ol4 S T P r2 = .805 1.20 8 n 1.00 n 3 .80. .60. .40. .20. 1. 0 0. I. I 10. 20. 30. 40. 50. 60. Na HCO, P ppm FIGURE soil:. I. I. I. I. I. 2. The relationship between total P in sand and HCO 3- extractable P in the whole first sampling phase, Malambito.. 70. -. 80.
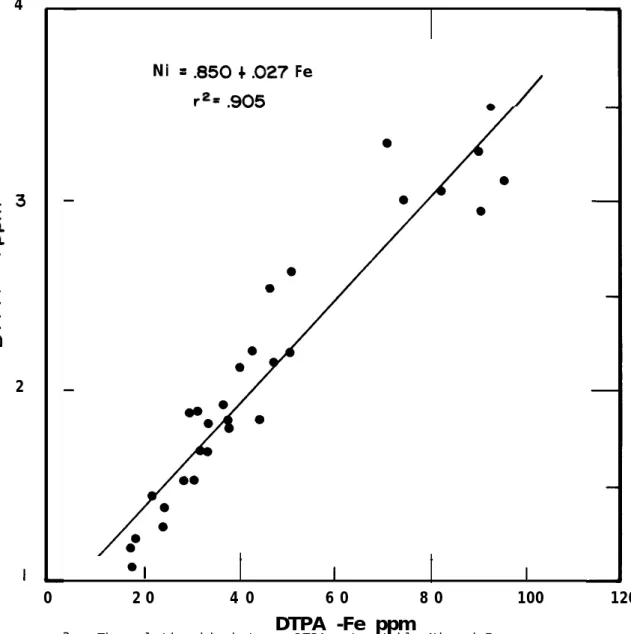
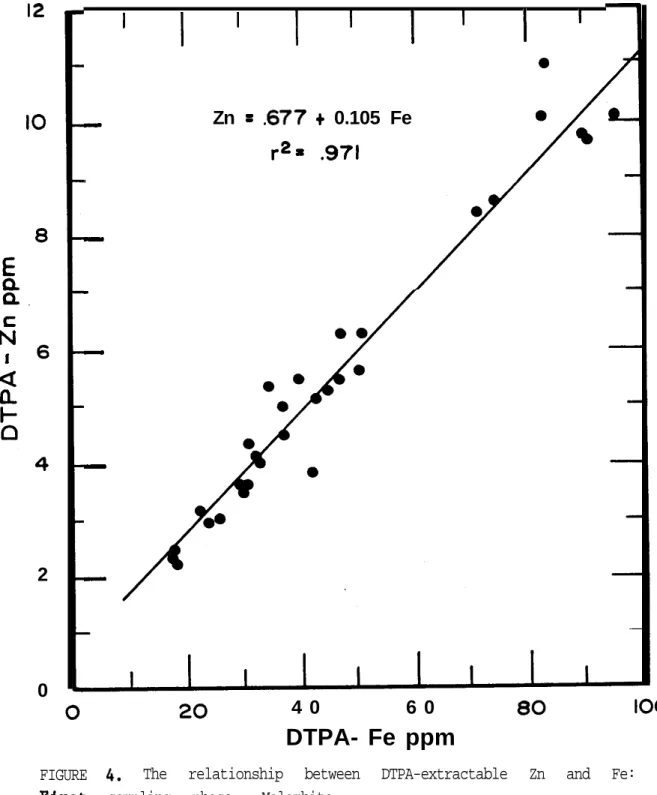
(27) 25 Heavy Metals The results in with. Appendix. A. Table 4 for the metal elements should be compared. for. estímates on. Appendix B for estimates on. relative. availability. increased Mn by about 22 fold. by. 86. percent,. 66. At the same. percent,. and. of these metals complex.. It. compete on a mass. ís. extractable Cu,. apparent,. indicator,. therefore, that. ín Mn.. Utah soils. 79. percent,. respectively.. ín the Utah samples.. Al1. the. relatívely. small decrease. heating the Utah samples resulted. it ís evídent that extractable Cu, Fe, and Zn ín the. Further, Mn would decrease observed.. extremely. in. Usíng the results of Appendix B as an. Malambíto soíls would íncrease. adequacy. indícated. action basís for lígands in the DTPA. Fe, and Zn upon. from the large increase. the. time, Cu, Fe, and Zn. Extractable Cu and Ni could not be detected. ín. As. B, the autoclave heat treatment of referente. decreased. with. the effect of steam sterílization on. amount of each element found in the soil extract. Appendíx. and. somewhat íf they were not heated.. to a very. small fraction of the amounts. Whereas these observatíons leave of. available. high. Ni, of course,. as. Mn. compared. at. some. doubt as to the. Malambito, the other metals to. levels. associated. with. were high to nutrient. deficíency.. is not a nutríent element but it may alter plant. enzyme. systems. The Utah data showed no associatíon among the extracted probably. because. parent. materials.. elements,. they carne from widely separated sítes and variable On the other hand, the. Malambito. data. indícate. that 90 to 97 percent of the variabilíty between Cu, Ni, Zn, and Fe were. explained. by. simple. linear. regression. are illustrated in Figures 3 and 4 for Ni. (Table VS.. 6).. Fe and Zn. The relationships VS.. Fe.. For.
(28) 26. ----. 4. Ni = .850 + .027 Fe r2= .905. E3 st .-. Z I. z cl 2. I 0. 20. 4 0. I 60. 80. 1 100. DTPA -Fe ppm. FIGURE 3. The relationship between DTPA-extractable Ni and Fe: sampling phase, Malambito.. first. 120.
(29) 27. 12. 10. I -. I. I. I. I. I. I. I. I 0. Zn = .677 + 0.105 Fe r2= .971. . m -. -. 2. -. 0. 40. 60. DTPA- Fe ppm FIGURE Pirst. 4. The relationship between sampling phase, Malambito.. DTPA-extractable. Zn. and. Fe:.
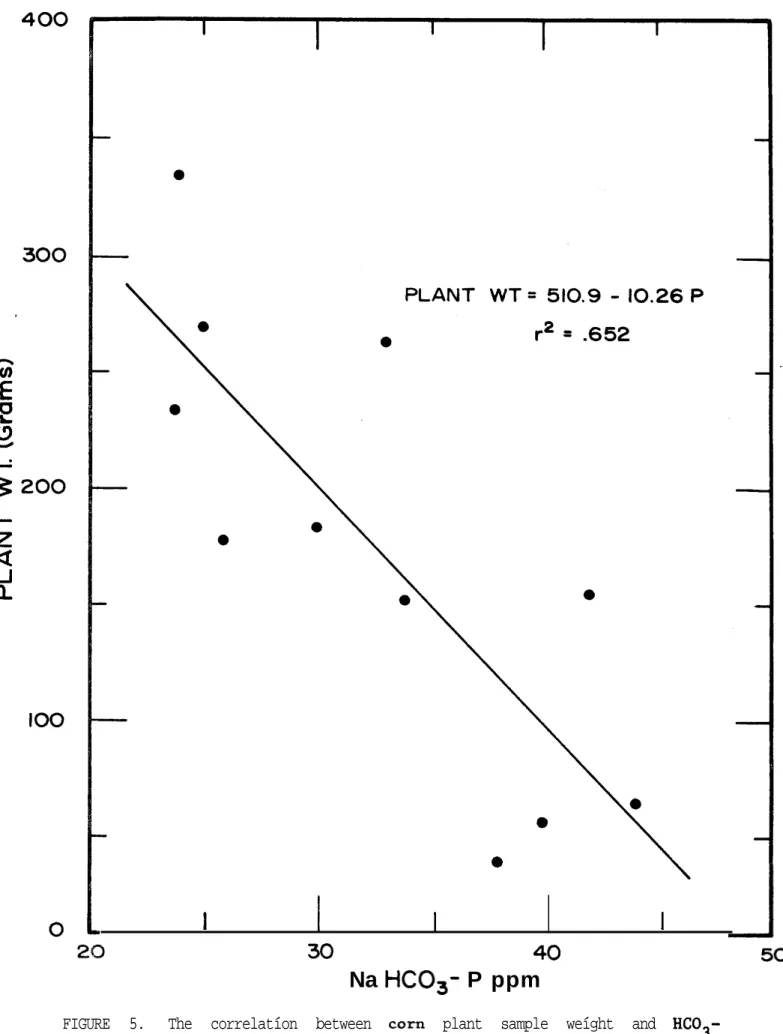
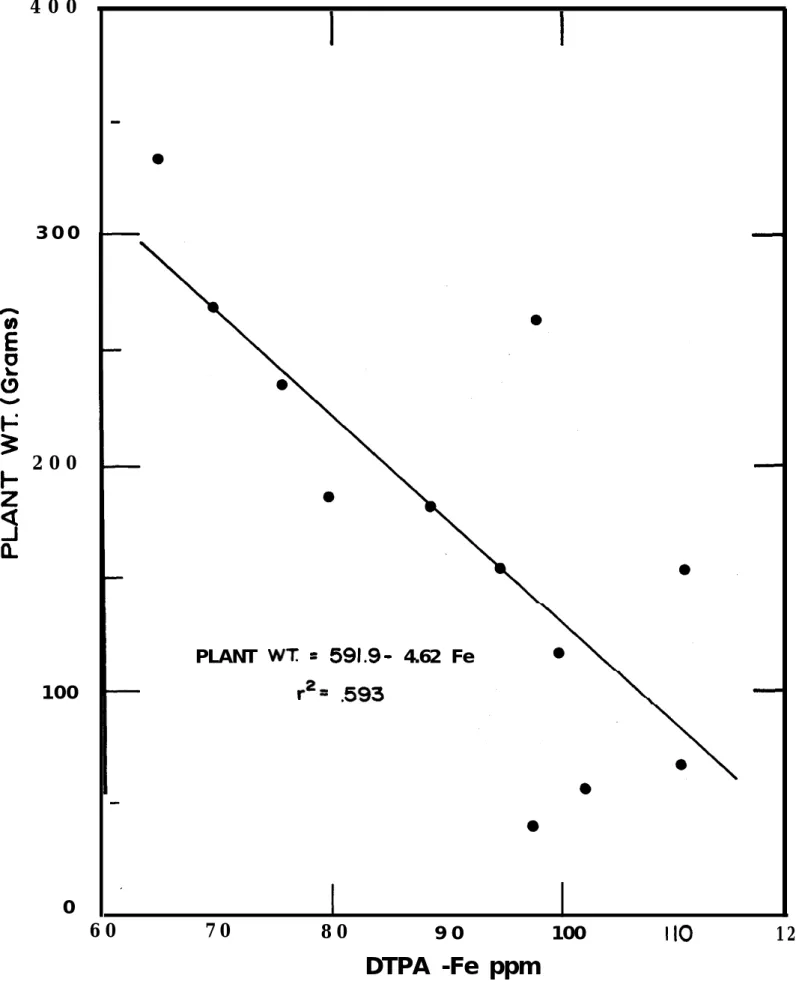
(30) 28. Co and HC03-P regression with Fe accounted for about 50 percent of the variability.. No associations were found between Mn and the other. elements probably because Mn changed so drastically on heating and because the absolute amount of extractable Mn was probably very low before soil heating.. Second Phase, Malambito Soil Sampling The second phase samples comprised a total of 12 soil samples which were taken from control plots of an established corn trial. Regression analyses of the results are given in Table 7.. Here it is. apparent that the associations between HCO -P and Fe, Zn, and Cu, 3. respectively, were somewhat reduced as compared to the first phase sampling.. However, there was a rather striking relationship between. plant dry weight and HC03-P and plant dry weight and DTPA-Fe. results are illustrated in Figures 5 and 6. variability between plant weight and linear regression.. These. About 60 percent of the. HC03 -P were explained by the simple. Because of the relationships between plant weight. and soil Fe and P (Table 5 and Figure 7), a multiple regression analysis was made with these two elements. multiple R2 for plant weight. VS .. This analysis indicated that the Fe and P was 0.653, indicating that. there was no probable interaction between Fe and P in these plant yield results. Subsoil samples were obtained from four different points. in the. field to estimate variability of extractable elements with depth. These results are summarized in Table 8. metals decreased in. As indicated, the heavy. depth at every sampling point.. Therefore, it is. apparent that if any of these components were involved in the poor crep. production, essentially al1 the effect was localized in the O-20 or.
(31) 29. Table 6.. Linear regression analysis for P and metal elements from 30 soil sample transects. Regression Coefficients. Cu Ni Zn Co Fe. Table 7.. VS VS VS VS VS. Fe Fe Fe Fe STP. bO. bl. 1.59 0.850 0.677 0.32 18.28. 0.062 0.027 0.105 0.008 1.16. r2 0.891 0.905 0.971 0.469 0.471. Second phase soil and plant sampling: regression analysis for various combinations of parameters. 12 soil samples.. Comparison Plant Plant Fe VS Zn VS Cu VS. Coefficient of determination. wt VS Fe wt VS HC03-P HCQ3-P Fe Fe. Regression -Coefficients bO. 591.9 510.9 25.42 5.46 7.42. bl -4.62 -10.26 1.98 0.024 -0.01. Coefficient of determination r2 0.593 0.652 0.878 0.571 0.185.
(32) 1. I. I. 30. I 40. Na HCO,- P ppm FIGURE 5. extractable. The correlatíon between corn P: eecond samplíng phase,. plant sample weíght and HC03Malambíto..
(33) 3: 400. 300. 3 lQ ti!. 200. PLANT WT = 591.9- 4.62 Fe p, 593. 100. 0 60. 70. 80. 90. 100. I 10. DTPA -Fe ppm FIGURE 6. The correlatlon between corn plant welght and DTPA-extractable Fe: second sampling phase, Malmbito.. 120.
(34) 32. 100. 80. 0 60. --. I. 1 -30. I. I. -40. Na HCO,-P ppm FIGURE 7. The extractable P:. relationshlp between DTPA-extractable second sampllng phase, Malambito.. Fe. and. HC03-.
(35) 33. Table 8. Field sample point. DTPA extractable metals as related to soil sample depth and field location. Depth cm. Fe PPm. 1. O-20 20-46 46-61 61-76 76-91 91-107 107-122. 112 51 17 15 14 18 19. 2. O-18 18-36. 80 35. 3. O-18 18-36. 4. O-20 20-40. Zn wm. cu mm. Mn wm. Ni. 5.1 3.8 2.5 1.4 1.0 1.2 1.2. 46 17 8 7 6 9 9. 1.37 0.72 0.38 0.05 0.26 0.31 0.37. 15.0 5.3. 7.7 5.7. 39 25. 1.38 0.61. 78 37. 7.0 3.4. 6.6 5.4. 34 16. 1.59 0.79. 61 24. 5.6 2.8. 6.0 4.4. 43 31. 1.73 0.88. 6.9 3.0 1.5 1.3 1.3 1.5 1.5. (l-in rice plots; 2-sterile spot; 3-poor soil in multicrop test; 4-good soil in multicrop test.).
(36) 34. O-30 cm soil layer. Discussion In June, 1975, 20 months after the field work had been in. this. irrigation. research. an. attempt to gain more information on. project, we went back to the field site in the Malambito soil problems.. But no crops were growing on the plot area locate. and it was not possible to. the bad spots.. Data that are given here the. terminated. fine-textured. soils. at. on. the physical and chemical nature of. Malambito. strongly. implicate. plant. nutrient. imbalances or elemental toxicities as the cause of poor crep Data. obtained. in. implications. different. the. As. crops. crep. already. were. yield. trials. indicated,. conducted. during. partly. 14. field. the. substantiate trials. 2-year. growth. these. involving. lifetime. of. six. the. project. Chemical analyses of plant tissue samples was limited to one set of leaf samples from one sesame trial.. In this case higher leaf P. concentrations were associated with a statistically in. yield.. large. decrease. It was not feasible to obtain more plant analyses, but a. investment in. unequivacally crep. significant. the. this kind of work would be required to establish. actual. cause. and. affect. relationships. of. the. poor. growth. Severa1 kinds of conclusions. (considering. data. presented here. and Fullerton et al. (6)). and some. are, in. varying. can be derived from the total program and. also. the. project. Some of these conclusions degrees,. speculative.. terminal. report. are definitive.
(37) 35 Definitive Conclusions Plant pathogens. Tests. made. for. plant. pathogens. were. al1. negative,. indicating that the plant growth disorders had to be attributed to soil, chemical. or. Soil season. nutritional moisture. stresses. Erratic crep. growth was seen. both during the wet. and under irrigation during the dry season;. therefore, soil. moisture was not a factor. So-ll salts. The. total. salt. concentration in. the. main. part. of. the. root zone was below those levels known to cause osmotic stress in plants. Soil pH optimum. The measured soil pH was in the range considered. for. excessive. plant. Na. associated. Nitrogen applied.. crep. N. deficiency and. high.. high. symptoms. affects were observed.. Phosphorus some. with. magnesium. field trials would have. in. Neither excessive Al because pH. were. and. were. not. of low pH nor. involved.. Soil N was not a factor even. Potassium no. growth.. to be. where no N fertilizer was. expressed.. K and Mg fertilizers were applied, but Soil. analyses. done. subsequent. to. the. predicted null responses to K and Mg.. metal. elements. Total soil P was extremely high. samples and extractable Fe, Cu, Zn, Co and Ni were high to very. Al1. of these elements were of geologic origin.. Speculative Results It in to. is. hypothesized that the extraordinary supply of soil. excessive uptake by the plants and as such nutrient. P resulted. was inducing or contributing. imbalances.. Related to the excessive P were possible excesses of Fe, Cu, Zn,. either. singly. or. collectively.. The. relatively. high. levels. of. and.
(38) 36. extractable Co and Ni may or may not have. been. Since al1 of the metals were extracted same. reagent, it. of the system.. is. possible. that. However, this. when the same. altered. interpretation. available in any. way. at the same time and by the. strong. possibility. correlations. reduces. to. a. were. small. artifacts probability. analyses on other kinds of soils are considered.. With regard to Mn, the undoubtedly. the. involved.. this. heat. element. treatment beyond. of. any. the. Malambito. point. of. samples. reasonable. It is possible on one hand that this element was. normal or adequate range so that it was not associated in. with. plant. nutritional. stress.. hypothesis about excessive P, Fe, Cu,. On the other hand, if the. Zn, Co, and Ni is true, what. might have been normal Mn nutrition otherwise could have been induced Mn. deficiency. because. of. needs to be analyzed in. altered. coenzyme. roles.. undoubtedly caused. extractable Fe, Cu, Zn, Co, and Ni.. This. that. excessive. elements. were. area. clearly. detail.. The heat-released Mn also. these. This. present in. a reduction in. increases. the. amounts in. probability the. untreated. soil in the field. If. future. work. substantiates. the. hypothesis. of. excessive. no solution to the soil fertility problem is. obvious.. only. other. crops. alternative. as. already. suggested. or cultivars may be found.. evidently. of. geologic. mineral complex,. origin,. reclamation. (6). Since. or the. Rice may be the. kinds. excessive. elements,. of. tolerant. elements. are. i.e., part of the indigenous soil. cannot. be. achieved. by. routine procedures.. ..
(39) 37. Literature Cited 1.. Bouyoucos, George J. 1962. Hydrometer method improved for particle size analysis of soils. Agronomy Journal 54:464-5.. 2.. Brady, Nyle C. 1974. The Millan, New York. 8th Ed.. 3.. Chesnin, Leon. 1950. Modification of the Smith-Weldon wet combustion procedure for the micro-determination of soil organic matter. Agronomy Journal 42:385-6.. 4.. Dawson, J. Influente biological Ann. Appl.. 5.. Fujimoto, Charles K. and G. Donald Sherman. 1945. The effect of drying, heating, and wetting on the leve1 of exchangeable manganese in Hawaiian soils. Soil Sci. Soc. Am. Pro. 10:107-112.. 6.. Fullerton, T. M., Hugo Garcia S., Luis Molina M., and D. W. James. 1975. Rice as an alternative crep in the Santa Lucia region of the Atlantico 53 Irrigation District, Utah State University, CID 75-A-160.. 7.. Keeney, D. R. and J. M. Bremner. 1969. üetermination of soil cation exchange capacity of a simple semi-micro technique. Soil Science 107:334-336.. 8.. Jackson, M. L. 498 pp.. 9.. Lindsay, W. L. and W. A. Norvell. 1969. Development of micronutrient soil test. Agron. Abstracts, page 84.. Nature. and. Properties. of. Soils.. making Mac-. R., R. A. H. Johnson, P. Adams, F. T. Last. 1965. of steam/air mixtures, when used for,heating soil, on and chemical properties that affect seedling growth. Biol. 56:243-251.. 1958.. Soil. Chemical. Analysis.. Prentice-Hall, Inc. a. DTPA. 10.. Tentative soil test Northwest Soil and Plant Test Group. 1975. adequacy levels for phosphorus and potassium. Proc. 26th An. Pacific N. W. Fert. Conf., Salt Lake City, Utah, July 15-17.. ll.. Olsen, Edwin C. III and J. E. Christiansen. 1974. Land drainage and soil reclamation procedures in arid and sub-humid areas of developing countries using as an example the Atlantico #3 project, Colombia. Utah State University CUSUSWASH 74-A-322.. 12.. Olsen, S. R., C. V. Cole, F. S. Watanabe, and L. A. Dean. Estimation of available phosphorus in soils by extraction sodium bicarbonate. U. S. Dept. Ag. Circ. 939.. 13.. Rubink, William L. 1973. An intensive edaphological characterization of the soils of Malambito Experimental Station and its implications in future agricultura1 research. MS thesis. Utah State. 1954. with.
(40) 38. University,. Logan,. Utah.. 14.. Sherrell, C. G. and W. M. H. Saunders. 1966. An evaluation of methods for determination of total phosphorus in soils. New Zealand, J. Ag. Res. 9:972-979.. 15.. Singh, Mahendra and A. N. Pathak. 1970. Effect of heating and steam sterilization on soil manganese. Plant and Soil 33:244-248.. 16.. Viets, F. G. Jr. and W. L. Lindsay. 1973. Testing soils for zinc, copper, manganese, and iron. In Soil Testing and Plant Analysis (Revised). L. M. Walsh and>. D. Beaton, Editors. Soil Sci. Soc. Am., Madison, Wis..
(41) 39. Appendix The following table is an. A. from Viets and Lindsay (16). It provides. interpretation of the DTPA diagnostic. status of Cu, .Fe,. Mn, and Zn.. limits of the adequacy range.. test for the soil fertility. The highest levels shown are the lower No. information. was. toxicity levels of these elements as determined in. Table A. 1.. Nutrient. cu Fe Mn Zn. available. ppm extracted from soils Deficient Pfarginal Adequate. --2.5-4.5 --0.5-1.0. possible. the DTPA procedure.. Critica1 levels of DTPA-extractable micronutrients for sensitive crops.. co.2 ~2.5 cl.0 co.5. on. >0.2 >4.5 >l.O >l.O.
(42) 40. Appendix It. was. necessary. to. steam. B. sterilize. the. Colombian. soil. samples. upon. bringing them through the plant quarantine station to the USA.. Since. heat treatment drastically alters extractable Mn (4, 5, 15>,. a group of 12 Utah soils were analyzed for P and heavy metal elements before. and. after. commercial These. autoclave. heat. irrigated fields in. soils. are. not. subsurface.. Malambito soils have soluble. and. These. a four-county area. necessarily. analogous. they are from a semiarid region and/or. treatment.. to. soils. represented. of northern Utah.. the. Malambito. and contained some. CaC. soils, since. in the surface. The pH ranged from 7.5 to 8.2. Although the no free CaC. exchangeable. and are lower in pH, the leve1 of. calcium in. the. Colombian. soils is. high. to justify a broad comparison of the DTPA extraction effects. soil extraction and analyses procedures Malambito and the Utah referente. were the same. soil samples.. enough The. for both the. The results for the. Utah soils are given in Tables B.l and B.2. There was a slight reduction in HC08 extractable-P This change elements. phosphate. was probably independent of the changes The. or. heat. treatment. possibly caused. similar. compounds. to less. change in HC08 - P upon change. in. soluble. heating was not large. in the other. reversion. forms.. heating.. of. dicalcium. The small. enough to cause a major. the interpretation of the results.. Co and Ni were not detectable treatment. a. seen. with. in. amounts, while. the Utah samples. Mn. increased. Cu,. about. either before. or after the heat. Fe, and Zn decreased in 22-fold.. Since these metals. varying compete.
(43) 41 for the ligands in the DTPA complex,. it is evident that the mass. effect from the heat-released Mn decreased the amounts of Cu, Zn. action. Fe, and. found in the extracts. Table B.2 shows that the elements that changed. treatment. also. had. successively. lower. coefficients. most upon of. The regression equations for Cu and Zn could be used before-heating. levels. of. these. elements in. regression equation for Fe could be used. the. determination.. to predict. Malambito. but with less. The regression equation for Mn would not be used. soils.. Element. because. P co cu Fe Mn Ni Zn. 7.0-66 --0.9-2.8 0.6-2.8 2.0-6.0 --0.8-3.3. 19.08 0.0 1.89 1.06 3.77 0.0 1.32. Table B. 2.. P" Cu" Fe' Mn0 Zn' a e.g.:. With Range wm. heat Mean wm. 6.0-50 --0.8-2.7 0.1-1.6 35.0-127.0 --0.7-2.9. 18.23 0.0 1.62 0.70 82.69 0.0 1.04. Mean Ratio. 0.955 --0.857 0.660 21.93 --0.788. Regression analysis of autoclave heat effects on element extractability from thirteen Utah reference soils.. = 4.04 = -0.24 = 0.164 = 54.01 = -0.067. + + + + +. 0.744 0.985 0.505 7.61 0.836. p0 is autoclaved pre-treatment.. pa, Cu, Fe, Mn, Zn,. r2 r2 r2 r2 r2. = = = = =. 0.955 0.957 0.696 0.104 0.950. soil and P is no. The. of its poor. Autoclave heat treatment effects on extractability of P, Co, Cu, Fe, Mn, Ni, and Zn in thirteen Utah referente soils. No heat Range Mean wm wm. the. confidente.. predictability.. Table B. 1.. heat.
(44)
Figure

+7

Documento similar