PPG Beat Reconstruction Based on Shape
Models and Probabilistic Templates for Signals
Acquired with Conventional Smartphones
Diego Mart´ın–Mart´ınez1,2, Alexandre Domingues2,
Pablo Casaseca–de–la–Higuera1,3, Carlos Alberola–L´opez1, and Jo˜ao Sanches2
1 Universidad de Valladolid, Valladolid, Spain 2
Instituto Superior T´ecnico, Universidade T´ecnica de Lisboa, Lisboa, Portugal
3 University of the West of Scotland, Paisley, Scotland, UK
Abstract. Ubiquitous monitoring has become a useful tool for the
pre-vention and early diagnosis of some disorders. This kind of monitoring has been promoted last years thanks to the irruption of the smartphones, which make easier the collection and delivery of the patient’s data. How-ever, there are some problems with the quality of the acquired data. This paper presents a novel methodology in which the shape of PPG beats is recovered through a multistage full-automatic pipeline including shape modeling stage and template–based (template estimated from the sur-rounding beats) shape recovery through a level–set approach. To validate the proposal, a registry acquired using the camera of aMotorola MotoG
has been used. Results can be qualified as promising, since the shape of damaged beats is recovered, however a more comprehensive validation must be addressed.
Keywords: Ubiquitous monitoring, smartphone, photopletysmography,
shape model, probabilistic template, level–set.
1
Introduction
II
to make swifter the deployment of that technology as they can cope with the tasks of collecting the information and uploading it to the network. Currently, some companies are taking the step towards the ubiquitous monitoring through smartphones by embedding the acquisition devices into them, so one can find some plug–and–play devices able to provide an accurate ECG as well as sev-eral contributions on how to acquire PPG signals by means of the smartphone camera. Since almost all the smartphones have camera, and PPG can provide information about some relevant aspects of the cardiovascular system (heart rate, arterial stiffness, cardiac output, etc.) [2],[3], this might be the branch of the ubiquitous monitoring to explore firstly however, so far, the quality of these signals is not good enough to use them for clinical purposes.
There are several methods in literature aiming at improving the quality of PPG signals, however to the best of our knowledge, none of them is aimed at correcting the shape of pulses, but just at removing some mild artifacts (trend, low amplitude noise, etc.) and replacing the corrupted pieces (manually iden-tified) by means of statistically equivalent strings of synthetic pulses ([4], for instance). In this paper, we propose a novel methodology that strives for recov-ering the shape of damaged pulses according to the shape of the surrounding ones. So, the current proposal differs from the so far proposed ones in the fol-lowing aspects: 1) the method is full-automatic, and 2) the reconstructed shape is obtained, through a level–set based approach, taking into account the shape of the corrupted pulse and a template consisting on a cumulative density func-tion estimated from the surrounding pulses. The assessment of the proposal has been performed only with one signal, so this work must be qualified as a first approach; nevertheless, results are promising enough, which invites to continue working in this line.
This paper is structured as follows: a broad description of the proposal is pre-sented in section 2, whereas the validation is addressed in section 3; to conclude, a summary of the most relevant conclusions is brought in section 4.
2
Methods
As was stated in section 1, this work presents a methodology striving for recov-ering the original shape of pulses that has been degraded in a large extent. To this end, we have developed a three–stages methodology, namely, preprocessing, shape modeling and shape recovery. It must be noted that the contribution of this work lies on the third stage, since both the first and the second stages are described in literature.
2.1 Preprocessing
III
Resampling.– Registries resulting from the camera consist of a set of du-plas representing the timestamps and the corresponding amplitude values , i.e., [tn, xn]. As far as we know, the choice of the tn values is based on some pa-rameters that cannot be controlled by users, so the only thing we may conclude after some acquisitions is that condition tn+1−tn =tn−tn−1 cannot be hold. Therefore, this stage aims to resample the signal such that the aforementioned condition could be satisfied all over the registry. To this end, a L’Hˆermite piece-wise interpolation [5] is carried out using the minimum value of tn−tn−1 (for each signal) as the sampling period.
Statistical Detrending.– The nature of the acquisition system makes these signals prone to artifacts that may alter both the baseline and the amplitude. These artifacts, however, can be easily overcome by removing the mean and the variance trends as follows: the instant mean and variance estimated through a 20–second–long sliding win-dow4. One might think that the underlying information of the PPG is distorted by altering the mean and, specially, the standard deviation, however, that infor-mation is coded mainly on the pulse–rate as well as on the shape of the pulse, which are not altered when the above mentioned statistics are modified.
Pulse Delineation.– By means of the pulse delineation, the signaly(t) is split into a set ofK pulses:{B(k;τ)}K
k=1. For such purpose, literature brings quite a few methods ([6], for instance), however, if signals are only moderately corrupted, simpler methods based on low-pass filtering and valley (local minimum) detection can be used instead. Using that methodology, we have achieved a 99% of correctly delineated pulses.
2.2 Shape Modeling
To improve the quality of the shape of pulses, we have used the shape–model proposed in [4] in which each pulse is modeled through a parametric curve formed by two gaussian curves and a linear trend:
B(τ;k)'
4 Theχ2goodness of fit test has been used to assess the distribution of data. The choice
IV
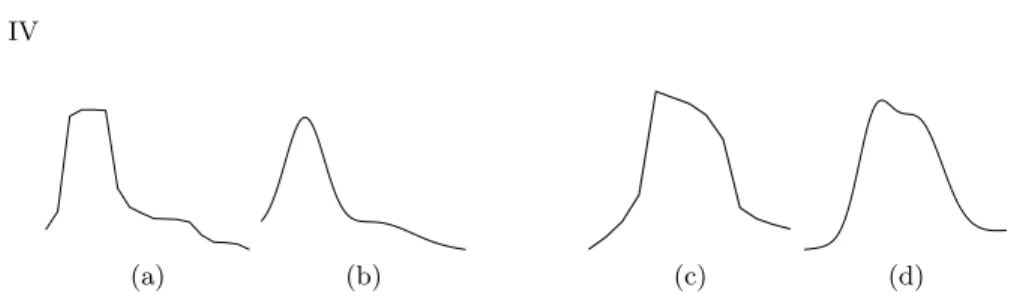
(a) (b) (c) (d)
Fig. 1.Shape of two pulses before —(a) and (c)— and after —(b) and (d)—the shape
modeling stage.
wherea1, b1, c1, a2, b2, c2, m0andm1are the parameters characterizing the model, whose values have been estimated by means of the non–linear least squares min-imization method. For the shake of simplicity, these parameters are compiled in a vector series summarizing all the information provided by the PPG registry:
w[k] = [a1[k], b1[k], c1[k], a2[k], b2[k], c2[k], m0[k], m1[k]], k= 1,· · ·, K. (3)
Once the parameters are estimated, each beat is substituted by the parametric curve Γ(τ,w[k]). In Fig. 1, it is depicted the shape of two pulses before — B(τ;k)— and after —Γ(τ,w[k])— the modeling stage; one can observe that shape of modeled pulses looks more natural and less artifacted.
2.3 Shape Recovery
To the best of our knowledge, so far proposed methods aimed at recovering the pulse shape have shifted the issue of identifying abnormal pulses from the methodology to the user (“visual inspection”), however this work is posed as full automatic and, therefore, that step is performed without the user intervention. To this end, we propose the following procedure:
Substage 1: In this substage, we propose using the likelihood of each pulse respect to the surrounding ones in order to determine how intense should be the recovery process. So, the m = 20 surrounding pulses5 have been synchronized (see [4] for more details on the synchronization process) and overlapped to es-timate a probability density function from them: being{Γ(τ,w[`])}`∈M the set of 20 pulses, the probability density function is constructed as
fΓ(γ;τ)∼ N(ηΓ(τ), σΓ(τ)), (4)
whereηΓ(τ) andσΓ(τ) are the sample estimations of the mean and the standard deviation of the amplitude for each time instant τ using the {Γ(τ,w[`])}`∈M dataset. Therefore, anαk parameter defined as
αk= 1− 2
πarctan (L(Γ(τ,w[k]), fΓ(γ;τ))) (5)
5
V
is used to determine the intensity of the shape–recovery process. It must be noted that the arctan(·) function is included to limit the dynamic range of the parameter; specifically, 0≤αk ≤1.
Substage 2: Once the αk parameter is obtained, we propose the usage of a level set approach to modify the shape of pulses using the surrounding beats as a template. For that purpose, we have defined the level–set surface as (for the shake of clarity, from now on we will assume that we are working with a specific pulse, so we will omit the dependence on k):
φ(x, y) =
As for the template, we have defined it as
T(x, y) = 1−FΓ(x;y), x=τ, y=γ, (8)
where FΓ(γ;τ) is the cumulative density function associated to fΓ(γ;τ). So, the evolution of the pulse shape, actually the evolution of the surfaceφ(x, y), is governed by the iterative equation
φ(x, y)(n)−φ(x, y)(n−1)=F0· |∇φ(x, y)|+β· ∇·
The choice of F0 and β has not been addressed in this work, so, after trying several values, we have set themad hoc for each registry. That equation should be applied to updateφ(x, y) until the convergence criterion is achieved, i.e., when the amount of points satisfyingφ(x, y)(n)·φ(x, y)(n−1)<0 is less than the 1% of the points. Both the initial level–set,φ(x, y)(0), and the template estimated for a pair of pulses are depicted in Fig. 2.
3
Experiments and Results
The evaluation we have carried out in this work is not comprehensive enough due to the preliminary nature of it. So, this issue must be addressed in future works. In this work, we have assessed our proposal by reconstructing an unique signal lasted 5 minutes acquired to a healthy subject with a Motorola MotoG Smartphone.
VI
Fig. 3.Evolution of the shape of an abnormally–shaped pulse. White shadow represents
the template, whereas blue and red lines represent the initial and the current shape of the pulse.
VII
Original Pulse Recovered Pulse
Fig. 4. Shape of pulses before (blue colored line) and after (red line) applying the
proposed methodology for shape–recovery. Black lines represent the mean, the mean
± the standard deviation and the mean ± two times the standard deviation of the distribution of pulses created with the method proposed in [4].
proposal, we have compared it respect to the method proposed in [4]. Thanks to the stochastic nature of that method, we can generate several synthetic pulses that are statistically equivalent to the one to be replaced. Therefore, we have synthesize 100 pulses to analyze if the solution provided by the current proposal may be also considered statistically equivalent. In Fig. 4, we have plotted the statistics of the pulses synthesized through the method of [4] together with the solution provided by the current proposal. There, it can be seen that the solution provided the method here proposed “falls” within the bell of the distribution given by the synthetic pulses and looks natural. Hence, we can assert that our method is able to provide solutions as good as those provided by [4] but in a full-automatic manner, i.e., without the involvement of the user.
4
Conclusion
compre-VIII
hensive validation. Anyway, having in mind the experiments carried out, we can conclude that our proposal is a promising methodology aimed at significantly improving the quality of the PPG signals acquired with common smartphones, which may be very useful for the ubiquitous patient monitoring. The experi-ments carried out show that the shape of all pulses is improved in a large extent, and that the shape of highly corrupted pulses can be recovered. The point of the contribution lies, mainly, on three issues:
1. The method here proposed is full automatic, so all the procedure can be done without the user intervention. This feature make this method better than the so far proposed ones, which requires the manually identification of the beats to be processed.
2. The current contribution merges the information resulting from the cor-rupted beat and from the surrounding beats. It must be noted that, as far as we know, methods reported in literature obviate the information of the corrupted beat.
3. The proposed methodology can be performed in real time, since the solution for thek–th pulse only requieres from the 20 surrounding beats.
Apart from the mild validation, there are several aspects to be improved related to the choice of some parameters. These aspects will be addressed in future works through more and more comprehensive experiments
References
1. World Health Statistics. World Health Organization, Geneva, Switzerland (2011). 2. Murthy, V.S., Ramamoorthy, S., Srinivasan, N., Rajagopal, S., and Mukunda Rao,
M. Analysis of Photoplethysmographic Signals of Cardiovascular Patients. Proc. 23rd Annu. Int. Conf. Eng. Med. Biol. Soc., 2204–2207 (2001)
3. Sornmo, L. and Laguna, P. Bioelectrical Signal Processing in Cardiac and Neuro-logical Applications. Elsevier Academic Press, M.A., U.S.A. (2005)
4. Mart´ın-Mart´ınez, D. Casaseca–de–la–Higuera, P., Mart´ın-Fern´andez, M., and Alberola–L´opez, C. Stochastic modeling of the PPG signal: a synthesis-by-analysis approach with applications. Trans. on Biomed. Eng. 60, 2432–2441 (2013)
5. Birkhoff, G., Schulz, M.H., Varga, R.S. Piecewise Hermite Interpolation in one and two variables with applications to partial differential equations. Numer. Math., 11, 232–256 (1968).