Political Inputs to the Aid Allocation Process:
Evidence from Spain
Jennifer Kuan1, Natalia Mart´ın-Cruz2
1
Stanford Institute for Economic Policy Research (SIEPR), Stanford University, USA
2
Departamento de Organizaci´on de Empresas y C. I. M., Universidad de Valladolid,
Spain
Abstract Rich countries spend about $100 billion a year on poor countries.
But details about how this money is spent-and why-is usually unavailable. Even
the aggregate figures reported to the public are often of pledges of aid rather
than actual amounts spent. Using a detailed data set from Spain, 1999-2003, we
explore how at least one rich country has chosen to spend its foreign aid budget,
including a closer look at actual projects funded. Moreover, we will attempt to
examine the political forces that shaped the allocation of that aid. In particular,
we divide political factors into three groups: domestic, regional, and strategic,
and find that all three play a role in how much money a poor country receives
from donors.
Keywords Aid Allocation, International Aid, International Cooperation,
Out-sourcing.
JEL ClassificationO12.
1. Introduction
Together, rich countries spent over $400 billion on poor countries in the period
1999-2003. But details about how this money is spent—and why—is usually
unavailable. Even the aggregate figures reported to the public are often of pledges
of aid rather than actual amounts spent. Using a detailed data set from Spain,
1999-2003, we explore how at least one developed country has chosen to spend
its foreign aid budget, including a closer look at some of the more than 17,000
projects funded by this money. Briefly, a majority of aid went to middle income
countries rather than low-income countries.
By focusing on the allocation of aid—who got how much—we deliberately
avoid the important question of whether foreign aid is effective. Also, we restrict
our attention to foreign aid spending by governments, even though individuals in
rich countries contribute considerable amounts to international charities. Thus
our examination of foreign aid is actually the study of a political process, in which
the data give us an opportunity to gauge the importance of various political
influences.
What political concerns drive the allocation of foreign aid? We consider three
categories: domestic, regional, and strategic. Domestic political concerns are those
that affect legislators, typically such issues as employment, taxes, infrastructure.
Regional issues, in general, would have to do with neighboring countries. But in
Spain’s case, as a member of the European Union (EU), EU policies most likely
dominate regional concerns; policies such as expanding EU membership to include
several poorer countries. Finally, strategic concerns have to do with a country’s
security and relative power in the world, and as such, are rarely articulated fully
and honestly. Stated objectives include the containment of communism during
the Cold War and the halting of terrorism today. The empirical problem is that
strategic action is may be driven by unstated objectives as well.
How do these political objectives affect aid outcomes? We use proxies for each
strategic politics increases the amount of aid a country receives. Specifically, we
use Parliament’s list of high-priority aid countries to proxy for domestic political
priorities, and the EU’s list of candidate countries to proxy for regional
politi-cal changes. We measure a poor country’s strategic importance by the amount
of Spanish aid it receives through non-governmental organizations (NGOs), i.e.
the percentage of aid that Spain outsources. This transaction cost reasoning to
suppose that the more important a country, the less Spain would outsource its
aid.
We find that all three types of political concerns—domestic, regional, and
strategic—affect the allocation of aid and help explain the descriptive statistics.
2. Literature
The literature on foreign aid allocation has mostly concerned itself with the
intentions of donor countries. Do rich countries give to poor countries primarily
to benefit the recipient country or to benefit themselves? The empirical challenge
in answering this question is that foreign aid efforts are likely to benefit both
donor and recipient. The first U.S. aid initiative, the Marshall Plan, is a prime
example of the dual nature of foreign aid.
Nevertheless, the debate in the literature can be characterized as “donor
need” versus “recipient need”. Empirical studies of 1960s US bilateral aid
(Dav-enport, 1970; McKinley and Little, 1977, 1979) argue on the side of donor-need.
This is perhaps not surprising, given the economic strategy of the Cold War to
strengthen non-communist countries and isolate communist countries. But Gang
and Lehman (1990) also find evidence for the donor-need hypothesis in the 1970s,
examining donation patterns in Latin America before and after a 1973
Congres-sional resolution to direct aid to the poorest countries.
Maizels and Nissanke (1984) carry the debate into the 1980s, studying two
periods 1969-1970 and 1978-1980. They find that multilateral aid is driven more
over time (the 1980s are more donor-need driven than the 1970s) and by donor
country (e.g. the US is more donor-need driven than Germany). Trumbull and
Wall (1994) also examine data from the 1980s and find in favor of recipient-need
as expressed by infant mortality and political-civil rights. Finally, Burnside and
Dollar (2000) examine aid allocation in the 1990s, distinguishing for the first time
grants from loans and find support for a donor-need orientation.
While exploring the donor need/recipient need question, other patterns emerge
from these studies. First, better-off countries receive a disproportionate amount
of aid, a “middle-income bias”. Second, studies of 1970s aid observe an
addi-tional “small country bias”, in which smaller countries get more per capita aid
than larger countries (Dudley and Montmarquette, 1976; Dowling and Hiemenz,
1985; also, Burnside and Dollar, 2000).
The allocation question has evolved over the years from a simple donor- or
recipient-benefit one to a more refined view that different circumstances produce
more or less donor-oriented aid allocations. But this framing of the aid question
has some important problems. For instance, classifying benefits can be difficult.
Did the Marshall Plan benefit the US or Germany? Classifying independent
vari-ables has also been tricky. Is recipient population an indication of political power
and thus a measure of potential donor benefit, or is recipient population an
in-dication of a country’s need?
Instead, we start by recognizing that aid allocation is the result of a political
process, and then use project level data to examine sources of political influence
on allocation decisions. Previous studies looked at aid totals. We use a unique
data set of all aid projects funded by grants by a single donor country. This
project data can tell us how money was spent and, from outsourcing data, how
3. The Political Process for Allocating Aid (Spain)
Our data are compiled by the Spanish government and include all grant funding
for foreign development projects. Since funding processes may vary by donor
country, we provide a brief description of the process and institutions used in
Spain.
Each year, an interministerial commission is convened to propose a budget
for all Spanish foreign aid, including multilateral aid (aid to multilateral
orga-nizations like the EU or United Nations) and bilateral aid (aid directly to poor
countries).
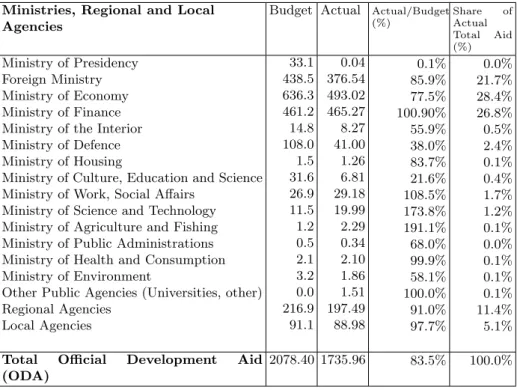
The resulting “Annual Plan” provides a rough breakdown of spending by
country and sector and includes aid contributions from a variety of government
ministries. Table 1 shows the contribution to bilateral aid by various ministries
for 2003. Our data examines a subset of Foreign Ministry spending.
The Interministerial Commission for Development Cooperation, which
assem-bles the budget proposal, is made up of representatives from the various ministries
that contribute aid, and is chaired by the Secretary of State for International
Co-operation (SSIC), appointed by the Prime Minister. As a political appointee, this
secretary uses his position’s considerable discretion to direct the allocation of aid
according to the priorities of the Prime Minister.
The commission submits its proposed budget to the Prime Minister who
ap-proves it and submits it to Parliament for approval and oversight.
Parliament itself publishes a list of high priority recipient countries every four
years. A standing all-party committee generates this list, and provides approval
and oversight of the foreign aid budget. This process takes place independently
of the budgeting process of the executive branch just described.
The part of the overall foreign aid budget that we are interested in is bilateral
grant aid. Once the budget is approved, the SSIC begins the more detailed work
of selecting the projects that will be managed “in-house” and allocating specific
to the Agency for International Cooperation (AECI), which manages in-house
Table 1: Foreign Aid: Budget and Actual, Spain, 2003 (e).
Ministries, Regional and Local Agencies Ministry of the Interior Ministry of Defence Ministry of Housing
Ministry of Culture, Education and Science Ministry of Work, Social Affairs
Ministry of Science and Technology Ministry of Agriculture and Fishing Ministry of Public Administrations Ministry of Health and Consumption Ministry of Environment
Other Public Agencies (Universities, other) Regional Agencies Total Official Development Aid
(ODA)
2078.40 1735.96 83.5% 100.0%
projects and the outsourcing process. Figure 1 is an organization chart showing
the relevant portions of the executive branch of government.
Given the organization and process of allocating aid, we expect the priorities
of the executive to be expressed, since the Prime Minister’s appointee chairs the
allocation process.
These priorities will include primarily strategic objectives but will likely take
into account regional concerns. Finally, any such Annual Plan will be constrained
by legislative priorities, since Parliament approves and overseas the foreign aid
*Bold-faced boxes indicate agencies whose foreign aid spending is captured in our data.
Figure 1: Executive Branch Participation in Foreign Aid (Spain).
4. Data and Descriptive Statistics
We use data on Spanish aid grants for the five-year period, 1999-2003. Note that
this excludes multi-lateral aid, i.e. aid to multi-lateral organizations like the EU
and UN. Also, we exclude loan aid, and subsequently, debt forgiveness. During the
period studied, a total ofe3.66 billion were distributed to 165 different countries
via 15547 projects. Table 2 lists some descriptive statistics.
While these numbers might suggest the casting of a wide net, with lots of
projects in lots of countries, a closer examination provides an entirely different
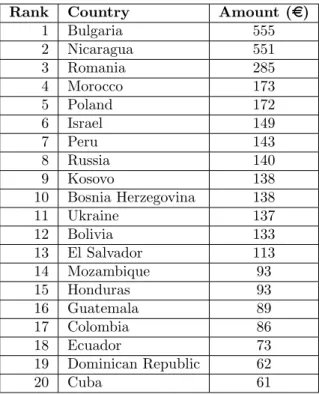
picture. Of the total spending on foreign aid, 75% went to just 20 countries (Table
3).
As mentioned earlier, Parliament puts together a list of priority countries
every four years. Many of the countries on the list have colonial ties to Spain,
co-Table 2: Foreign Aid Statistics (Spain, 1999-2003).
Total Aid Distributed e3.66 billion
Number of Projects 15,547
Countries served 165
% of Aid going to Top 20 Recipients 75% Number of Projects Outsourced 8,035 (51.7%) Value of Outsourced Projects e1.05 billion (29%) Number of NGOs with top-level responsibility 762
Projects Going to Top 20 NGOs 2297 (28.5%)
Table 3: Top 20 Aid Recipients (1999-2003).
Rank Country Amount (e)
1 Bulgaria 555
2 Nicaragua 551
3 Romania 285
4 Morocco 173
5 Poland 172
6 Israel 149
7 Peru 143
8 Russia 140
9 Kosovo 138
10 Bosnia Herzegovina 138
11 Ukraine 137
12 Bolivia 133
13 El Salvador 113
14 Mozambique 93
15 Honduras 93
16 Guatemala 89
17 Colombia 86
18 Ecuador 73
19 Dominican Republic 62
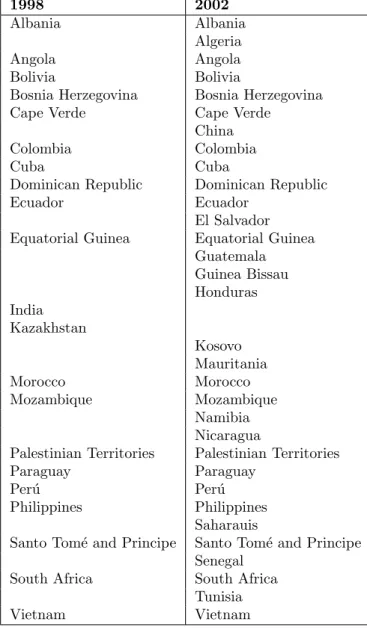
untries, which affect Spain directly through immigration, also make the list of
domestic priorities. Table 4 shows the priority lists for 1998 and 2002.
Table 4: High Priority Countries for Receiving Foreign Aid (Spain).
1998 2002
Albania Albania
Algeria
Angola Angola
Bolivia Bolivia
Bosnia Herzegovina Bosnia Herzegovina
Cape Verde Cape Verde
China
Colombia Colombia
Cuba Cuba
Dominican Republic Dominican Republic
Ecuador Ecuador
El Salvador Equatorial Guinea Equatorial Guinea
Guatemala
Palestinian Territories Palestinian Territories
Paraguay Paraguay
Per´u Per´u
Philippines Philippines Saharauis
Santo Tom´e and Principe Santo Tom´e and Principe Senegal
South Africa South Africa Tunisia
Casual inspection suggests that many of the top 20 recipients are not on
Parliament’s priority list for either 1998 or 2002. Figure 2 is a Venn diagram of
countries in the top 20 list of recipients and countries on the Parliament’s list of
high priority recipients (see Appendix 1).
Figure 2: Ex ante Priorities for Foreign Aid and Actual Outcomes (Spain, 1999-2003).
This apparent mismatch between legislative priorities and actual allocations
might make one skeptical of the effectiveness of legislative input, but a statistical
a country’s aid allocation. Parliament does, after all, have approval authority over
any aid budget.
Before turning to the statistical analysis of data, we first take a brief look
at outsourcing. Of the 15,547 aid projects funded by the Spanish government,
8,035 were completely outsourced to 762 different NGOs. Again, we get a picture
of widespread participation by outside experts and service providers. Indeed,
there was some outsourcing in every country-project category for which there was
activity (see Appendix 3 for a list of categories). This extensive use of outsourcing
is perhaps not so surprising, given the proliferation of NGOs with local expertise.
Also, the concentration of outsourcing—the top 20 NGOs managed almost 30% of
outsourced projects—seemed reasonable given the existence of large, well-known
NGOs like the Red Cross. More surprising was the large amount aid money
controlled by Spanish administrators:e2.61 billion (71%) of funded projects were
not outsourced (Table 2).
5. Analysis
Why do some countries get more aid than others? We posit that the allocation of
aid is a political process and that therefore, political priorities affect the amount
of aid poor countries receive. Those that are a political priority get more than
those that are not, ceteris paribus. With the amount of aid a country receives
as our dependent variable, we look at political inputs (domestic, regional, and
strategic priorities) and control for obvious attributes such as population (the
literature finds a “small country bias”), poverty (there may be a “middle income
bias”) and governance (stated policies, such as the US Millennium Challenge
Grant, seek to reward good governance).
5.1. Explanatory Variables: Politics
Domestic politics: Descriptive statistics suggested that being designated a
the other hand, many of the countries on the priority list are small. We wish to
test whether, after controlling for size and other factors, being on the List results
in more aid.
Regional politics: Descriptive statistics also suggested that EU candidacy was
an important factor in receiving aid. One reason EU candidates did not appear
regularly on the Parliament’s list might be that EU issues probably impact the
executive more than the legislative, which is more concerned with its domestic
constituency.
Strategic politics: Because strategic priorities are often unspoken publicly, we
do not have a simple list of countries that the executive considers strategically
important. We nevertheless hypothesize that projects in strategic countries are
less likely to be outsourced than projects in strategically unimportant countries,
so that outsourcing might be used to identify strategic importance. This
hypoth-esis arises from a general transaction cost approach but also a specific discussion
by Williamson (1999) regarding foreign affairs.
Of course, other factors may enter into the outsourcing decision. For instance,
a literature on foreign direct investment (FDI) (e.g. Henisz, 2000, Oxley, 1999)
argues that corruption or governance in a country affects the types of projects
that can be outsourced to a country. To test whether the Spanish government is
constrained in its outsourcing decisions by governance, we estimate the following
logistic equation:
OUTi=α+β1·Heniszi+β2·ln (life exp)i+β3·ln (pop) +β4 ln (size project)+
β5 (number ngo by year by country) +β5dummies yeari +
β6dummies crs sectori+εit
We find that our governance variable, Henisz, is not significant. (The Henisz
Table 5: Test for the Effect of Target Country Governance on Foreign Aid Out-sourcing.
Henisz 0.05
# NGOs outsourced to in target country that year
0.03***
Ln(pop) 0.07***
Ln(project size) 0.19*** Ln (life expectancy) -2.68***
1999 20.7
Dependent Variable: Outsource Project (y= 1) *denotesp <0.05, **p <0.01, ***p <0.001
litera-ture deals with firms—rather than governments—that outsource to for-profit
firms rather than nonprofit NGOs. As nonprofits, NGOs differ in their incentives
(Kuan, 2001; Gertler and Kuan, 2004), perhaps notably in their incentive to
behave opportunistically. Thus Williamson’s (1999) prediction that foreign affairs
activities, including diplomacy and espionage, cannot be outsourced because they
require too high a level of probity and integrity for a profit maximizing firm is
clearly contradicted by the extensive outsourcing done by foreign aid offices.
Finally, we recognize that hostile conditions might prevent NGOs from
op-erating in certain countries. For instance, NGOs have left Iraq because war has
made it too dangerous for NGOs to operate. Also, recently the Russian
govern-ment has imposed severe filing requiregovern-ments in an effort to drive out international
NGOs. It is true that we cannot distinguish a strategic importance from hostility
to NGOs, but we argue that this would bias against our results.
5.2. Control Variables
Population size: The literature suggest that smaller countries receive
dispro-portionate amounts of aid, possibly because donors wish to have a larger impact
and so concentrate their resources where the per capita impact will be the
great-est. Figure 3 is a log-log plot of population and aid.
Poverty: Because health is found by earlier studies to be an important factor
in aid effectiveness, we include the life expectancy measure published by the
World Health Organization (WHO).
Governance: We use a relatively new measure of governance, the Henisz index
(Henisz, 2000), which incorporates the political constraints on a country’s
exec-utive. There are, of course, other measures of governance, but we use the Henisz
index because it parsimoniously captures civic and judicial engagement as well
Figure 3: Aid to Population of Recipient Countries (Spain, 1999-2003).
6. Models
To analyze the data, we aggregate aid received by each country over the 5 year
period. Other regressions disaggregating by year show years not to be jointly
significant. We use variations of the following log model:
ln (aid) = const +β1ln (population) +β2ln(life exp) +β3Henisz +
β4List +β4EU +β5 ln(aid outsourced) + e
Model 1: Domestic Politics—Parliament’s Priority List
In our first model, we ask whether the priority list matters. After all, given
the relatively large amounts of aid going to non-list middle-income countries, we
wonder whether the list has any effect at all. Controlling for the size of the
re-ceiving country (population), poverty (life expectancy) and governance (Henisz)
Our results with regard to the control variables are consistent with other
studies that found that smaller countries get disproportionately more aid, and
that governance is not significant. Life expectancy was not found to be significant.
Model 2: Regional Politics—EU Candidates
We observed in the descriptive data that several EU candidates received a lot
of aid even though they were not a priority for the legislature. Indeed we find
that the EU candidate flag is significant in getting recipients more aid. Here,
too, population is significant and consistent with a small country bias, while life
expectancy and the Henisz index are not significant.
Model 3: Strategic Politics—Outsourcing as Revealed Preference
Lastly, we ask whether a country’s priorities can be observed by its
outsourc-ing behavior. That is, just as firms do the most strategically important tasks
in-house, so governments would do in-house those projects that affect relations
with the most strategically important countries. We therefore look at the amount
of money that NGOs manage in each country and find that, as expected, more
aid goes to countries with less outsourcing.
Results are shown in Table 6.
7. Discussion and Conclusions
The process that brings rich country resources to bear on poor country problems
is long and involved. From the first political decision to solve a problem, whether
to help the poor country or to help itself, many things can divert money from
its intended target. In poor countries, bad governance, weak institutions, and
a lack of leadership (Shirley, 2004) can all derail aid efforts. In rich countries,
Table 6: Allocation of aid.
Dependent var:
ln (aid received) Model 1Domestic Politics Model 2+Regional Politics Model 3+Strategic Politics ln (population) 0.63*** Priority list (y=1) 2.74***
(0.42)
3.01*** (0.42)
1.65*** (0.37)
EU candidate (y=1) 1.62**
(0.62)
and money. But all of these problems assume that aid has been allocated, that
political will has been followed through with funded projects. This study looks at
the crucial step in the process, in which aid allocations respond to rich countries’
stated and unstated goals.
Having detailed data for just one country, Spain, we might be cautious about
extending our findings to other countries. Surely other countries have different
political processes for prioritizing aid requests and bureaucratic processes for
allocating aid. That said, we look at aggregated data from the OECD for all
rich-country giving and find rather similar patterns, especially in terms of large
amounts of aid going to middle-income countries. The Development Assistance
Committee (DAC) has 23 member countries (Appendix 2) that together gave
money went to poor countries and 24% went to middle-income countries, as
compared with 21% and 29%, respectively, of Spain’s aid.
In our study, we depart from the donor- versus recipient-need dichotomy in the
literature to look instead at sources of political influence: domestic, regional and
strategic. Not only does this taxonomy find statistical significance in our data, it
also provides some explanations for observed patterns. First, the middle-income
bias that appears in so many other studies has a ready explanation as a regional
political matter. Also, the efforts of celebrities on behalf of poor countries make
sense in the context of influencing public opinion and thus domestic political
priorities for aid. Finally, our interpretation of outsourcing allows us to observe
unstated, strategic priorities. While we do not address the many normative issues
associated with foreign aid, especially how we should allocate aid, we believe
that the responsiveness to political priorities makes aid allocation, in principal,
responsive to the people of donor countries.
Finally, the main limitations of our paper could be extensions for further work.
First, the period of analysis could be extended; second, we can include more donor
countries in the analysis, and third, we could include other explanatory variables
to test the robustness of our results.
References
1. Burnside, C. and D. Dollar, (2000): Aid, Policies, and Growth.AER, 90, 847-868. 2. Davenport, M., (1970): The Allocation of Foreign Aid: A Cross Section Study,
with Special Reference to the Pearson Commission Report.Yorkshire Bulletin of Economic and Social Research, 22, 26-42.
3. Dowling, J. M. and U. Hiemenz, (1985): Biases in the Allocation of Foreign Aid: Some New Evidence.World Development, 13, 535-541.
4. Dudley L. and C. Montmarquette, (1976): A model of the supply of bilateral foreign aid.AER, 66, 132-142.
6. Gang, I. N. and J. A. Lehman, (1990): New Directions or Not: USAID in Latin America.World Development, 18, 723-732.
7. Gertler, P. and J. Kuan, (2004): Are Nonprofits Efficient? A Test Using Hospital Market Values. Working Paper.
8. Gertler, P. and J. Kuan, (2009): Does It Matter Who Your Buyer Is? The Role of Nonprofit Mission in the Market for Corporate Control of Hospitals.The Journal of Law and Economics, 52, 295-306.
9. Henisz, W. J., (2000): The Institutional Environment for Multinational Investment.
Journal of Law, Economics, and Organization, 16, 334-364 10. Jepma, C. J., (1991): The tying of aid. OECD.
11. Maizels, A. and M. K. Nissanke, (1984): Motivations for Aid to Developing Coun-tries.World Development, 12, 879-900.
12. McKinley, R. D. and R. Little, (1977): A Foreign Policy Model of US Bilateral Aid Allocation.World Politics, 30, 58-86.
13. McKinley, R. D. and R. Little, (2006): The US Aid Relationship: A Test of the Recipient Need and the Donor Interest Models.Political Studies, 27, 236-250. 14. Mosley, P., J. and S. Horrell, (1987): Aid, the Public Sector and the Market in Less
Developed Countries.Economic Journal, 97, 616-641.
15. Oxley, J. E., (1999): Institutional Environment and the Mechanisms of Governance: The Impact of Intellectual Property Protection on the Structure of Inter-Firm Al-liances.Journal of Economic Behavior and Organization, 38, 283-310.
16. Shirley, M., (2005): Institutions and Development, Handbook of New Institutional Economics, M´enard, Claude; Shirley, Mary M. (Eds.), Springer.
17. Trumbull, W. N. and H. J. Wall, (1994): Estimating Aid-Allocation Criteria with Panel Data.Economic Journal, 104, 876-882.
APPENDIX 1:Top 50 Allocations of Development Aid, Spain, 1999-2003.
Country Project Amount
Nicaragua* Debt forgiveness 417
Bulgaria Debt forgiveness 282
Romania Spanish language and culture teaching and pro-motion
118
Poland Spanish language and culture teaching and pro-motion
118
Israel Promotion of Spanish culture abroad 96
Ukraine Contribution to International Atomic Energy Agency
63
Bulgaria Restoring of a Spanish bilingual center & self-employment creation
50
Bulgaria Restoring of chirurgic, neurology, obstetrics and gynecology department
50**
Ukraine Medical material for the Kiev Hospital 38 Russia Individual grants to Central and Eastern Europe 34 Romania Technical assistance for small business in the
win-ery sector (Vrancea)
34
Russia Individual grants to Central and Eastern Europe 34
Senegal Debt forgiveness 34
Israel Computers convoy 34
Romania Technical assistance for small business in the win-ery sector (Vrancea)
34
Nicaragua* Debt forgiveness 33
(continuation)
Bulgaria Technical assistance to the Ministry of Public Health during the restoring of hospital manage-ment
30
Romania Assistance to the Agency for Infancy protection 22 Romania Dis-institutionalize the infancy protection 20 Morocco* Expenditures of educational centers 19
Mozambique* Debt forgiveness 18
Romania Bureaucratic costs of Spanish embassies 18 Romania Education for Universities. Lectorates 18 Romania Individual grants to Central and Eastern Europe 18 Morocco* Expenditures of teachers in educational centers 16 Russia Bureaucratic costs of Spanish embassies 15 Bulgaria Restoring and equipment for the bilingual Spanish
centre in Sofia
15
Korea Education at the university. Grants 14
Russia Courses to teachers in economy 14
Bulgaria Courses related to the viability of tourist sector 14 Slovakia Technical assistance to the development of policies
for gipsy minorities
14
Libya Individual grants to Arab countries 13
Bolivia* Debt forgiveness 12
Bulgaria Humanitarian project and technical help for cen-tres of “Casa de la Mother and Children” for chil-dren
12**
Morocco* Expenditures of teachers in educational centers 11 Serbia & Montenegro Debt forgiveness 11 Hungary Individual grants to Central and Eastern Europe 10
Russia Course related to taxes management 10
Bulgaria Rebuilding the facilities of psychiatric handicap and physic handicap in Krushari
(continuation)
Bosnia Herzegovina Spanish engineering to rebuild infrastructures 9 Afghanistan Rebuilding of international forces for security
as-sistance in Afghanistan
9
Russia Course related to changes in political states 9 Albania* Costs for installation of a camp in Hamalla 9 Poland Scientific cooperation between the Spanish CSIC
and researchers from Poland
9
Poland Individual grants to Central and Eastern Europe 9 Bulgaria Bureaucratic costs of Spanish embassies 9** Morocco* Expenditures of teachers in educational centers 8
APPENDIX 2: List of 23 DAC Members and Date of Membership. Source:
OECD.
– Australia, 1966.
– Austria, 1965
– Belgium, 1961
– Canada, 1961
– Denmark, 1963
– Finland, 1975
– France, 1961
– Germany, 1961
– Greece, 1999.
– Ireland, 1985.
– Italy, 1961.
– Japan, 1961.
– Luxembourg, 1992.
– Netherlands, 1961.
– New Zealand, 1973.
– Norway, 1962.
– Portugal, 1961, withdrew in 1974 and re-joined in 1991.
– Spain, 1991.
– Sweden, 1965.
– Switzerland, 1968.
– United Kingdom, 1961.
– United States, 1961.
APPENDIX 3:Purpose Codes.Source: DAC.
110 Education
120 Health
130 Population Policies/Programs and Reproductive Health
140 Water Supply and Sanitation
150 Government and Civil Society
160 Other Social Infrastructure and Services
210 Transport and Storage
220 Communications
230 Energy Generation and Supply
240 Banking and Financial Services
250 Business and Other Services
311 Agriculture
312 Forestry
313 Fishing
321 Industry
322 Mineral Resources and Mining
323 Construction
331 Trade Policy and Regulations
332 Tourism
400 Multisector/Cross-cutting
500 Commodity Aid and General Program Assistance
600 Action Relating to Debt
700 Emergency Assistance and Reconstruction
910 Administrative Costs of Donors
920 Support to Non-Governmental Organizations (NGOs)