Time Resolved Study of the Surface Enhanced Raman Scattering Effect of Silver Nanoparticles Generated in Voltammetry Experiments
33
0
0
Texto completo
(2) This is the Accepted Manuscript version of a Published Work appeared in: Published in Journal of Physical Chemistry C, 2014, Volume 118, Pages 23426–23433 (DOI: 10.1021/jp5074363). Time-resolved study of the Surface-Enhanced Raman Scattering effect of silver nanoparticles generated in voltammetry experiments. D. Ibañez, C. Fernandez-Blanco, A. Heras, A. Colina* Department of Chemistry, Universidad de Burgos, Pza. Misael Bañuelos s/n, E-09001 Burgos, Spain. * Corresponding author: [email protected], Tel: +34 947 258817, Fax: +34 947 258831 Abstract. UV/Vis absorption and Raman spectroelectrochemistry have been used to study silver nanoparticles (AgNPs) electrodeposition, allowing a better understanding about the metal nanoparticles (NPs) formation process and its influence on the surface-enhanced Raman scattering (SERS) effect. These techniques have provided in-situ information related to the synthesis of AgNPs by cyclic voltammetry. Using a marker, such as cyanide anion (CN-), Raman spectroscopy has allowed us to study all changes that take place on a platinum electrode surface. 2.
(3) during the AgNPs electrodeposition process. Raman spectra show different SERS behavior depending on the NPs generated. UV/Vis absorption spectroelectrochemistry yields information on the changes in AgNPs plasmon band during their electrodeposition while Raman signal is highly correlated with the kind of NPs generated. The methodology used in this work demonstrates that SERS effect depends strongly on nanoparticle size and shape.. Keywords: Silver nanoparticles; cyanide; spectroelectrochemistry; plasmon band; SERS.. 3.
(4) 1. Introduction Metal NPs have exceptional properties making them a special system in many fields.1 Particularly, AgNPs exhibit electrochemical,2 catalytic,3 antimicrobial4 and optical5 properties that make them especially interesting in electronic, catalysis and sensors fields.6–10 These properties, as in other kind of metal NPs, are related with their sizes and shapes. Therefore, it is very important to develop synthetic routes to control the shape and size of NPs. AgNPs can be synthesized. using. chemical,11. sol–gel,12. thermal,13. photogeneration,14. template15. or. electrochemical16 methods. Among these methods, we have used an electrochemical route that allows us to study the electrodeposition process correlating the Raman signal of a marker (CN-) with the plasmon band evolution of the NPs generated on the electrode surface. Usually, metal NPs are characterized by ex-situ high resolution microscopies, but in-situ characterization is more interesting because it provides direct information about the kind of NPs generated on the electrode at each moment. UV/Vis spectroelectrochemistry is one of the few techniques that allows performing in-situ analysis on the NPs that are being electrodeposited on the electrode. In the case of AgNPs, the shape and position of the plasmon band are indicative of the kind of NPs electrogenerated.17 On the other hand, SERS effect has been widely studied over decades and it depends on two main contributions: electromagnetic and chemical mechanism (also denoted as charge transference mechanism), being the electromagnetic contribution significantly larger in magnitude than chemical mechanism.18–20 Besides, some studies have analyzed several SERS factors such as nanoparticle’s properties (size, shape, ...)21–25 or the relation between laser excitation line and NPs plasmon band.26–30 In this work we have studied some of these factors using combined information provided by UV/Vis and Raman spectroelectrochemistry. We have. 4.
(5) observed that during AgNPs synthesis, SERS effect is related to NPs electromagnetic properties and therefore, it is associated with their plasmon band. Metal (Pt, Pd, Ag, Au, …) NPs are systems largely employed in SERS.31–33 In particular, Ag deposition is one of the oldest plating processes studied. There are many complexing agents that can be used to follow changes on the surface morphology during metal deposition. Between them, CN- is one of the most useful agents due to the high interaction with the AgNPs,34–36 and SERS effect allows us to observe the characteristic bands of the different Ag(CN)n(n-1)complexes. In this work, we have performed a time-resolved in-situ study of the SERS effect of AgNPs generated in a voltammetry experiment and we have correlated this information to data obtained using time-resolved UV/Vis spectroelectrochemistry to study the synthesis of these NPs under the same experimental conditions. Both methods allow us to understand the processes that occur on the electrode surface, finding that both set of data are highly correlated.. 2. Material and methods 2.1. Reagents Silver nitrate, AgNO3 (Aldrich), potassium cyanide, KCN (Panreac) and potassium nitrate, KNO3 (Merck) as supporting electrolyte, were used as received. All chemicals were analytical grade. Aqueous solutions were prepared using high-quality water (resistivity of 18.2 MΩ·cm) MilliQ gradient A10 system, Millipore).. 2.2. Instrumentation. 5.
(6) All electrochemical measurements were carried out at room temperature using a potentiostat/galvanostat. AUTOLAB. PGSTAT. 20. electrochemical. system.. UV/VIS. measurements were performed using a QE65000 Spectrometer (Ocean Optics) made up of a 1044×64 element diode array synchronized with the potentiostat. The light beam, supplied by a deuterium-halogen light source (Avalight-DH-S, Avantes) was both conducted to and collected from the spectroelectrochemical cell by a reflection probe (RP-200-7-UV/Vis, Ocean Optics). The reflection probe was a bifurcated bundle consisting of six 200-µm illumination fibers around one central read fiber. It was placed in a home-made cell, facing the surface of the Pt electrode at a distance of approximately 1.5 mm. In this way, a near-normal configuration was used. The incident beam was perpendicular to the electrode surface and the reflected light (which samples a spot of approximately 1mm2) was collected by the central read fiber of the reflection probe and conducted to the spectrometer. Raman spectra were obtained using a Confocal Raman Voyage (BWTEK). A 20× objective was used, with an excitation line at 532 nm and a power of 5 mW. Raman spectra were collected by a CCD array, with a spectral resolution of 3.8 cm−1. The spectrometer was connected to a computer that recorded continuously at set time intervals and for set integration time. Synchronization between potentiostat and Confocal Raman microscope was performed with a trigger, being necessary to perform several hardware and software changes in the Raman equipment to obtain a time-resolved Raman signal during the electrochemical experiments. A standard three-electrode cell was used in all experiments, consisting of a commercial Pt working electrode (CHI), a Pt wire as auxiliary electrode and a homemade Ag/AgCl/KCl (3 M) reference electrode.. 6.
(7) Before Ag electrodeposition, the platinum electrode was polished to a mirror finish using alumina slurries with different powder size down to 0.5 μm. Next, the electrode was thoroughly rinsed with ultrapure water and sonicated in ultrapure water in an ultrasonic bath for 30 min to remove any absorbed substances on the electrode surface.. 3. Results and Discussion AgNPs electrodeposition and their redissolution are studied by cyclic voltammetry, scanning the potential from 0.00 V to -1.00 V and back to 0.00 V at a scan rate of 0.05 V s-1 in a 4.8x10⁻³ M AgNO3 solution that contains 0.4 M KNO3 as supporting electrolyte and 2.8x10⁻² M KCN as complexing agent (pH = 9.9). Fig. 1 displays the cyclic voltammogram obtained for the AgNPs electrodeposition. During the cathodic scan, around -0.60 V, a very small reduction peak is observed that could be related to the silver underpotential deposition (inset Fig. 1). However, the highest reduction wave takes place at -0.80 V, when Ag+ in solution is reduced. In the anodic scan, the voltammogram shows a broad current peak around -0.50 V that seems to have the contribution of different peaks, indicating that oxidation of AgNPs takes place in different steps. Evolution of the Raman spectra was recorded during the cyclic voltammetry (Fig. 2). A strong vibrational band at 2110 cm-1 is observed (Fig. 2.a), being characteristic of the cyanide due to the C≡N frequency vibration, (C≡N).34–36 This band is potential dependent and its evolution has to be related to the different Ag-CN complexes formed and to the NPs generated on the electrode surface. Chemistry of silver cyanide shows the following equilibria:35 Ag+ + CN- ⇆ AgCN. Raman= 2164-2167 cm-1. Eq. 1. Ag+ + 2CN- ⇆ Ag(CN)2-. Raman= 2135-2145 cm-1. Eq. 2. Ag(CN)2- + CN- ⇆ Ag(CN)32-. Raman= 2105-2110 cm-1. Eq. 3. 7.
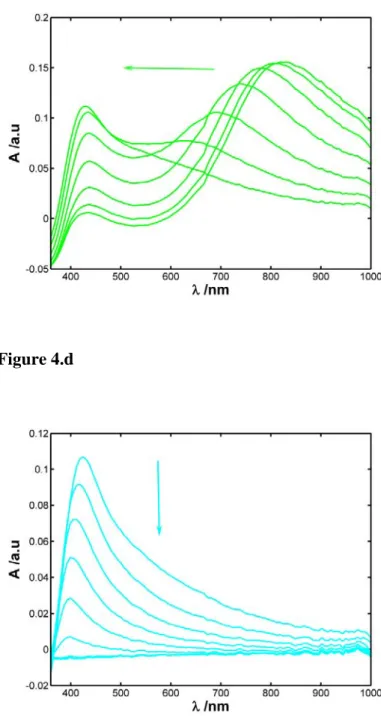
(8) Ag(CN)32- + CN- ⇆ Ag(CN)43-. Raman= 2090-2100 cm-1. Eq. 4. AgCN (Eq. 1) is a white precipitate that in presence of excess of cyanide is redissolved forming other complexes, being more stable Ag(CN)2- and Ag(CN)32- (Eq. 2 and 3) than Ag(CN)43- (Eq. 4). Dynamic Raman spectroelectrochemistry, in which a Raman spectrum is acquired each 1.6 seconds, provides in-situ time-resolved information on the characteristic Raman bands observed in a fast scan rate electrochemical experiment. Fig. 2.a shows the time evolution of the (C≡N) band recorded during the electrodeposition experiment. This band has the contribution of different bands that belong to the cyanide complex, besides a shifting of the cyanide band (Fig. 2.b) is observed due to the presence of different complexes during the experiment. UV/Vis spectroelectrochemistry with high time resolution, in which one complete visible spectrum is acquired each 8 miliseconds, allows us to study the in-situ electrodeposition of AgNPs analyzing the evolution of their characteristic plasmon band. It is a powerful analytical tool to characterize AgNPs37 and can help us to understand the Raman signal behavior. Fig. 3 shows the temporal evolution of the visible spectra recorded during the experiment where AgNPs are generated on the electrode surface. In this figure, it is possible to observe a band evolving with time (potential), which clearly changes its position during the potential scan. For a better understanding of the plasmon band evolution with potential, we have divided the voltammetry experiment in four segments (Fig. 4). From 0.00 V to -0.80 V (Fig. 4.a) it is possible to observe that a band centered on 440 nm begins to grow. A red-shift of the maximum of plasmon band is observed, which indicates that spherical NPs are growing, increasing their size. Normalization of spectra in Fig. 4.a respect to the maximum height yields spectra with. 8.
(9) different width indicating that also the density of NPs on the electrode surface increases. As can be seen, plasmon band width and height increases with potential, meaning that size and density of NPs are increasing. From -0.80 V to -0.60 V (Fig. 4.b) a new band appears, initially around 500 nm and then it moves fast to longer wavelengths, indicating a change in NPs shape. From the shape of the plasmon band, we can suppose that AgNPs changes from a spherical shape to other such as (nanoplates, nanoprisms,…).38,39 Fig. 4.b shows clearly two plasmon bands, one centered at 440 nm, related to the transversal dipole resonance and another that red-shifts with potential due to the longitudinal dipole resonance. From -0.60 V to -0.40 V (Fig. 4.c) we observe two bands like in the previous segment, but now, during the anodic scan the band centered at longer wavelengths is blue-shifted and it decreases to finally obtain only one band. Thus, during the oxidation, non-spherical NPs recover the spherical shape because at the end of this segment a unique band centered on 430 nm is observed. Finally, from -0.40 V to 0.00 V (Fig. 4.d) redissolution of the spherical AgNPs takes place and the band centered on 420 nm is blue-shifted because the size of AgNPs decreases and, at higher potentials, NPs disappear. Comparison between Fig. 4.a and Fig. 4.d is very representative about the information of the AgNPs plasmon band. In Fig. 4.a, plasmon band height decreases but plasmon band width does not change, indicating only a change of AgNPs size. However, as has been stated above, in Fig. 4.a, the lower the potential is, the wider the AgNPs plasmon band is, indicating not only a change in size but also in density of NPs that later leads to a change in shape at potentials lower than -0.80 V. Non-spherical NPs have the contribution of the longitudinal and transversal dipole resonance. Therefore, different plasmon bands are obtained for NPs with different shapes. Fig. 4 shows that. 9.
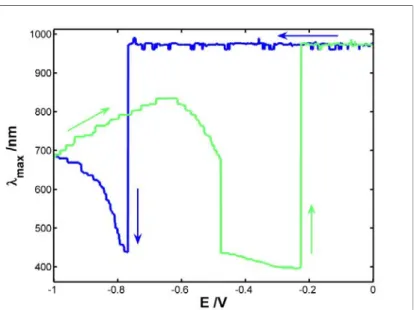
(10) changes observed in the plasmon band during the cyclic voltammetry experiment are due to the modification of AgNPs properties (size and shape).5,38,40 Fig. 5.a shows the evolution of the (C≡N) Raman band at 2110 cm-1 with the applied potential. No signal was observed from 0.00 V to -0.65 V because electrodeposition of AgNPs has not yet started, and therefore, there is not SERS effect. At -0.65 V CN- band evolves due to the beginning of Ag+ reduction, forming a SERS substrate that changes with potential. The intensity of this band increases, reaching a maximum at -0.94 V, almost at the end of the cathodic scan. During the anodic scan, between -0.94 V and -0.60 V the intensity increases again but from -0.60 V downwards the intensity of the band decreases abruptly recovering the initial value of intensity, equal to zero, indicating that AgNPs are fully oxidized and have been redissolved. Comparison of Raman intensity at 2110 cm-1 (Fig.5.a) and UV/Vis absorbance at 420 nm (Fig. 5.b) respect to potential shows that the two signals are correlated but their behaviors do not match exactly. Initially, neither Raman nor plasmon band appears in the respective spectra. The (C≡N) Raman band begins to grow at -0.65 V when Ag reduction starts, but UV/Vis band increases at more negative potential (around -0.75 V) than Raman band. Furthermore, the maximum in the spectra obtained with the two spectroscopy techniques are not observed at the same potential, (C≡N) Raman maximum is reached at -0.60 V in the backward scan, but if we follow the wavelength corresponding to the spherical NPs (420 nm), the maximum is observed at -0.40 V in this reverse scan. It is necessary to remember that the maximum of the plasmon band is changing during the experiment, so it is much more interesting studying the evolution of their maximum (Fig. 5.c) to observe that Raman and UV/Vis behaviors are completely correlated. Moreover, observation of the three signals (electrochemical, absorption and Raman) is necessary. 10.
(11) to understand the behavior of the chemical system. A very small reduction wave is observed in the voltammogram around -0.60 V during the forward (cathodic) scan, (inset Fig. 1) that could be related to the silver underpotential deposition, producing the deposition of very small NPs without plasmon band that yields a SERS effect enough to observe a very weak (C≡N) Raman band (forward scan, Fig. 5.a). Plasmon band centered on 420 nm grows abruptly later, at -0.80 V, but rapidly evolves with potential showing a red-shifting. The maximum of the plasmon band is shifted up to 835 nm (Fig. 5.c). Therefore, we can assume that a change in the shape of the NPs is taking place during the electrochemical deposition.17,41,42 Spherical NPs, with the typical plasmon band around 420 nm, are electrogenerated only in the first stages of the deposition during the forward scan, evolving quickly to other shapes. We cannot confirm the exact shape of the AgNPs because it is not possible to obtain a sample for SEM, as we will show below, but from the spectra waveform we can suppose that plate-like or rod-like nanostructures are formed on the electrode surface.17,38,39 The peak position of Ag nanostructures plasmon bands depends strongly on the nanostructure shape and size.17,42 As it was established in bibliography, a single symmetrical plasmon band centered approximately at 420 nm corresponds to spherical NPs, while in-plane or longitudinal dipole plasmon band with a peak in the Vis-NIR region are related to plate-like or rod-like Ag nanostructures.38 The plasmon band centered at 835 nm reaches it maximum value of absorbance at -0.60 V in the backward scan (Fig. 5.c) the same potential at which the maximum SERS effect it is observed (Fig. 5.a). This experimental evidence indicates that the highest SERS effect, maximum intensity of the (C≡N) Raman band at 2110 cm-1, is due to nanoplates or nanorods formed and not to spherical AgNPs. Therefore, UV/Vis spectroelectrochemistry is a very helpful technique. 11.
(12) to explain correctly Raman intensity changes during the cyclic voltammetry and SERS effect of AgNPs. Increasing more the potential in the backward scan, from -0.60 V to -0.30 V, spherical NPs are generated again during the redissolution of the nanoplate or nanorod particles. Just when the scan rate of redissoluton of these nanostructures is higher, around -0.45 V, deduced by the sudden decrease of Raman intensity at 2110 cm-1 (Fig. 5.a) a maximum of absorbance is observed when plotting its value at 420 nm (Fig. 5.c). Newly, this behavior indicates that the AgNPs that show higher SERS effect are those with shapes different from nanospheres. Finally, at the end of the anodic scan, the potential is high enough to completely oxidize AgNPs, redissolving all NPs on the electrode surface observed by the recovering of the initial value of absorbance in the UV/Vis spectra, and losing the corresponding SERS effect appreciated by the null value of Raman intensity in Fig. 5.a. With the aim of characterizing the NPs deposited on the electrode surface with typical microscopic techniques, experiments were stopped at the end of the reduction scan (-1.00 V), where a red-shift of the plasmon band to 700 nm has occurred (Fig. 5.c) and where there is a clear SERS effect (Fig. 5.a). However, electrodes modified in this way did not show SERS effect. In order to understand the reason because no SERS effect was observed on these electrodes, we carried out a spectroelectrochemistry experiment recording not only the electrodeposition process, but also the spectra after opening the electrical circuit. Potential was scanned from 0.00 V to -1.00 V at a scan rate of 0.05 V s-1 in a 4.8x10⁻³ M AgNO3 solution that contains 0.4 M of KNO3 as supporting electrolyte and 2.8x10⁻² M of KCN as complexing agent. Spectra were recorded during the whole experiment: electrodeposition process and after finishing it for 50. 12.
(13) seconds in addition, after leaving the electrode without applying potential. Fig. 6 shows the evolution of full UV/Vis spectra during this experiment. When plasmon band starts to grow, quickly a band centered on 700 nm is formed. But when the experiment is stopped the plasmon band has a spontaneously blue-shifting evolving to one centered on 420 nm.43 This behavior is related to the presence of cyanide, which redissolves the AgNPs, producing more stable AgNPs39,44,45 and depending on time, even it is possible to dissolve all NPs deposited on the electrode surface spherical and non-spherical. Therefore, when experiments are finished and we try to characterize the NPs using ex-situ techniques, nanostructures have changed spontaneously and the ex-situ techniques do not provide information corresponding to the NPs with the higher SERS effect. Excess of cyanide in presence of oxygen provokes the redissolution of AgNPs. Several hypotheses about the SERS effect have been proposed, some authors indicate that Raman signals were greatly enhanced when the laser excitation line matched the peak position of the plasmon band,46 other authors propose that small atomic silver clusters with high surface enhancement effect are probably formed during the nanoprism sculpturing process.47 Concordance between Raman and UV/Vis spectroelectrochemistry results allows us to obtain insitu information about the NPs that are being electrosynthetized in each moment and proves that the shape of the NPs has a clear effect on the SERS effect in the detection of cyanide. As has been shown above, spectroelectrochemistry provides suitable in-situ information about changes in shape and/or size of AgNPs during the electrodeposition process. AgNPs electrodeposition process depends strongly on the cyanide concentration. In this way, we have selected experimental conditions to generate only spherical AgNPs. In this case, electrosynthesis was performed using a lower concentration of cyanide. For this purpose, AgNPs electrodeposition and their redissolution were studied scanning the potential from +0.70 V to. 13.
(14) +0.15 V and back to +0.70 V at a scan rate of 0.01 V s-1 in a 4.8x10⁻³ M AgNO3 solution that contains 0.4 M KNO3 as supporting electrolyte and 2.8x10⁻⁵ M KCN. Fig. 7.a shows that the cyclic voltammogram obtained for AgNPs electrodeposition has a waveform similar to that registered during the electrodeposition with the higher KCN concentration, 2.8x10⁻² M (Fig. 1). As a result of the change in the cyanide concentration, the potential needed to form AgNPs is much more positive. The stripping peak at +0.50 V is more intense and without shoulders when compared with that of Fig. 1. Anyway, this voltammogram does not provide definitive information about the kind of NPs generated on the electrode. However, UV/Vis absorption signal provides clear information about the electrodeposition of spherical AgNPs. Fig. 7.b shows the typical plasmon band centered on 430 nm of spherical AgNPs which absorbance depends on the applied potential. It is remarkable, that during the beginning of the reduction process no plasmon band is observed, indicating that many nuclei and small nanoparticles are generated on the electrode surface (see spectra at +0.30 V in the forward scan, Fig. 7.b). On the other hand, only one plasmon band is observed during the electrodeposition process, indicating that NPs shape does not change when the cyanide concentration is 2.8x10⁻⁵ M. This case is completely different to the results showed above for AgNPs formed at higher cyanide concentration (Fig. 4). As can be seen, there is a small red-shift of the maximum of the plasmon band from 430 nm to 450 nm and also a clear increase of plasmon band height when the reduction overpotential is low enough. Normalization of spectra respect to the maximum absorbance yields spectra with approximately the same width, indicating that the density of the AgNPs does not increase significantly, once AgNPs with plasmon band are generated. Therefore, under these experimental conditions, we can assume that spherical AgNPs are growing in size during the electrodeposition process.. 14.
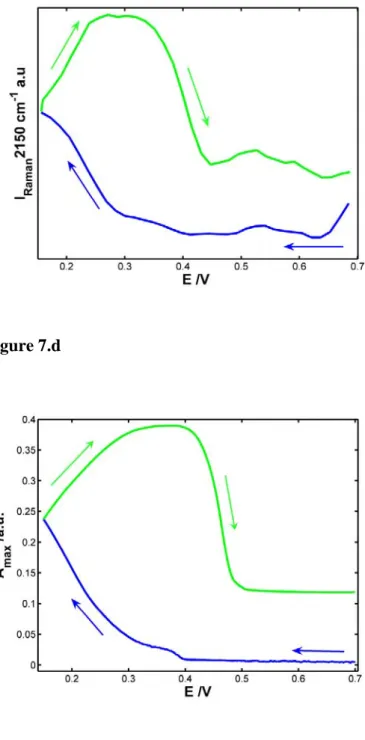
(15) As in the previous case at higher cyanide concentration, comparison of Raman intensity band at 2150 cm-1 (Fig.7.c) and absorbance at the maximum of the plasmon band (Fig. 7.d) respect to the potential shows that the two signals are correlated but their behaviors do not match exactly. Initially, neither Raman signal nor plasmon band is appreciated. Raman and UV/Vis bands begin to evolve when Ag(I) reduction starts, at potentials lower than +0.40 V. The two bands grow up concomitantly, indicating that SERS effect increases with the NPs size. However, the two signals do not reach the maximum signal value at the same potential. The highest Raman intensity is reached 100 mV earlier than the highest absorption band. Therefore, there is a preferential size of AgNPs for the SERS effect. Afterwards, Raman and absorption bands decrease but at different potential. Voltammogram shows that AgNPs begin to be slightly oxidized at +0.32 V (Fig. 7.a), approximately the same potential at which Raman intensity at 2150 cm-1 starts to decrease. Then, SERS effect is very sensitive to the surface composition of NPs and the oxidation of their surface provokes the decrease of the Raman signal. In this case, when redissolution of AgNPs takes places, Raman intensity and absorbance around the maximum decreases, but the initial values are not recovered as occurs at higher cyanide concentrations (Figs. 5a and 5b). Thus, at this low cyanide concentration and in this potential window AgNPs are not completely dissolved, as can be seen in the last spectra in Fig. 7.b, which evidences that some AgNPs are still deposited on the electrode at a potential as higher as +0.70 V.. 4. Conclusions Spectroelectrochemistry is a very suitable combination of two analytical methods to obtain insitu information about NPs electrochemically formed on an electrode surface. Combination of. 15.
(16) Raman and UV/Vis spectroelectrochemistry provides a more detailed picture not only about the electrodeposition process but also about the SERS effect produced by the nanostructures formed on the electrode surface. High concentrations of a complexing agent as cyanide provoke shape changes of AgNPs from spheres to other non-symmetrical shapes with a higher SERS effect. On the other hand, low concentrations of cyanide do not imply changes in the shape, but only in size, demonstrating the size dependence of the SERS effect. Therefore, the methodology used in this work using these two spectroelectrochemical techniques, have allowed us to support that SERS effect depends strongly on NPs size and shape. UV/Vis spectroelectrochemistry has allowed us to carry out an in-situ characterization of AgNPs with SERS effect, under some experimental conditions where AgNPs have a spontaneous evolution. A single plasmon band is not informative enough about the type of NPs generated on the electrode, but the controlled evolution of many plasmon bands indicates what is occurring to the NPs deposited on the electrode surface. Finally, spectroelectrochemical methodology has shown here that it can be a good candidate to control the NPs electrosynthesis in order to obtain the best SERS active substrates.. Acknowledgement The financial support made by the Junta de Castilla y León (GR71, BU349-U13) and Ministerio de Economía y Competitividad (CTQ2010-17127) is gratefully acknowledged. C.F-B. thanks Ministerio de Educación for a predoctoral FPU fellowship. D.I. thanks Ministerio de Economia y Competitividad for a predoctoral FPI fellowship.. 16.
(17) References (1) Burda, C.; Chen, X.; Narayanan, R.; El-Sayed, M. A. Chemistry and Properties of Nanocrystals of Different Shapes. Chem. Rev. 2005, 105, 1025–1102. (2) Wang, J.; Rincón, O.; Polsky, R.; Dominguez, E. Electrochemical Detection of DNA Hybridization Based on DNA-Template Assembly of Silver Cluster. Electrochem. Commun. 2003, 5, 83–86. (3) Lu, Y.; Mei, Y.; Drechsler, M.; Ballauff, M. Thermosensitive Core-Shell Particles as Carriers for Ag Nanoparticles: Modulating the Catalytic Activity by a Phase Transition in Networks. Angew. Chemie 2006, 45, 813–816. (4) Rai, M.; Yadav, A.; Gade, A. Silver Nanoparticles as a New Generation of Antimicrobials. Biotechnol. Adv. 2009, 27, 76–83. (5) Kelly, K. L.; Coronado, E.; Zhao, L. L.; Schatz, G. C. The Optical Properties of Metal Nanoparticles: The Influence of Size, Shape and Dielectric Environment. J. Phys. Chem. B 2003, 107, 668–677. (6) Xie, W.; Qiu, P.; Mao, C. Bio-Imaging, Detection and Analysis by Using Nanostructures as SERS Substrates. J. Mater. Chem. 2011, 21, 5190–5202. (7) Bantz, K. C.; Meyer, A. F.; Wittenberg, N. J.; Im, H.; Kurtuluş, O.; Lee, S. H.; Lindquist, N. C.; Oh, S.H.; Haynes, C. L. Recent Progress in SERS Biosensing. Phys. Chem. Chem. Phys. 2011, 13, 11551–11567. (8) Álvarez-Puebla, R. A.; Liz-Marzán, L. M. Environmental Applications of Plasmon Assisted Raman Scattering. Energy Environ. Sci. 2010, 3, 1011-1017.. 17.
(18) (9) Anker, J. N.; Hall, W. P.; Lyandres, O.; Shah, N. C.; Zhao, J.; Van Duyne, R. P. Biosensing with Plasmonic Nanosensors. Nat. Mater. 2008, 7, 442–453. (10) Kim, H.; Kosuda, K. M.; Van Duyne, R. P.; Stair, P. C. Resonance Raman and Surface- and Tip-Enhanced Raman Spectroscopy Methods to Study Solid Catalysts and Heterogeneous Catalytic Reactions. Chem. Soc. Rev. 2010, 39, 4820–4844. (11) Langille, M. R.; Personick, M. L.; Mirkin, C. A. Plasmon-Mediated Syntheses of Metallic Nanostructures. Angew. Chem. Int. Ed. 2013, 52, 13910–13940. (12) Choi, Y. J.; Huh, U.; Luo, T. M. Spontaneous Formation of Silver Nanoparticles in Aminosilica. J. Sol-Gel Sci. Technol. 2009, 51, 124–132. (13) Metraux, G. S.; Mirkin, C. A. Rapid Thermal Synthesis of Silver Nanoprisms with Chemically Tailorable Thickness. Adv. Mater. 2005, 17, 412–415. (14) Monti, O. L. A.; Nesbitt, D. J. Diffraction-Limited Photogeneration and Characterization of Silver Nanoparticles. J. Phys. Chem. B 2004, 108, 1604–1612. (15) Wang, A.; Yin, H.; Ge, C.; Ren, M.; Liu, Y.; Jiang, T. Synthesis of Hollow Silver Spheres Using Poly-(styrene-Methyl Acrylic Acid) as Templates in the Presence of Sodium Polyacrylate. Appl. Surf. Sci. 2010, 256, 2611–2615. (16) Rodríguez-Sánchez, L.; Blanco, M. C.; López-Quintela, M. A. Electrochemical Synthesis of Silver Nanoparticles. J. Phys. Chem. B 2000, 104, 9683–9688. (17) Chen, S.; Carroll, D. L. Silver Nanoplates: Size Control in Two Dimensions and Formation Mechanisms. J. Phys. Chem. B 2004, 108, 5500–5506.. 18.
(19) (18) Schlücker, S. Surface-Enhanced Raman Spectroscopy: Concepts and Chemical Applications. Angew. Chem. Int. Ed. 2014, 53, 2–42. (19) Kneipp, K.; Kneipp, H.; Itzkan, I.; Dasari, R. R.; Feld, M. S. Ultrasensitive Chemical Analysis by Raman Spectroscopy. Chem. Rev. 1999, 99, 2957–2976. (20) Moskovits, M. Surface-Enhanced Raman Spectroscopy: A Brief Retrospective. J. Raman Spectrosc. 2005, 36, 485–496. (21) Oldenburg, S. J.; Westcott, S. L.; Averitt, R. D.; Halas, N. J. Surface Enhanced Raman Scattering in the near Infrared Using Metal Nanoshell Substrates. J. Chem. Phys. 1999, 111, 4729–4735. (22) Kumar, G. V. P.; Irudayaraj, J. SERS in Salt Wells. ChemPhysChem. 2009, 10, 2670–2673. (23) Baia, L.; Baia, M.; Popp, J.; Astilean, S. Gold Films Deposited over Regular Arrays of Polystyrene Nanospheres as Highly Effective SERS Substrates from Visible to NIR. J. Phys. Chem. B 2006, 110, 23982–23986. (24) Wen, R.; Fang, Y. An Investigation of the Surface-Enhanced Raman Scattering (SERS) Effect from a New Substrate of Silver-Modified Silver Electrode. J. Colloid Interface Sci. 2005, 292, 469–475. (25) Harte, E. Surface-Enhanced Raman and Fluorescence Spectroscopy of Dye Molecules Deposited on Nanostructured Gold Surfaces. J. Phys. Chem. C 2010, 114, 12878–12884. (26) Sánchez-Iglesias, A.; Aldeanueva-Potel, P.; Ni, W.; Pérez-Juste, J.; Pastoriza-Santos, I.; Alvarez-Puebla, R. A.; Mbenkum, B. N.; Liz-Marzán, L. M. Chemical Seeded Growth of Ag. 19.
(20) Nanoparticle Arrays and Their Application as Reproducible SERS Substrates. Nano Today 2010, 5, 21–27. (27) Lee, J.; Shim, S.; Kim, B.; Shin, H. S. Surface-Enhanced Raman Scattering of Single- and Few-Layer Graphene by the Deposition of Gold Nanoparticles. Chem. - A Eur. J. 2011, 17, 2381–2387. (28) Kumar, G. V. P. Surface-Enhanced Raman Scattering Studies of Carbon Nanotubes Using Ag-Core Au-Shell Nanoparticles. J. Raman Spectrosc. 2009, 40, 2069–2073. (29) Félidj, N.; Aubard, J.; Lévi, G.; Krenn, J.; Schider, G.; Leitner, A.; Aussenegg, F. Enhanced Substrate-Induced Coupling in Two-Dimensional Gold Nanoparticle Arrays. Phys. Rev. B 2002, 66, 1–7. (30) Félidj, N.; Aubard, J.; Lévi, G.; Krenn, J. R.; Hohenau, A.; Schider, G.; Leitner, A.; Aussenegg, F. R. Optimized Surface-Enhanced Raman Scattering on Gold Nanoparticle Arrays. Appl. Phys. Lett. 2003, 82, 3095-3097. (31) Lin, X. M.; Cui, Y.; Xu, Y. H.; Ren, B.; Tian, Z. Q. Surface-Enhanced Raman Spectroscopy: Substrate-Related Issues. Anal. Bioanal. Chem. 2009, 394, 1729–1745. (32) Cejkova, J.; Prokopec, V.; Brazdova, S.; Kokaislova, A.; Matejka, P.; Stepanek, F. Characterization of Copper SERS-Active Substrates Prepared by Electrochemical Deposition. Appl. Surf. Sci. 2009, 255, 7864–7870. (33) Chen, H.; Wang, Y.; Dong, S.; Wang, E. An Approach for Fabricating Self-Assembled Monolayer of Ag Nanoparticles on Gold as the SERS-Active Substrate. Spectrochim. Acta. A. Mol. Biomol. Spectrosc. 2006, 64, 343–348.. 20.
(21) (34) Reents, B.; Lacconi, G.; Plieth, W. Raman Spectroscopy of Silver Plating from a Cyanide Electrolyte. J. Electroanal. Chem. 1992, 325, 207–217. (35) Fleischmann, M.; Tian, Z. Q. An SERS Study of Silver Electrodeposition from Thiourea and Cyanide Containing Solutions. Electrochim. Acta 1985, 31, 907–916. (36) Schaaf, F.; Laufer, G.; Huneke, J. T. Surface Enhanced Raman Spectroscopy of Cyanide Complexes on Silver Surfaces. Chem. Phys. Lett. 1981, 82, 571–577. (37) Fernández-Blanco, C.; Colina, A.; Heras, A.; Ruiz, V.; López-Palacios, J. Multipulse Strategies. for. the. Electrosynthesis. of. Gold. Nanoparticles. Studied. by. UV/Vis. Spectroelectrochemistry. Electrochem. Commun. 2012, 18, 8–11. (38) Tsuji, M.; Gomi, S.; Maeda, Y.; Matsunaga, M.; Hikino, S.; Uto, K.; Tsuji, T.; Kawazumi, H. Rapid Transformation from Spherical Nanoparticles, Nanorods, Cubes, or Bipyramids to Triangular Prisms of Silver with PVP, Citrate, and H2O2. Langmuir 2012, 28, 8845–8861. (39) Tang, B.; Xu, S.; An, J.; Zhao, B.; Lombardi, J. R. Kinetic Effects of Halide Ions on the Morphological Evolution of Silver Nanoplates. Phys. Chem. Chem. Phys. 2009, 11, 10286– 10292. (40) Tsai, C. M.; Hsu, M. S.; Chen, J. C.; Huang, C. L. Mechanistic Study of Shape Evolution of Silver Nanoprisms in The Presence of KSCN. J. Phys. Chem. C 2012, 116, 461–467. (41) Jin, R.; Cao, Y.; Mirkin, C. A.; Kelly, K. L.; Schatz, G. C.; Zheng, J. G. Photoinduced Conversion of Silver Nanospheres to Nanoprisms. Science 2001, 294, 1901–1903. (42) Chen S, Fan Z, Carroll DL. Silver nanodisks: synthesis, characterization, and self-assembly. J. Phys. Chem. B. 2002, 106, 10777–10781.. 21.
(22) (43) Ghosh, S. K.; Kundu, S.; Pal, T. Evolution, Dissolution and Reversible Generation of Gold and Silver Nanoclusters in Micelle by UV-Activation. Bull. Mater. Sci. 2002, 25, 581–582. (44) Fathi, F.; Schlitt, M.; Pedersen, D. B.; Kraatz, H.-B. Chemical Behavior of Electrochemically Generated Nanostructured Silver Surfaces. Langmuir 2011, 27, 12098–12105. (45) Lee, B. H.; Hsu, M. S.; Hsu, Y. C.; Lo, C. W.; Huang, C. L. A Facile Method To Obtain Highly Stable Silver Nanoplate Colloids with Desired Surface Plasmon Resonance Wavelengths. J. Phys. Chem. C 2010, 114, 6222–6227. (46) Tan, T.; Tian, C.; Ren, Z.; Yang, J.; Chen, Y.; Sun, L.; Li, Z.; Wu, A.; Yin, J.; Fu, H. LSPRDependent SERS Performance of Silver Nanoplates with Highly Stable and Broad Tunable LSPRs Prepared through an Improved Seed-Mediated Strategy. Phys. Chem. Chem. Phys. 2013, 15, 21034–21042. (47) Liu, Y.; Yang, K.; Hsu, T. Improved Surface-Enhanced Raman Scattering Performances on Silver-Silica. J. Phys. Chem. C 2009, 113, 8162–8168.. 22.
(23) Figures Figure 1. Figure 1. Cyclic voltammogram obtained in AgNO3 4.8x10⁻³ M, KCN 2.8x10⁻² M, KNO3 0.4 M solution. The potential was scanned from 0.00 V to -1.00 V and back to 0.00 V at 0.050 V s−1 (the four segments differentiated in colors are explained in Fig. 4).. 23.
(24) Figure 2.a. Figure 2.b. 24.
(25) Figure 2. (a) 3D plot Raman signal/time/Raman Shift (b) Raman spectra plotted each 1.60 s; fs: forward scan, bs: backward scan corresponding to the experiment shown in Fig. 1.. Figure 3. Figure 3. 3D plot UV/Vis Absorbance/time/wavelength obtained during the whole experiment in the experimental conditions detailed in Fig. 1.. 25.
(26) Figure 4.a. Figure 4.b. Figure 4.c. 26.
(27) Figure 4.d. Figure 4. UV/Vis absorption spectra from (a) 0.00 V to -0.80V, (b) -0.80 V to -0.60V, (c) -0.60 V to -0.40V, (d) -0.40 V to 0.00V.. 27.
(28) Figure 5.a. Figure 5.b. Figure 5.c. 28.
(29) Figure 5. Evolution of (a) Raman intensity band at 2110 cm-1, (b) absorbance at 420 nm and (c) maximum UV/Vis wavelength of the plasmon band with the potential. Blue line: cathodic sweep, green line: anodic sweep. Experimental conditions in Fig. 1.. 29.
(30) Figure 6. Figure 6. Contour plot of the UV/Vis plasmon band evolution with the time obtained during a silver electrodeposition experiment. Potential was scanned from 0.00 V to -1.00 V at a scan rate of 0.05 V s-1 in a 4.8x10⁻³ M AgNO3, 0.4 M of KNO3 and 2.8x10⁻² M of KCN solution. Spectra were recorded during the electrodeposition process and for 50 seconds in addition with open potential circuit. Black line indicates when the potential scan is stopped and released at open circuit potential.. 30.
(31) Figure 7.a. Figure 7.b. Figure 7.c. 31.
(32) Figure 7.d. Figure 7. (a) Cyclic voltammogram obtained in AgNO3 4.8x10⁻³ M, KCN 2.8x10⁻⁵ M, KNO3 0.4 M solution. The potential was scanned from +0.70 V to +0.15 V and back to +0.70 V at 0.010 V s−1. (b) UV/Vis absorption spectra at different potentials; fs: forward scan, bs: backward scan. Evolution of (c) Raman intensity band at 2150 cm-1 and (d) absorbance at the maximum of the plasmon band. Blue line: cathodic sweep, green line: anodic sweep.. 32.
(33) Table of contents (TOC). 33.
(34)
Figure

Documento similar
Selective identification, characterization and determination of dissolved silver(I) and silver nanoparticles based on single particle detection by inductively coupled plasma
One-step Synthesis of Silver Nanoparticles Using Saudi Arabian Desert Seasonal Plant Sisymbrium irio and Antibacterial Activity Against Multidrug-Resistant Bacterial
The analysis of the biological effects of gold nanoparticles generated by biological reduction of HAuCl 4 gold precursor in HeLa cells and the comparison with
Mazarío, “Effect of the surface charge on the adsorption capacity of chromium (VI) of iron oxide magnetic nanoparticles prepared by microwave-assisted synthesis,”.
In order to better comprehend the electrografting process and consequently have a higher control of it, in this work we have carried out an exhaustive study by operando
The enhancement of the fluorescence when the PSi matrices were loaded in vacuum conditions, showed in Table 1, indicates that Em/Ag complexes present higher enhancements when they
Raman scattering using three different excitation wavelengths and its analysis have been performed to confirm the absence of secondary phases in the samples, and
7 and 8 is attributed to five main factors: (1) Reduction in the recombination rates by improving surface passivation, (2) improved light trapping by the use of TiO 2 thin film
