The 5S rDNA gene family in mollusks: characterization of transcriptional regulatory
regions, prediction of secondary structures, and long-term evolution, with special
attention to Mytilidae mussels
Miguel Vizoso, Joaquín Vierna, Ana M. González-Tizón, Andrés Martínez-Lage
Department of Molecular and Cell Biology, Evolutionary Biology Group (GIBE), Universidade da Coruña, E-15008 La Coruña, Spain
Journal of Heredity Volume 102, Issue 4, pages 433–447, July-August 2011 Received 03 April 2011, Accepted 22 April 2011,Published 01 July 2011
This is a pre-copyedited, author-produced version of an article accepted for publication in Journal of Heredity following peer review. The version of record
Miguel Vizoso, Joaquín Vierna, Ana M. González-Tizón, Andrés Martínez-Lage; The 5S rDNA gene family in mollusks: characterization of transcriptional regulatory regions, prediction of secondary structures, and long-term evolution, with special attention to Mytilidae mussels. J Hered 2011; 102 (4): 433-447
is available online at: https://doi.org/10.1093/jhered/esr046.
Abstract
Several reports on the characterization of 5S ribosomal DNA (5S rDNA) in various animal groups have been published to date, but there is a lack of studies analyzing this gene family in a much broader context. Here, we have studied 5S rDNA variation in several molluskan species, including bivalves, gastropods, and cephalopods. The degree of conservation of transcriptional regulatory regions was analyzed in these lineages, revealing a conserved TATA-like box in the upstream region. The evolution of the 120 bp coding region (5S) was also studied, suggesting the occurrence of paralogue groups in razor clams, clams, and cockles. In addition, 5S rDNA sequences from 11 species and 7 genus of Mytilidae Rafinesque, 1815 mussels were sampled and studied in detail. Four different 5S rDNA types, based on the nontranscribed spacer region were identified. The phylogenetic analyses performed within each type showed a between-species gene clustering pattern, suggesting ancestral polymorphism. Moreover, some putative pseudogenized 5S copies were also identified. Our report, together with previous studies that found high degree of intragenomic divergence in bivalve species, suggests that birth-and-death evolution may be the main force driving the evolution of 5S rDNA in these animals, even at the genus level.
Keywords: ancestral polymorphism, birth-and-death evolution, concerted evolution, mollusks, pseudogenes, 5S ribosomal RNA
One of the main goals of previous studies was to figure out how 5S rDNA was transcribed and which elements (trans- and cis-acting) regulate this process in the cell. Experimental work was carried out in different organisms such as fungi (Tyler 1987; Challice and Segall 1989; Ihmels et al. 2005), animals (Morton and Sprague 1984; Pieler et al. 1987; Sharp and García 1988; Reynolds and Azer 1988; Oei and Pieler 1990; Felgenhauer et al. 1990; Nielson et al. 1993), and plants (Wyszko and Barciszewska 1997; Leal-Klevezas et al. 2000; Hammond et al. 2009). 5S rDNA belongs to type I promoters, characterized by the presence of transcription control elements within the transcribed region (for a review, see Paule and White 2000). However, it is becoming quite clear that the internal promoter is not self-sufficient to carry on the transcription. In fact, it is known that the 5S rDNA also presents upstream transcriptional regulatory regions in several taxa. A TATA-like motif located at around −30 to −25 nucleotides is essential for efficient transcription in vitro in Caenorhabditis elegans and C. briggsae (Nelson et al. 1998), Neurospora crassa (Tyler 1987), and Drosophila melanogaster (Sharp and García 1988). In razor shells, a conserved TATA-like box was also found at −25 nt (Vierna et al. 2011). Therefore, and due to the versatility of 5S rDNA transcription, it is interesting to analyze and identify conserved motifs in different lineages that may have a function in transcription. According to Smirnov et al. (2008) and Sun and Caetano-Anollés (2009), sequence analyses should be accompanied by the prediction of secondary structures, which will contribute to better understand the 5S rRNA functionality and its evolutionary pathways in eukaryotes.
The 5S rDNA has a plastic genome organization because it was found to be organized 1) in clusters composed of similar or distinct tandemly arranged copies (Shippen-Lentza and Vezza 1988), 2) in clusters linked either to other gene families or to other 5S rDNA copies (Aksoy et al. 1992; Eirín-López et al. 2004; Vierna et al. 2011), 3) dispersed throughout the genome (Wood et al. 2002), and 4) both in clusters and dispersed (Little and Braaten 1989). The evolution of ribosomal gene families has recently been the subject of controversy due to the heterogeneous outcomes observed when it was analyzed in various taxa. For a long time, the concerted evolution model (Brown et al. 1972) was assumed to be the common mode of ribosomal gene family evolution, mainly due to the observed lack of intraspecific polymorphism and the tandem organization of repeats (Dover 1982; Arnheim 1983; Li 1997; Nei and Rooney 2005; Eickbush TH and Eickbush DG 2007). The lack of variability in coding regions was explained by the action of unequal crossover and gene conversion (Li 1997), and the fixation of copies by genetic drift (Dover 1982; Arnheim 1983; Dover and Tautz 1986). However, the observed heterogeneity and the dispersed distribution of genes within some taxa (e.g., in filamentous fungi, Rooney and Ward 2005) pointed to other mechanisms possibly generating variation. It may happen that the homogenizing mechanisms are not strong enough to counteract this variation. For instance, in razor clams, it was suggested that a higher homogenization efficiency exists within the ITS1-5.8S-ITS2 region compared with 5S rDNA, as the latter ribosomal gene family could be more dispersed in the genome (Vierna et al. 2010). In agreement with these observations, several studies have shown that birth-and-death processes and selection can drive the evolution of 5S rDNA in distantly related taxa (Rooney and Ward 2005; Fujiwara et al. 2009; Vierna et al. 2009, 2011; Freire et al. 2010).
In mollusks, 5S rDNA sequences have been obtained for several gastropods, cephalopods, and bivalves (Fang et al. 1982; Walker and Doolittle 1983; Komiya et al. 1986; Hendriks et al. 1987; Insua et al. 1999, 2001; Cross and Rebordinos 2005; Freire et al. 2005, 2010; González-Tizón et al. 2008; López-Piñón et al. 2008; Vierna et al. 2009, 2011; Fernández-Tajes and Méndez 2009). However, in bivalves, 5S rDNA has been studied in much more detail. In this paper, we analyze all available molluskan 5S rDNA sequences and study the degree of conservation of upstream, internal, and downstream transcriptional regulatory regions. We provide consensus secondary structures for all groups considered (cephalopods, gastropods, bivalves, and Mytilidae mussels) and study the long-term evolution of the 5S region in the phylum Mollusca. Since molluskan lineages started to diverge either in the Ediacaran period or in the Cambrian Era, the lapse of time considered dates back to these periods (Fedonkin and Waggoner 1997). Moreover, we obtained 44 new mussel sequences and analyzed 5S rDNA within the family Mytilidae Rafinesque 1815 (Mollusca: Bivalvia) in detail. The evolution of 5S rDNA has been only recently studied within families in razor clams (Vierna et al. 2011). Our report, together with what was found in these animals, suggests that birth-and-death evolution may be the main force driving the evolution of 5S rDNA in bivalve mollusks, even at the genus level, or at least, that this mode of evolution is much more common than it was previously thought. Taking into account the remarkable number of surveys reporting high intragenomic divergence within 5S rDNA in molluskan species, we discuss the role played by birth-and-death processes in the generation of the extant variation that we see today within this gene family.
Materials and Methods
Sampling and Molecular Procedures
All mussels were sampled in the intertidal area (localities and accession numbers are shown in Table 1) and stored in 100% ethanol. Extraction of genomic DNA, PCR amplification, agarose gel electrophoresis, bacterial cloning, and sequencing were performed as in Vierna et al. (2009). A multiband pattern was obtained (band size ranged from 300 to 900 bp, approximately), and each band was cloned and sequenced independently, obtaining 44 sequences in total. The number of clones per band per individual can be retrieved from http://www.udc.es/grupos/gibe/uploads/gibe/supplementary-material/vizoso2011.zip.
In addition, all molluskan 5S rDNA sequences, including those from bivalve, cephalopod, and gastropod species, were downloaded from the DNA Data Bank of Japan (DDBJ)/European Molecular Biology Laboratory(EMBL)/GenBank and included in several analyses. The accession numbers of all molluskan sequences studied and the analysis in which they were involved are recorded in Supplementary Table S1.
Alignments and Sequence Analysis
Table 1. Taxa and accession numbers used in the phylogenetic analyses of 5S rDNA in Mytilidae.
PE. Canada FN687810 FN687809 N. A. FN561838-FN561840
Putative 5S rDNA transcriptional regulatory motifs were identified via the TOUCAN workbench (Aerts et al. 2003) establishing a comparison with reference sequences from the Eukaryotic Promoter (http://www.epd.isb-sib.ch/) and JASPAR databases (http://jaspar.genereg.net/) and selecting those predicted features that were statistically overrepresented (nucleotide stretches within the upstream region of the sequence, with a positive significance value). The screening of the repetitive elements linked to 5S rDNA was made by CENSOR (Kohany et al. 2006), and the program tRNAscan-SE 1.21 (Lowe and Eddy 1997) was used to define and predict the secondary structure of the transfer RNA (tRNA) sequence that we found. Each 5S sequence was folded in RNAstructure 5.1 (Reuter and Mathews 2010) to obtain the predicted secondary structures, applying constrictions at 15 °C, and using the EFN2 function to recalculate ΔG values (Mathews et al. 1999). All the consensus secondary structures were obtained from the RNAalifold webserver (Hofacker 2003).
Polymorphism and Phylogenetic Analyses
The analysis of mussel nucleotide polymorphism was performed in DnaSP 5.0 (Librado and Rozas 2009), calculating the nucleotide diversity (Π) within species for each of the 5S rDNA types obtained. For that, we also took into account the geographic localities where mussels were sampled due to they may introduce variation in the π value. We also estimated the number of polymorphic sites (S) and the number of fixed differences between 5S rDNA types.
Eighty-five mussel sequences, belonging to α, β, and δ types (Table 1), were subjected to maximum parsimony (MP) and maximum likelihood (ML) analyses. Both MP and ML trees were constructed in PAUP* 4.0 b10 (Swofford 2002) using the heuristic approach and 1000 bootstrap replicates. Bootstraps above 85% were interpreted as high statistical support. Gaps were treated as newstate under MP and as missing information under ML. In all analyses, starting trees were obtained via stepwise addition with random addition of sequences (10 replicates). For ML analyses, the best-fit model of nucleotide substitution was selected by statistical comparison of 88 different models using jModeltest 0.01 (Posada 2008) and applying the Akaike information criterion corrected for small samples (AICc). The models were F81+G (−lnL = 581.3032, AICc = 1305.1518) for sequences classified as α type; TPM3uf+G (−lnL = 3516.6318, AICc = 7194.8499) for β type sequences; and HKY+G (−lnL = 1052.6409, AICc = 2220.7196) for the δ type. Pairwise distances were also calculated according to these models. Gaps were not considered in these
analyses. All trees were displayed in FigTree 1.2.2 (Andrew Rambaut,
http://tree.bio.ed.ac.uk/software/figtree/).
All available molluskan 5S sequences, including the new mussel sequences and those obtained from DDBJ/EMBL/GenBank, were subjected to a neighbor-net analysis (Bryant and Moulton 2004) implemented as part of the SplitsTree4 package (Huson and Bryant 2006), using general time reversible distances and 1000 bootstrap replicates.
Results
Characterization of Mytilidae Sequences
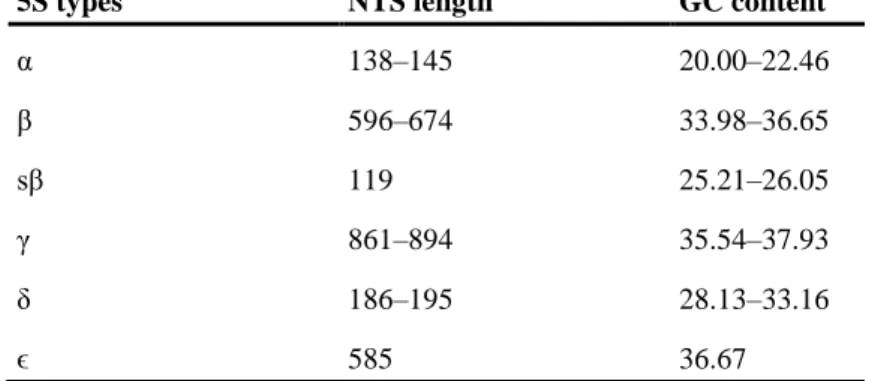
Table 2. Length and guanine/cytosine content of the 5S rDNA nontranscribed spacer region.
5S types NTS length GC content
α 138–145 20.00–22.46
β 596–674 33.98–36.65
sβ 119 25.21–26.05
γ 861–894 35.54–37.93
δ 186–195 28.13–33.16
ϵ 585 36.67
Because length variation may be a problem when performing alignments, we eliminated poorly aligned positions and divergent regions, as they may not be homologous. In order to allow the program (Gblocks) to select more sites, we applied the following (less restricted) conditions: minimum length of a block = 5 and all gap positions allowed. After doing so for the NTS region, only 20% of the nucleotide positions were selected. Therefore, we performed a statistical evaluation of the local similarities between NTS sequences following Pearson and Wood (2001), in order to classify the sequences into the correct 5S type following a statistical criterion. First, we checked by eye the alignment of all sequences and separated them into groups according to their similar NTS regions and lengths. Then, we performed pairwise comparisons between sequences within the groups and among the groups, taking notice of the expectation values (E values), ranged between 0 and 1. They provide an estimate of how likely it is that the alignment occurred by random chance. After that, if the E value obtained in a pairwise comparison of 2 sequences selected at random was between 1 and 4 × 10−09 (the lower median E value obtained for pairwise comparisons among the groups), we considered that sequences belonged to different types, whereas if the E value was between 0 and 3 × 10−65 (the upper median E value obtained for pairwise comparisons within the groups), the sequences were classified into the same type, regardless of the length.
The sequences experimentally obtained belonged to the previously described α and β 5S rDNA types (Insua et al. 2001) and to 2 new types that we named δ and ϵ. Two clones were retrieved from Choromytilus chorus and Perna canaliculus differing in nucleotide sequence in respect to the β type but being similar in length. As they displayed some sequence similarity in respect to β sequences (mean p-distances of 0.55 and 0.46, respectively), we thought convenient to consider them as β degenerated copies. Mussel sequences from DDBJ/EMBL/GenBank belonged to α, β, small-β (sβ), and γ types (the last 2 types were described by Freire et al. [2010]).
Considering the alignments and the bootstraps obtained in the phylogenetic analyses (see below), we established an arbitrary division of the sequences based on supergroups and groups. 1) We split α clones into supergroups 1 and 2 according to a conserved GT duplication at the beginning of the NTS. 2) β clones were split into 3 supergroups as follows: supergroup 1 NTSs had a conserved CTCTC insertion close to the 5′ end and they were subdivided into 2 groups (group A could be differentiated from group B according to a conserved duplication AGCT and to an AT-rich insertion of 14 bp occurring in the middle of the NTS); supergroup 2 sequences (which belonged either to group C or to group D) displayed a (TATA)3 motif close
Polymorphism and Phylogenetic Analyses in Mytilidae Mussels
Nucleotide diversity analyses revealed that α NTSs showed few differences per site (the Mytilus trossulus clones from the American Atlantic coast were the most dissimilar; 0.058 ± 0.028). The β NTSs displayed high nucleotide diversity levels (e.g., C. chorus, 0.177 ± 0.089; European M. trossulus, 0.143 ± 0.002). And the same was found for δ NTSs (e.g., M. coruscus, 0.144 ± 0.028).
These results were complementary to evolutionary distances (Supplementary Tables S2A–C). According to the α and β pairwise distances, M. trossulus was clearly separated from the other species (e.g., clone α3 BB) and even showed high divergence among their own members (e.g., β group B versus β group D). Similarly, M. edulis and C. chorus β clones also displayed high divergence among their own members. Other divergent clones were reported within the β type in M. californianus (e.g., sβ group) and in the δ type in M. coruscus (e.g., supergroup 2).
We identified 15 polymorphic sites within the Mytilidae 5S sequences and 3 fixed differences (Supplementary Figure S3). Position +59 separated all ϵ sequences from all α and β sequences. Positions +59 and +68 separated sβ sequences from ϵ ones, and position +68 distinguished the sβ type from the α type. The analysis of the NTS region revealed 23 polymorphic sites within α NTSs, 213 within β NTSs, 3 within sβ NTSs, 161 within γ NTS, 75 within δ NTS, and 64 within ϵ NTS. The most polymorphic group of sequences regarding the NTSs was the δ type (number of polymorphic sites per length of NTS, 0.41).
According to the 3 phylogenies obtained (α, β, and δ, Figures 1–3), many sequences showed a between-species gene clustering pattern (e.g., α type topology, Figure 1). In fact, an M. edulis (PE) clone clustered with clones belonging to Lithophaga lithophaga and Aulacomya ater individuals, and it was separated from their European partners that clustered with M. galloprovincialis clones. However, both M. trossulus and M. galloprovincialis clones grouped according to a within-species gene clustering pattern supported by high bootstraps. In the β type phylogeny (Figure 2), M. edulis (YE), C. chorus, and M. trossulus (EL, BB, and BS) clones were intermixed in supergroups 1 and 2. But, once again, clones of M. galloprovincialis (group A) and M. californianus (group E and small β group) clustered following a within-species gene clustering pattern. This phylogenetic tree included several putative pseudogenes in the small β group. With respect to the 2 new types, we performed a phylogenetic analysis of only δ type sequences because the others included only L. lithophaga clones. This was the only type in which some dimers and a trimer sequence were identified (all of them belonging to the δ type). A dimer is composed of the last 88 nucleotides of a 5S, a complete NTS, a complete 5S, a complete NTS, and the first 32 of the last 5S. Similarly, a trimer has an additional 5S+NTS in between. Sequences belonging to each supergroup (1 and 2) were reciprocally monophyletic with the highest support (Figure 3). Supergroup 1 included several clones of the 3 species, in comparison with supergroup 2, represented by only M. coruscus clones. This phylogeny also included 2 pseudogenes belonging to S. algosus species. In all cases, both MP and ML analyses yielded similar topologies.
Identification of a tRNA-Arg Gene Linked to a Degenerated 5S rDNA Sequence Belonging to C. chorus
Figure 1. ML bootstrap consensus tree of the α 5S rDNA sequences reconstructed using the F81+G model. Bootstrap values are indicated at the nodes when ≥50. Sequences obtained from DDBJ/EMBL/GenBank are denoted by (*).
Species: A. ater, Aulacomya ater; L. lithophaga, Lithophaga lithophaga; M. edulis, Mytilus edulis; M. galloprovincialis, Mytilus galloprovincialis; M. trossulus, Mytilus trossulus; P. canaliculus, Perna canaliculus.
Figure 2. ML bootstrap consensus tree of the β 5S rDNA sequences reconstructed using the TPM3uf+G model. Bootstrap values are indicated at the nodes when ≥50. Sequences obtained from DDBJ/EMBL/GenBank are denoted by (*). Species: M. galloprovincialis, Mytilus galloprovincialis; C. chorus, Choromytilus chorus; M. edulis, Mytilus edulis;
Figure 3. ML bootstrap consensus tree of the δ 5S rDNA sequences reconstructed using the HKY+G model. Bootstrap values are indicated at the nodes when ≥50. Sequences obtained from DDBJ/EMBL/GenBank are denoted by (*). Species: S. algosus, Semimytilus algosus; M. capax, Modiolus capax; M. coruscus, Mytilus coruscus. Pseudogenes are
denoted by Ψ.
Figure 4. Predicted secondary structure for the tRNA-arginine (tRNA-arg) gene linked to a degenerated sequence from Choromytilus chorus. The anticodon for arginine (gray box) and the boxes involved in the tRNA transcription
Transcription Regulatory Elements in Mollusks
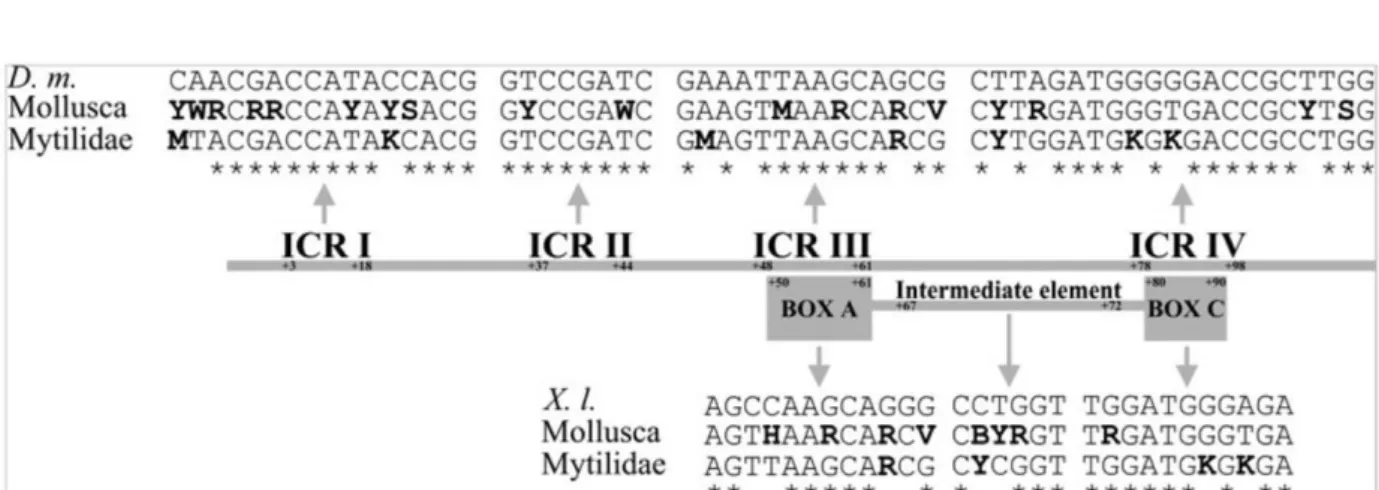
A graphical representation of the 5S internal promoters and their consensus sequences is shown in Figure 5. The 4 internal control regions (ICRs) involved in the transcription of 5S rDNA (Sharp and García 1988) were identified in the Mytilidae 5S sequences. Therefore, positions 3–18, 37–44, 48–61, and 78–98 showed high similarity with their orthologues of D. melanogaster (see Figure 5). We also identified the sequence elements described in Xenopus laevis (Pieler et al. 1987) that are functionally equivalent to the ICRs: positions 50–61 (box A), 67–72 (intermediate element), and 80–90 (box C), which displayed a high degree of similarity (see Figure 5). In the same way, molluskan consensus internal regulatory regions are recorded in Figure 5, showing higher variability, as expected.
Figure 5. Schematic comparison of the control elements involved in the transcription of 5S rDNA. The top sequences represent the ICRs and sequence elements (box A, intermediate element, and box C) of D. melanogaster (D. m.) and Xenopus laevis (X. l.). The bottom sequences represent the consensus molluskan and Mytilidae orthologues. Differences between Mollusca and Mytilidae stretches are indicated in boldface and similarities respect to the consensus
sequences described for D. melanogaster and X. laevis (Pieler et al. 1987; Sharp and García 1988, respectively) are denoted by (*).
Table 3. Sequences of the upstream conserved TATA-like motif in bivalves.
Taxa Position Sequence
Clams −30 to −25 TATATA (1, 6%)
−29 to −26 TATA (9, 53%)
Oysters −30 to −24 TATATT (9, 82%)
Cockles −28 to −23 TAAATA (48, 98%)
Scallops −28 to −23 TAAATA (3, 21%)
−30 to −25 TATAAA (6, 43%)
Razor clams −28 to −23 TAAATA (74, 61%)
Mussels −28 to −23 TATATA (67, 63%)
−28 to −25 TATA (21, 20%)
The NTS region of mussel species contained some conserved elements that may be involved in 5S transcription initiation (Supplementary Figure S4) and termination, some of them previously described by Morton and Sprague (1984) and Campbell and Setzer (1992), respectively. The NTS sequences of α and β types displayed the complete blocks TATATA and AATTTT at the 3′ end. However, the sβ NTSs retained the TATATA motif but not the other one because 2 insertions A(C)ATT(G)T occurred within. In respect to δ NTSs, supergroup 1 clones lacked the integral TATATA motif because of a point mutation (TAAATA) and supergroup 2 clones presented a shorter TATA-like motif, but all of them displayed the AATTTT block. Finally, all NTSs, except sβ ones, displayed the oligo (dT)≥4 at the 5′ end (data not shown). We also analyzed
the upstream elements from sequences of several molluskan lineages, with the exception of cephalopods, whose 5S rDNA sequences consisted of only the 5S region. Many sequences displayed a TATA-like motif (see Table 3) and some of them (razor clams) also contained an element similar to the vertebrate E-box (CANNTG). However, we did not find any statistically overrepresented motif between a TATA-like box and the transcription start site for gastropods, clams, cockles, oysters, or scallops.
Secondary Structures and Pseudogenes
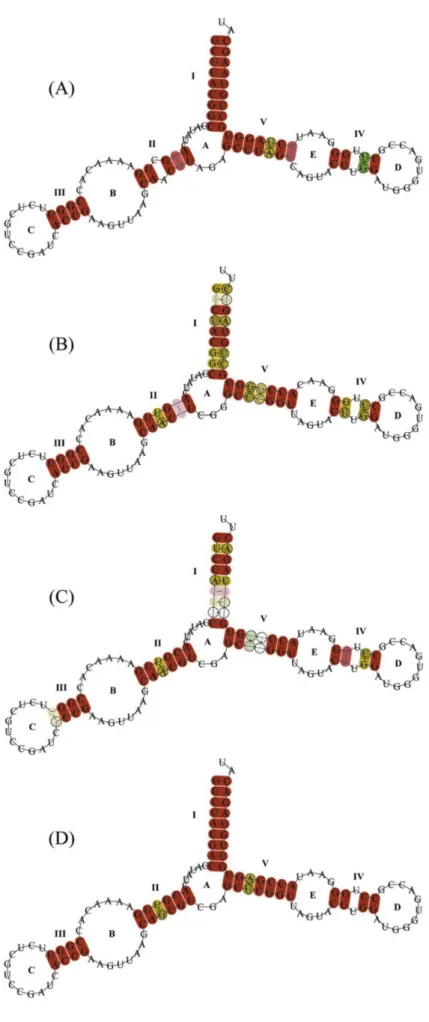
After applying several constrictions (see http://www.udc.es/grupos/gibe/uploads/gibe/supplementary-material/vizoso2011.zip), most of the predicted secondary structures (Figure 6, Supplementary Figure S5A,B) were consistent with the general eukaryote 5S rRNA structure (Luehrsen and Fox 1981; Fang et al. 1982; Smirnov et al. 2008; Sun and Caetano-Anollés 2009). The Mytilidae consensus secondary structure was compared with the consensus obtained for Cephalopoda, Gastropoda, and Bivalvia (Figure 6). In the consensus predicted secondary structures of these molluskan lineages, we identified the 5 helices (I to V), the 2 hairpin loops (C and E), the 2 internal loops (B and D), and the hinge region A. Remarkably, the 4 consensus secondary structures obtained showed highly conserved base pairs at both the beginning and the end of the 5 helices, whereas the base pair changes were restricted to the internal helix regions.
In agreement with Luehrsen and Fox (1981), most of the sequences (Supplementary Figure S5) could be folded into a structure with a total distance between helices I and V of 16 bp separated by a G-U pair. Helix IV maintained the 3 contiguous G-U pairs, loop C was formed by 12 bp, and loop E contained the conserved A-G-U-A motif. Moreover, loop E also presented 2 conserved A, which were preceded by a G in most of the sequences. However, several sequences did not fulfill some of the criteria mentioned above. All the mussel clones belonging to the sβ type, except clone 2, could not be properly folded (see their predicted 5S rRNA structures and ΔG values in Supplementary Figure S5). They presented a transition (T → C) that modified loop B, a mismatch within helix V, and ΔG values as high as −25.5 kcal/mol, probably due to point mutations within ICRs I and II. Otherwise, a clone belonging to Semimytilus algosus (ΔG = −43.0 kcal/mol) did not contain the 2 conserved A preceded by a G within loop E. The clone S. algosus δ2.2 (ΔG = −39.6 kcal/mol) showed a hinge region 6 bp larger compared with the rest of the sequences, and helix I was shorter due to a transition in position 8 within ICR I. Moreover, the distance between helices I and V was 13 bp. Finally, a clone of C. chorus (β degenerated copy; ΔG = −44.3 kcal/mol) could not properly form loops B, C, and E, nor could helix III, due to a deletion in position 47. Furthermore, it presented an insertion in the hinge region that altered the secondary structure and the total length between helices I and V (13 bp).
Figure 6. Predicted consensus secondary structures of cephalopods (A), gastropods (B), bivalves (C), and Mytilidae mussels (D) 5S rRNA. Helices are named with Roman numerals, and letters correspond to loops, following Smirnov et al. (2008). Red indicates that there was only one type of base pair (e.g., GC), and ochre, 2 types of base pairs (e.g., GC
Phylogenetic Analysis of the 5S Region in Mollusks
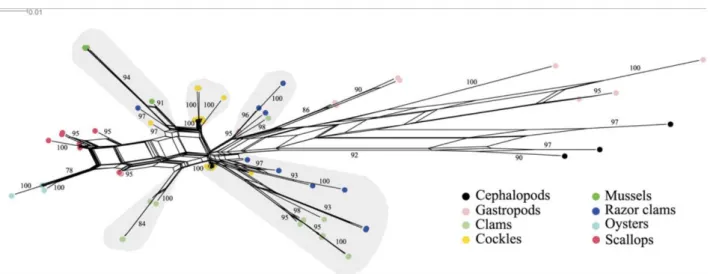
The phylogenetic analysis of the 5S region of several bivalves and some gastropods and cephalopods (Figure 7) showed that sequences clustered according to the class they belong to (Bivalvia, Gastropoda, and Cephalopoda). Nevertheless, within bivalves, 5S sequences from some systematic groups did not cluster together. In the network performed, razor clam sequences were split into 3 different groups, one with sequences from the species Ensiculus cultellus, another one with Siliqua patula and Ensis directus sequences, and the last one with sequences from E. directus, E. macha, E. magnus, E. minor, E. ensis, and Pharus legumen. Similarly, in clams, we distinguished one group with sequences from the species Donax vittatus and D. semiestriatus, another one with Venerupis decussatus, and the last with D. trunculus, V. pullastra, V. aurea, and V. rhomboideus. Finally, cockle sequences clustered in 3 groups, 2 of them represented by the species Cerastoderma edule and C. glaucum, and another containing sequences from only C. edule. Mussel sequences clustered together, the same as oyster sequences. In the case of scallop species, sequences were split into 2 closely related groups in the network, one containing sequences from Mimachlamys varia, Aequipecten opercularis, Pecten maximus, and Chlamys distorta and the other with sequences from the species A. opercularis, P. maximus, and C. distorta.
Figure 7. Phylogenetic network of the 5S rDNA coding region of mollusks. Sequences from the following species were included: gastropods (Aplysiidae: Aplysia kurodai; Helicidae: Helix pomatia; Muricidae: Hexaplex trunculus;
Haliotidae: Haliotis rufescens; Arionidae: Arion rufus), cephalopods (Ommastrephidae: Illex illecebrosus; Spiidae: Sepia officinalis; Octopodidae: Octopus vulgaris), and bivalves. Bivalves species are referred to according to
their common name: mussels (Mytilidae: Mytilus edulis, M. galloprovincialis, M. trossulus, M. californianus, M. coruscus, Semimytilus algosus, Perna canaliculus, Choromytilus chorus, Aulacomya ater, Modiolus capax, Lithophaga
lithophaga), clams (Veneridae: Venerupis pullastra, V. rhomboideus, V. decussates, V. aurea; Donacidae: Donax vittatus, D. semiestratus, D. trunculus; Astartidae: Astarte borealis), cockles (Cardiidae: Cerastoderma glaucum, C.
edule), razor clams (Pharidae: Ensis directus, E. macha, E. magnus, E. siliqua, E. ensis, E. goreensis, E. minor, Ensiculus cultellus, Pharus legumen, Siliqua patula), oysters (Ostreidae: Crassostrea gigas, C. angulata), and
scallops (Pectinidae: Pecten maximus, Chlamys distorta, Mimachlamys varia, Aequipecten opercularis). Genetic distances were calculated using the general time reversible model, and shaded areas denote paralogue groups.
Discussion
Transcriptional Regulatory Regions of Molluskan 5S rDNA
to which upstream elements also change. Basically, type I and type II promoters (e.g., for 5S rDNA and tRNA transcription, respectively) contain ICRs, and it seems that they do not always need specific upstream control elements. However, type III promoters (e.g., U6 snRNA transcription) are characterized by 3 upstream stretches at least: a TATA box, a proximal sequence element, and a distal sequence element. Remarkably, the transcription of type III promoter genes is closely related to the transcription of class II genes (genes transcribed by RNA pol II) due to the fact that these upstream elements can interact with RNA pol II–like transcriptional factors, such as Oct1 and STAF (Paule and White 2000). Interestingly, we identified an upstream putative regulatory region (TATA-like box), in agreement with what was reported for D. melanogaster (Sharp and García 1988), Neurospora crassa (Tyler 1987), Bombyx mori (Morton and Sprague 1984), and several fish species (Martins and Galetti 2001). It has recently been proposed that this region could be involved in RNA pol III transcription together with RNA pol II–like transcriptional factors (Raha et al. 2010). However, it was less conserved in Mytilidae δ type sequences and in razor clam, scallop, and cockle sequences (Table 3). Therefore, this could imply that 1) the 5S rDNA transcription in these molluskan groups could not specifically be regulated by RNA pol II–like transcriptional factors, 2) they could present lower transcriptional activities, or 3) they do not require the same level of sequence specificity. Interestingly, we identified another highly conserved motif in Mytilidae sequences, the AATTTT block. This suggests that it should be involved in the 5S rDNA transcription in this family in some way, and any
modification could mean important transcriptional restrictions. Nevertheless, the block was not conserved in sβ clones or in the other molluskan 5S rDNA sequences. This motif was previously found to be involved in the regulation of rRNA processing genes in Saccharomyces cerevisiae, and it is accepted as a cis-regulatory element of mitochondrial ribosomal protein genes in Candida albicans (Ihmels et al. 2005). Morton and Sprague (1984) also demonstrated the requirement of the AATTTT block for the 5S rDNA transcriptional activity in the silkworm B. mori. We found that this element showed high similarity with an AT-hook from S. cerevisiae (SUM1; ID MA0398.1), which usually serves as docking for high-mobility group proteins that can act as transcriptional factor cofactors (Aravind and Landsman 1998). Therefore, our results suggest that these proteins could play an important role in the transcription of Mytilidae 5S rDNA (e.g., opening the chromatin for transcription). Furthermore, a regulatory upstream element, very common in the eukaryotic genome (Corre and Galibert 2005), was identified within the razor clam lineage in place of the AATTTT block in this study. This motif, the E-box, is a DNA-binding site for basic helix-loop-helix transcription factors (e.g., upstream stimulating factors), some of them involved in the recruitment of chromatin
remodeling enzymes and in the interaction with coactivators and members of the transcription pre-initiation complex of TATA-directed genes transcription (Corre and Galibert 2005). Therefore, in razor clams, this motif could act in a similar way as the AATTTT element. In conclusion, the presence of highly conserved (putative) regulatory elements points to the 3′ end of the NTS region being under the action of selective pressures. In fact, it could happen that specific point mutations within these transcriptional hot spots imply serious transcriptional alterations.
5S rDNA in Mollusks
Intragenomic divergence within 5S rDNA has previously been reported in other mollusks, such as the gastropod Hexaplex trunculus (González-Tizón et al. 2008) and the bivalves Cerastoderma glaucum (Freire et al. 2005), Aequipecten opercularis (López-Piñón et al. 2008), various razor clam species (Vierna et al. 2009), and some Mytilus mussels (Insua et al. 2001; Freire et al. 2010). Nevertheless, this is not restricted to molluskan species because intragenomic divergence within this gene family has also been found in other animals, plants, and fungi (e.g. Danna et al. 1996; Martins and Galetti 2001; Daniels and Delany 2003; Rooney and Ward 2005; Keller et al. 2006; Caradonna et al. 2007; Fujiwara et al. 2009; Baum et al. 2009). Therefore, it seems clear that the action of mechanisms generating intragenomic variation (i.e., gene duplications) is often more powerful than the action of the homogenizing mechanisms (i.e., unequal crossing overs, gene conversions, and selection), and this is more evident for the portions of the NTS region that appear not to be subjected to selection.
The phylogenetic analysis of the 5S region of several molluskan lineages has shown that sequences cluster according to the class they belong to (Bivalvia, Gastropoda, and Cephalopoda). Nevertheless, within bivalves, the clustering pattern of razor clams, clams, cockles, and, to a lesser extent, scallops reveals that some paralogue groups may occur in bivalve species. Paralogue groups of other multicopy genes have been described in metazoans (5S rDNA, Peterson et al. 1980; 18S rDNA, Carranza et al. 1999; spliceosomal genes, Marz et al. 2008). Taking into account that razor clams, clams, and cockles belong to the order Veneroidea, the pattern we observe may be the result of an ancient duplication that has been maintained until the present, perhaps due to positive selection. Remarkably, the occurrence of 2 types of 5S rDNA sequences has been described for several fish species (see Martins and Galetti 2001) and constitutes a conserved character. Nevertheless, it is unclear whether each type is differentially regulated, as in the case of the frog Xenopus, in which oocyte and somatic 5S rDNA types were found to be tissue specific (Peterson et al. 1980).
The Case of Mytilidae Mussels
The analysis of polymorphism in the 5S region within family Mytilidae revealed low variability in contrast to what was reported in the razor clam family Pharidae, in which 32 polymorphic sites were identified (Vierna et al. 2011). Nevertheless, the nucleotide polymorphism could have been somewhat underestimated due to the fact that in some sequences obtained from DDBJ/EMBL/GenBank the primer annealing regions were not provided. As a consequence of the primer design (annealing in the 5S region with opposite orientation), we showed that the copies of Mytilidae 5S rDNA were organized in tandem arrays in all species, in agreement with Insua et al. (2001), who obtained intense 5S rDNA Fluorescence in situ Hybridization spot-signals in Mytilus mussels. However, the occurrence of dispersed 5S rDNA in the genomes of these species cannot be ruled out. Another interesting issue was the unequal GC content observed between the 5S and the NTS regions: the very low GC content of the NTSs contrasted with the high GC content of the internal transcribed spacers (ITS1 and ITS2) of the major ribosomal genes of bivalve species (Insua et al. 2003; Cheng et al. 2006; Vierna et al. 2010). This could be due to the fact that the NTS region is not transcribed or folded into a secondary structure, whereas both ITSs are transcribed and have known secondary structures. Perhaps the high GC content is related to secondary structure stability.
The linkage of 5S rDNA genes with other gene families, such as the trans-spliced leader (Aksoy et al. 1992), histone genes (Eirín-López et al. 2004), and U1 snDNA (Vierna et al. 2011), has been proposed as evidence of the capability of 5S rDNA to move from one location to another in the eukaryote genome. We identified a tRNA-Arg gene linked to a 5S rDNA defective copy of C. chorus. A homologue tRNA has recently been found in the Mytilus species (Freire et al. 2010). Our finding reveals that it is not a species-specific character, and the linkage may be also occurring in the genomes of other species from subfamily Mytilinae.
compared with the Mytilinae, this may imply a loss of 5S rDNA types in their lineage. However, the pattern observed may also be the result of limited sampling.
The 5S rDNA sequences from M. coruscus seemed to be the most divergent ones within Mytilus species. However, Martínez-Lage et al. (2005) suggested that M. californianus is the most divergent species within the genus according to satellite DNA. Other studies supported this idea, even though they did not include M. coruscus (Kenchington et al. 1995; Distel 2000; Eirín-López et al. 2002).
According to Cox et al. (1969), family Mytilidae and subfamily Modiolinae originated in the Early Devonian, whereas subfamily Lithophaginae originated in the Early Permian, and Mytilinae, in the Early Triassic. This would imply that the δ type is the oldest one, as it is shared by Modiolinae and Mytilinae species and should date back to the Early Devonian (in this period, the Modiolinae and the Mytilinae were already split in different lineages). In the same way, the α type predates the Early Permian, as in this period, Lithophaginae and Mytilinae should have already been different lineages. Finally, the β type seems to be the most recent, as its origin should predate the split of the Mytilinae lineages (approximately during the Early Eocene). However, we should also be cautious here regarding possible sampling limitations.
As explained above, a remarkable number of surveys reported high intragenomic divergence within 5S rDNA in mollusks, but only a few studies explained it in the light of a birth-and-death evolutionary scenario. The idea of birth-and-death as the main force driving 5S rDNA molecular evolution was reinforced by the presence of pseudogenes, according to the remarks proposed by Rooney and Ward (2005). Despite its low polymorphism, the mutations observed in the 5S region led us to evaluate the presence of pseudogenes according to 5S rRNA predictions following Harpke and Peterson (2008). So, it is now clear that the long-term evolution of Mytilidae 5S rDNA has been driven by birth-and-death processes, which are responsible for the variation detected. However, homogenizing mechanisms may have probably been taking part too. Some species showed a high degree of intraspecific homogenization (e.g., M. trossulus, and M. galloprovincialis α and β clones; M. californianus β clones, and S. algosus and M. coruscus δ clones). In this sense, the α and β phylogenies revealed a lack of interspecific admixture between M. trossulus and the other species of the M. edulis complex. However, hybrids of M. edulis × trossulus and M. galloprovincialis × trossulus have been reported to occur off American coasts (Rawson et al. 1999; Toro et al. 2002), indicating that they must have diverged recently. There are 3 possible explanations for this observation: 1) different loci were homogenized by unequal crossovers, gene conversions, and/or purifying selection (in the functional regions); 2) the sequences obtained were organized in different loci formed by a recent duplication event (in the cases in which rapid gene turnover occurs, in the phylogenetic tree we can observe species-specific gene clusters), or 3) the sequences were allelic copies of the same locus (less likely).
Conclusions
characterized within β and δ sequences; and 6) birth-and-death processes are the main force driving the long-term evolution of 5S rDNA in family Mytilidae (since the Early Ordovician, 480–470 million years ago), in agreement with what has recently been found for Mytilus species and the razor clam family Pharidae.
We thank Fernanda Rodríguez, Luis Mariñas, and Francisca Ramírez for providing us with M. trossulus, L. lithophaga, and S. algosus samples, and Manja Marz and Marcus Lechner for their support during bioinformatic analyses. Thanks are also due to Doug Turner, who helped to improve the use of the RNAstructure program. M.V. was supported by a collaboration fellowship and J.V. by a “María Barbeito” fellowship, both from Xunta de Galicia (Spain). The authors declare no conflict of interests.
Acknowledgments
We thank Fernanda Rodríguez, Luis Mariñas, and Francisca Ramírez for providing us with M. trossulus, L. lithophaga, and S. algosus samples, and Manja Marz and Marcus Lechner for their support during bioinformatic analyses. Thanks are also due to Doug Turner, who helped to improve the use of the RNAstructure program. M.V. was supported by a collaboration fellowship and J.V. by a "María Barbeito" fellowship, both from Xunta de Galicia (Spain). The authors declare no conflict of interests.
References
Aerts S, Thijs G, Coessens B, Staes M, Moreau Y, De Moor B. 2003. ‘–TOUCAN: deciphering the cis-Regulatory logic of coregulated genes’. Nucl Acids Res. 31:1753–1764.
Aksoy S, Shay GL, Villanueva MS, Beard CB, Richards FF. 1992. Spliced leader RNA sequences of Trypanosoma rangeli are organized within the 5S rRNA-encoding genes. Gene. 113:229–243.
Altschul SF, Gish W, Miller W, Myers EW, Lipman DJ. 1990. Basic local alignment search tool. J Mol Biol. 215:403–410.
Aravind L, Landsman D. 1998. AT-hook motifs identified in a wide variety of DNA-binding proteins. Nucleic Acids Res. 19:4413–4421.
Arnheim N. 1983. Concerted evolution of multigene families. In: Nei M, Koehn RK, editors. Evolution of genes and proteins. Sunderland (MA): Sinauer Associates. p. 38–61.
Baum BR, Edwards T, Johnson DA. 2009. Phylogenetic relationships among diploid Aegilops species inferred from 5S rDNA units. Mol Phylogenet Evol. 53:34–44.
Brown DD, Wensink PC, Jordan E. 1972. Xenopus laevis and Xenopus mulleri: the evolution of tandem genes. J Mol Biol. 63:57–73.
Bryant D, Moulton V. 2004. Neighbor-net: an agglomerative method for the construction of phylogenetic networks. Mol Biol Evol. 21:255–265.
Campbell FE Jr., Setzer DR. 1992. Transcription termination by RNA polymerase III: uncoupling of polymerase release from termination signal recognition. Mol Cell Biol. 12:2260–2272.
Carranza S, Baguna J, Riutort M. 1999. Origin and evolution of paralogous rRNA gene clusters within the flatworm family Dugesiidae (Platyhelminthes, Tricladida). J Mol Evol. 49:250–259.
Castresana J. 2000. Selection of conserved blocks from multiple alignments for their use in phylogenetic analysis. Mol Biol Evol. 17:540–552.
Challice JM, Segall J. 1989. Transcription of the 5s rRNA gene of Saccharomyces cerevisiae requires a promoter element at þ 1 and a 14-base pair internal control region. J Biol Chem. 264:20060–20067.
Cheng HL, Xia DQ, Wu TT, Meng XP, Ji HJ, Dong ZG. 2006. Study on sequences of ribosomal DNA internal transcribed spacers of clams belonging to the Veneridae family (Mollusca: Bivalvia). Acta Genetica Sin. 33:702–710.
Corre S, Galibert MD. 2005. Upstream stimulating factors: highly versatile stress-responsive transcription factors. Pigment Cell Res. 18:337–348.
Cox LR, Newell ND, Branson CC, Casey R, Chavan A, Coogan AH, Dechaseaux C, Fleming CA, Haas F, Hertlein LG, et al. 1969. Systematic description. In: Moore RC, Teichert C, editors. Treatise on invertebrate paleontology, Part N. Vol. 1. Lawrence (KS): University Kansas and Geological Society of America Inc. p. N225–N489.
Cross I, Rebordinos L. 2005. 5S rDNA and U2 snRNA are linked in the genome of Crassostrea angulata and Crassostrea gigas oysters: does the (CT)n. (GA)n microsatellite stabilize this novel linkage of large tandem arrays? Genome. 48:1116–1119.
Danna KJ, Workman R, Coryell V, Keim P. 1996. 5S rRNA genes in tribe Phaseoleae: array size, number, and dynamics. Genome. 39:445–455.
Daniels LM, Delany ME. 2003. Molecular and cytogenetic organization of the 5S ribosomal DNA array in chicken (Gallus gallus). Chromosome Res. 11:305–317.
Distel DL. 2000. Phylogenetic relationships among Mytilidae (Bivalvia): 18S rRNA data suggest convergence in Mytilid body plans. Mol Phylogenet Evol. 15:25–33.
Dover GA. 1982. Molecular drive: a cohesive mode of species evolution. Nature. 299:111–117.
Dover GA, Tautz. 1986. Conservation and divergence in multigene families: alternatives to selection and drift. Philos Trans R Soc Lond B Biol Sci. 312:275–289.
Eickbush TH, Eickbush DG. 2007. Finely orchestrated movements: evolution of the ribosomal RNA genes. Genetics. 175:477–485.
Eirín-López JM, Fernanda Ruiz M, González-Tizón AM, Martínez A, Sánchez L, Méndez J. 2004. Molecular evolutionary characterization of the mussel Mytilus histone multigene family: first record of a tandemly repeated unit of five histone genes containing an H1 subtype with "orphon" features. J Mol Evol. 58:131–144.
Eirín-López JM, González-Tizón AM, Martínez A, Méndez J. 2002. Molecular and evolutionary analysis of mussel histone genes (Mytilus spp): possible evidence of an "orphon origin" for H1 histone genes. J Mol Evol. 55:272–283.
Fedonkin MA, Waggoner BM. 1997. The Late Precambrian fossil Kimberella is a mollusc-like bilaterian organism. Nature. 388:868–871.
Felgenhauer P, Sedman J, Shostak N, Timofeeva M, Lind A, Bayev A. 1990. The 5’-flanking sequence of the loach oocyte 5s rRNA genes contains a signal for effective transcription. Gene. 90:242–248.
Fernández-Tajes J, Méndez J. 2009. Two different size classes of 5S rDNA units coexisting in the same tandem array in the razor clam Ensis macha: is this region suitable for phylogeographic studies? Biochem Genet. 47:775–788.
Freire R, Arias A, Insua A, Méndez J, Eirín-López JM. 2010. Evolutionary dynamics of the 5S rDNA gene family in the mussel Mytilus: mixed effects of birth-and-death and concerted evolution. J Mol Evol. 70:413– 426.
Freire R, Insua A, Méndez J. 2005. Cerastoderma glaucum 5S ribosomal DNA: characterization of the repeat unit, divergence with respect to Cerastoderma edule, and PCR-RFLPs for the identification of both cockles. Genome. 48:427–442.
Fujiwara M, Inafuku J, Takeda A, Watanabe A, Fujiwara A, Kohno S, Kubota S. 2009. Molecular organization of 5S rRNA in bitterlings (Cyprinidae). Genetica. 135:355–565.
González-Tizón AM, Fernández-Moreno M, Vasconcelos P, Gaspar MB, Martínez-Lage A. 2008. Genetic diversity in fishery-exploited populations of the banded murex (Hexaplex trunculus) from the southern Iberian Peninsula. J Exp Mar Biol Ecol. 363:35–41.
Hall TA. 1999. BioEdit: a user-friendly biological sequence alignment editor and analysis program for windows 95/98/NT. Nucleic Acids Symp Ser. 41:95–98.
Hammond MC, Wachter A, Breaker RR. 2009. A plant 5S ribosomal RNA mimic regulates alternative splicing of transcription factor IIIA premRNAs. Nat Struct Mol Biol. 16:541–549.
Harpke D, Peterson A. 2008. Extensive 5.8S nrDNA polymorphism in Mammillaria (Cactaceae) with special reference to the identification of pseudogenic internal transcribed spacer regions. J Plant Res. 121:261–270.
Hendriks L, De Baere R, Vandenberghe A, De Wachter R. 1987. The nucleotide sequence of the 5S ribosomal RNA of Actinia equina and Sepia officinalis. Nucleic Acids Res. 15:2773.
Hofacker IL. 2003. Vienna RNA secondary structure server. Nucleic Acids Res. 31:3429–3431.
Huson DH, Bryant D. 2006. Application of phylogenetic networks in evolutionary studies. Mol Biol Evol. 23:254–267.
Ihmels J, Bergmann S, Gerami-Nejad M, Yanai I, McClellan M, Berman J, Barkai N. 2005. Rewiring of the yeast transcriptional network through the evolution of motif usage. Science. 309:938–940.
Insua A, Freire R, Méndez J. 1999. The 5S rDNA of the bivalve Cerastoderma edule: nucleotide sequence of the repeat unit and chromosomal location relative to 18S–28S rDNA. Genet Sel Evol. 31:509–518.
Insua A, Freire R, Rios J, Méndez J. 2001. The 5S rDNA of mussels Mytilus galloprovincialis and M. edulis: sequence variation and chromosomal location. Chromosome Res. 9:495–505.
Keller I, Chintauan-Marquier IC, Veltsos P, Nichols RA. 2006. Ribosomal DNA in the grasshopper Podisma pedestris: escape from concerted evolution. Genetics. 174:863–874.
Kenchington E, Landry D, Bird CJ. 1995. Comparison of taxa of the mussel Mytilus (Bivalvia) by analysis of the nuclear small-subunit rRNA gene sequence. Can J Fish Aquat Sci. 52:2613–2620.
Kohany O, Gentles AJ, Hankus L, Jurka J. 2006. Annotation, submission and screening of repetitive elements in Repbase: RepbaseSubmitter and Censor. Bioinformatics. 7:474.
Komiya H, Hasegawa M, Takemura S. 1986. Differentiation of oocyte- and somatic-type 5S rRNAs in animals. J Biochem. 100:369–374.
Larkin MA, Blackshields G, Brown NP, et al. 2007. Clustal W and Clustal X version 20. Bioinformatics. 23:2947–2948.
Leal-Klevezas DS, Martinez-Soriano JP, Nazar RN. 2000. Cotranscription of 5S rRNA-tRNA(Arg)(ACG) from Brassica napus chloroplasts and processing of their intergenic spacer. Gene. 253:303–311.
Li WH. 1997. Molecular evolution. Sunderland (MA): Sinauer Associates.
Librado P, Rozas J. 2009. DnaSP v5: a software for comprehensive analysis of DNA polymorphism data. Bioinformatics. 25:1451–1452.
Little RD, Braaten BC. 1989. Genomic organization of human 5S rDNA and sequence of one tandem repeat. Genomics. 4:376–383.
López-Piñón MJ, Freire R, Insua A, Méndez J. 2008. Sequence characterization and phylogenetic analysis of the 5S ribosomal DNA in some scallops (bivalvia: Pectinidae). Hereditas. 145:9–19.
Lowe TM, Eddy SR. 1997. tRNAscan-SE: a program for improved detection of transfer RNA genes in genomic sequence. Nucl Acids Res. 25:955–964.
Luehrsen KR, Fox GE. 1981. Secondary structure of eukaryotic cytoplasmic 5S ribosomal RNA. Proc Natl Acad Sci U S A. 78:2150–2154.
Martínez-Lage A, Rodríguez-Fariña F, González-Tizón AM, Méndez J. 2005. Origin and evolution of Mytilus mussel satellite DNAs. Genome. 48:247–256.
Martins C, Galetti PM. 2001. Two 5S rDNA arrays in Neotropical fish species: is it a general rule for fishes? Genetica. 111:439–446.
Marz M, Kirsten T, Stadler PF. 2008. Evolution of spliceosomal snRNA genes in metazoan animals. J Mol Evol. 67:594–607.
Mathews DH, Sabina J, Zuker M, Turner DH. 1999. Expanded sequence dependence of thermodynamic parameters improves prediction of RNA secondary structure. J Mol Biol. 288:911–940.
Menlove KJ, Clement M, Crandall KA. 2009. Similarity searching using BLAST. In: Posada D, editor. Bioinformatics for DNA sequence analysis (methods in molecular biology). New York: Humana Press. p. 1– 22.
Nei M, Rooney AP. 2005. Concerted and birth-and-death evolution of multigene families. Annu Rev Genet. 39:121–152.
Nelson DW, Linning RM, Davison PJ, Honda BM. 1998. 5´-flanking sequences required for efficient transcription in vitro of 5S RNA genes, in the related nematodes Caenorhabditis elegans and Caenorhabditis briggsae. Gene. 218:9–16.
Nielson JN, Hallenburg C, Frederiksen S, Sørensen PD, Lombolt B. 1993. Transcription of human 5S rRNA genes is influenced by an upstream DNA sequence. Nucleic Acids Res. 21:3631–3636.
Oei S-L, Pieler T. 1990. A transcription stimulatory factor binds to the upstream region of Xenopus 5s RNA and tRNA genes. J Biol Chem. 265:7485–7491.
Ota T, Nei M. 1994. Divergent evolution and evolution by the birth-anddeath process in the inmunoglobulin VH gene family. Mol Biol Evol. 7:491–514.
Paule MR, White RJ. 2000. Survey and summary: transcription by polymerase I and III. Nucleic Acids Res. 28:1283–1298.
Pearson WR, Wood TC. 2001. Statistical significance in biological sequence comparison. In: Balding DJ, Bishop M, Cannings C, editors. Handbook of statistical genetics. Chichester (UK): Wiley. p. 39–66.
Peterson RC, Doering JL, Brown DD. 1980. Characterization of two Xenopus somatic 5S-DNAs and one minor oocyte-specific 5S-DNA. Cell. 20:131–141.
Pieler T, Hamm J, Roeder RG. 1987. The 5S gene internal control region is composed of three distinct sequence elements, organized as two functional domains with variable spacing. Cell. 48:91–100.
Posada D. 2008. jModelTest: phylogenetic model averaging. Mol Biol Evol. 25:1253–1256.
Raha D, Wang Z, Moqtaderi Z, Wu L, Zhong G, Gerstein M, Struhl K, Snyder M. 2010. Close association of RNA polymerase II and many transcription factors with Pol III genes. Proc Natl Aacd Sci U S A. 107:3639– 3644.
Rawson PD, Agrawal V, Hilbish TJ. 1999. Hybridization between the blue mussels Mytilus galloprovincialis and M. trossulus along the Pacific coast of North America: evidence for limited introgression. Mar Biol. 134:201–211.
Reuter JS, Mathews DH. 2010. RNAstructure: software for RNA secondary structure prediction and analysis. BMC Bioinformatics. 11:129.
Reynolds WF, Azer K. 1988. Sequence differences upstream of the promoters are involved in the differential expression of the Xenopus somatic and oocyte 5S RNA genes. Nucleic Acids Res. 16:3391–3403.
Rooney AP, Ward TJ. 2005. Evolution of large ribosomal RNA multigene family in filamentous fungi: birth-and-death of a concerted evolution paradigm. Proc Natl Acad Sci U S A. 102:5084–5098.
Sharp SJ, García AD. 1988. Transcription of the Drosophila melanogaster 5S RNA gene requires an upstream promoter and four intragenic sequences elements. Mol Cell Biol. 8:1266–1274.
Shippen-Lentza DE, Vezza AC. 1988. The three 5S rRNA genes from the human malaria parasite Plasmodium falciparum are linked. Mol Biochem Parasit. 27:263–273.
Sun FJ, Caetano-Anolle´s G. 2009. The evolutionary history of the structure of 5S ribosomal RNA. J Mol Evol. 69:430–443.
Swofford DL. 2002. PAUP*: phylogenetic analysis using parsimony (and other methods) 4.0 Beta. Sunderland (MA): Sinauer Associates.
Tatusova TA, Madden TL. 1999. Blast2 sequences, a new tool for comparing protein and nucleotide sequences. FEMS Microbiol Lett. 174:247–250.
Toro JE, Thompson RJ, Innes DJ. 2002. Reproductive isolation and reproductive output in two sympatric mussel species (Mytilus edulis, M. trossulus) and their hybrids from Newfoundland. Mar Biol. 141:897–909.
Tyler BM. 1987. Transcription of Neurospora crassa 5s rRNA genes requires a TATA Box and three internal elements. J Mol Biol. 196:801–811.
Vierna J, Jensen KT, Martínez-Lage A, González-Tizón AM. 2011. The linked units of 5S rDNA and U1 snDNA of razor shells (Mollusca: Bivalvia: Pharidae). Heredity. doi:10.1038/hdy.2010.17.
Vierna J, Martínez-Lage A, González-Tizón AM. 2009. Long-term evolution of 5S ribosomal DNA seems to be driven by birth-and-death processes and selection in Ensis razor shells (Mollusca: Bivalvia). Biochem Genet. 47:635–644.
Vierna J, Martínez-Lage A, González-Tizón AM. 2010. Analysis of ITS1 and ITS2 sequences in Ensis razor shells: suitability as molecular markers at the population and species levels, and evolution of these ribosomal DNA spacers. Genome. 53:23–34.
Walker WF, Doolittle WF. 1983. 5S rRNA sequences from four marine invertebrates and implications for base pairing models of metazoan sequences. Nucleic Acids Res. 11:5159–5164.
Wood V, Gwilliam R, Rajandream MA, Lyne M, Lyne R, Stewart A, Sgouros J, Peat N, Hayles J, Baker S, et al. 2002. The genome sequence of Schizosaccharomyces pombe. Nature. 415:871–880.