Development of a hybrid ejector compressor refrigeration system with improved efficiency
187
0
0
Texto completo
(2) INSTITUTO TECNOLOGICO Y DE ESTUDIOS SUPERIORES DE MONTERREY CAMPUS MONTERREY. Development of a hybrid ejector-cempressor refrigeration system with improved ef ficiency. Alejandro Gutiérrez Ortiz. A thesís presented for the degree of Doctor of Philosophy in Engineering Science. School of Ejigineering and Information Technologies Gradúate Programs Monterrey, México May 2 0 N.
(3) Instituto Tecnológico y de Estudios Superiores de Monterrey Campus Monterrey. Development of a hybrid ejector-compressor refrigeration system w i t h improved efficiency. Alejandro Gutiérrez Ortiz. A thesis presented for the degree of Doctor of Philosophy in Engineering Science. School of Engineering and Information Technologies Gradúate Programs Monterrey, México M a y 2014.
(4) Instituto Tecnológico y de Estudios Superiores de Monterrey Campus Monterrey School of Engineering and Information Technologies Gradúate Programs The committee members hereby recommend the dissertation proposal presented by Alejandro Gutiérrez Ortiz to be accepted as a partial fulfillment of the requirements for the degree of Doctor of Philosophy in Engineering Science. Dissertation Committee:. Monterrey, México May 2014.
(5) Acknowledgements This research w o r k cannot be considered as the product of an individual effort, therefore I would like to express my gratitude to the following people that made all of this possible. To my advisor D r . Noel León, the trust that y o u have placed in me allowed me to grow as a research scientist. To my external advisor D r . Jorge I . H e r n á n d e z , y o u always went beyond your line of duty to assist and oversee my research efforts, and by doing so y o u made me realize of the importance of collaboration and communication in scientific research. To D r . M i k e Dennis, for y o u r unconditional support and advice during my research stay at the Australian National University. To my committee members, D r . Alejandro J . García, D r . Carlos Rivera, D r . M a r t i n H . Bremer and D r . Humberto Aguayo, for all y o u r invaluable feedback and suggestions. I must also acknowledge the previous w o r k done by all the researchers in the field of ejectors, in the words of the French philosopher Bernard of Chartres, T f I have seen further it is by standing on the shoulders of giants". I w o u l d like to extend my gratitude to all of my friends and colleagues, for all the irreplaceable moments that we shared during the last four years of this endeavor. A special thanks to my parents, for blindly trusting in me when I decided to take this venture, to my brother and sister who incented me to strive towards my goal, to my mother-in law, father-in-law, and brother-in-law, for entrusting me w i t h the part that, up until a year ago was missing from my life, my beloved wife Elena, words cannot express how grateful I am for finding you, only your love helped me overeóme those times when I did not think I could continué.. Un agradecimiento especial a mis padres, por confiar ciegamente en mí cuando. decidí. aventurarme en este largo proceso, a mi hermano y hermana que me incentivaron para alcanzar mi meta, a mis suegros y mi cuñado, por confiarme la parte que hasta hace solo un año le faltaba a mi vida, mi amada esposa Elena, las palabras no pueden expresar lo agradecido que estoy por haberte encontrado, solo tu amor me ayudó a superar esos momentos en los que creí no poder continuar..
(6) Abstract The present doctoral dissertation addresses the design of an ejector suitable for a thermally driven hybrid ejector-compressor cooling system; research was aimed at improving the performance of the ejector in terms of both critical backpressure and entrainment ratio. A n ejector efficiency analysis is presented to establish a theoretical limit for the m á x i m u m achievable entrainment ratio of an ejector undergoing a fully reversible process without entropy generation; the main sources of irreversibility w i t h i n the ejector are subsequently discussed. The shock circle model is implemented as a mean to predict the entrainment ratio for an ejector w i t h a given set of nozzle and constant á r e a section diameters; experimental results from the literature are presented and used to valídate the model. A Computational Fluid Dynamics design exploration aimed at identifying the effects of the rest of the key geometrical parameters that are not covered by the mathematical model is also presented.. In order to generalize the findings from this. study for ejectors of different scales, the results are presented using non-dimensional parameters. The study showed that in order to guarantee a critical mode operation at the range of operating conditions suitable for a hybrid ejector-compressor cycle, only the constant á r e a section or the nozzle throat diameters need to vary accordingly w i t h the condenser backpressure. The optimum geometrical parameters found by the design exploration are used to propose an optimized ejector design, the Constant Rate of Momentum Change method is also implemented to genérate a diffuser geometry that reduces one of the sources of entropy generation identified during the first stages of this research. The assessment of the performance increase for the proposed ejector is measured against a baseline design; the results showed that the new ejector outperforms the baseline in terms of both entrainment ratio and critical condenser backpressure. The thesis concludes w i t h a study to quantify the thermal efficiency increase of a hybrid ejector-compressor system employing the proposed ejector, lastly, the design for a test stand to experimentally verify the findings of this research w o r k is proposed.. i.
(7) Table of Contents Abstract. i. Table of Contents. ü. List of Tables. v. L i s t of Figures. vi l x. Nomenclature Chapter 1 Introduction 1.1 Traditional ejector refrigeration cycle 1.2 Ejectors w o r k i n g principie 1.3 Enhanced ejector refrigeration cycle 1.4 Hypothesis 1.5 General objective 1.6 Specific objectives 1.7 Thesis structure. 1 2 5 6 8 8 9 9. Chapter 2 Literature Review 2.1 Thermodynamic modeling of the ejector 2.2 Computational fluid dynamics analysis 2.3 Variable-geometry ejectors 2.4 High-efficiency ejectors 2.5 Enhanced ejector refrigeration cycles 2.6 Experimental installations 2.7 Summary. 11 11 13 16 18 19 20 22. Chapter 3 Ejector Effíciency Analysis 3.1 Reversible ejector entrainment ratio 3.2 Ejector irreversibilities 3.3 Summary. 25 25 36 38. Chapter 4 One-Dimensional Ejector Model 4.1 Shock circle model governing equations 4.2 Solution procedure 4.3 Validation 4.4 Simplifíed model. ii. 39 39 47 47 48.
(8) 4.5 Summary. 52. Chapter 5 Computational Fluid Dynamics Analysis 5.1 Ejector geometry 5.2 Modeled geometry and grid discretization 5.3 Boundary conditions 5.4 Thermodynamic properties of the refrigerant 5.5 Turbulence modeling, solver type and other considerations 5.6 Validation 5.6.1 One-dimensional analysis validation 5.6.2 Validation w i t h available data from the literature 5.7 Design exploration 5.7.1 Constant á r e a section length 5.7.2 Constant á r e a section diameter 5.7.3 Nozzle exit position 5.7.4 Nozzle throat diameter 5.8 Summary. 53 54 56 57 59 63 64 64 66 72 75 80 83 86 89. Chapter 6 Proposed Design 6.1 Identified optimum geometrical parameters 6.2 Diffuser design 6.3 Results 6.4 H y b r i d ejector-compressor cooling cycle performance assessment 6.5 Summary. 91 91 95 100 105 113. Chapter 7 Conclusions and Recommendations 7.1 Conclusions 7.2 Theoretical study recommendations 7.3 Experimental study recommendations Appendix A: Experimental Setup A . l System layout A.2 Component selection A.2.1 Mechanical compression unit A.2.2 Intercooler A.2.3 Water chiller A.2.4 3-way valves A.2.5 Pressure sensors A.2.6 Temperature sensors A.2.7 Data acquisition card A.2.8 Power meter A.3 Current built status. ,. 115 115 117 117 119 119 122 122 123 124 124 124 125 125 126 126. iii.
(9) Appendix B : Developed E E S code B . l Reversible entrainment ratio code B . l . l Reversible entrainment ratio results B.2 Shock circle model code B.2.1 Shock circle model results B.3 Simplified model code B.3.1 Simplified model results B.4 Primary nozzle isentropic flow model code B.5 C R M C method code B.5.1 C R M C method results. 129 129 130 132 134 135 136 137 138 140. Bibliography. 142. iv.
(10) List of Tables Table 2.1 Effects of the geometric and operating parameters of the ejector 15 Table 3.1 Primary nozzle and constant área section dimensions from Huang 30 Table 3.2 Experimental results from Huang 31 Table 5.1 Ejector design rules 54 Table 5.2 Basic properties of R141b 59 Table 5.3 Coefficient valúes for the piecewise polynomial temperature dependent R141b property functions 62 Table 5.4 Experimental and C F D data validation 68 Table 5.5 Non-dimensional parameters definition 73 Table 5.6 Tested CAS length valúes for the variable condenser backpressure study 76 Table 5.7 Tested CAS diameter valúes 80 Table 5.8 Tested N X P valúes 83 Table 5.9 Tested nozzle throat diameter valúes 86 Appendix Appendix Appendix Appendix. Table Table Table Table. B.l B.2 B.3 B.4. Calculated A G ejector A G ejector Calculated. R E R Effíciency for Huang (1998) data shock circle model predicted entrainment ratio... simplified model predicted entrainment ratio diffuser radius for the proposed design. v. 130 134 136 140.
(11) List of Figures Figure 1.1 Ejector based refrigeration cycle and its corresponding P-h diagram 3 Figure 1.2 Operational modes of the ejector 4 Figure 1.3 Schematic diagram of a constant-pressure mixing ejector 6 Figure 1.4 Booster assisted ejector cycle 7 Figure 1.5 H y b r i d ejector-compressor cycle 8 Figure 2.1 Timeline o f some of the most influential ejector thermodynamic models .12 Figure 2.2 Schematic of the mixing process proposed by Huang (1998) 13 Figure 2.3 Schematic of the geometrical parameters of the ejector 14 Figure 2.4 Schematic o f the primary nozzle needle valve 17 Figure 2.5 Schematic of a movable primary nozzle mechanism 18 Figure 3.1 Control volume of an ejector process 26 Figure 3.2 Diagram of a thermodynamically reversible ejector 26 Figure 3.3 Calculated R E R effíciency for the experimental data of Huang (1998) (Tg= 78 °C) 32 Figure 3.4 Calculated R E R effíciency for the experimental data of Huang (1998) (Tg= 84 °C) 33 Figure 3.5 Calculated reversible R E R for the experimental data of Huang (1998) (Tg= 90 °C) 33 Figure 3.6 Calculated R E R effíciency for the experimental data of Huang (1998) (Tg= 95 °C) 34 Figure 3.7 R E R versus condenser temperature for several evaporator temperature conditions (R141b / Tg= 80 °C) 35 Figure 3.8 R E R versus generator temperature for several condenser temperature conditions (R141b / Te= 15 °C) 36 Figure 3.9 Ejector irreversibility sources 37 Figure 4.1 Primary nozzle schematic showing the shock circle model variables 41 Figure 4.2 M i x i n g chamber and constant área section schematic showing the shock circle model variables 43 Figure 4.3 Cross-sectional view of the ejector's mixing región 44 Figure 4.4 Velocity distribution at section A - A 44 Figure 4.5 Shock circle model solution procedure 47 Figure 4.6 Predicted E R for the A G ejector versus experimental data 48 Figure 4.7 Simplified model solution procedure 50 Figure 4.8 Predicted entrainment ratio for the A G ejector for both the simplified and the shock circle model versus experimental data 50 Figure 4.9 Simplified model primary nozzle throat radius versus generator temperature 51 Figure 5.1 Schematic of the ejector showing the design rules employed 55 Figure 5.2 A G ejector dimensions 55. vi.
(12) Figure 5.3 Ejector axisymmetric model 56 Figure 5.4 Detail of the element density used for the axisymmetric model 57 Figure 5.5 Schematic of the imposed ejector boundary conditions 58 Figure 5.6 Thermodynamic properties of R141b 60 Figure 5.7 C F D validation procedure followed in the study 64 Figure 5.8 Primary nozzle Mach number and pressure pro files 66 Figure 5.9 Ejector modeled w i t h 3 D periodic symmetry 67 Figure 5.10 Comparison between the different tested C F D models and the data presented by Rusly (2004) 68 Figure 5.11 C F D E R for the A G ejector versus the experimental data 69 Figure 5.12 Baseline case Mach contour plot 70 Figure 5.13 Baseline case pressure contour plot 70 Figure 5.14 Base case primary and secondary flows velocity plot 71 Figure 5.15 Baseline case Mach contour plot for the 3 D model 72 Figure 5.16 Schematic of the parameters included variable geometry study 73 Figure 5.17 A N S Y S simulation block procedure employed for the study 74 Figure 5.18 Mach number contour plots for the CAS length ratio study at constant operating conditions 75 Figure 5.19 Results for the CAS length ratio effect for a fixed set of operating conditions 76 Figure 5.20 Results for the CAS Length ratio effect for several condenser backpressures 77 Figure 5.21 M a c h number comparison between ejector operational modes 78 Figure 5.22 Velocity and pressure plot comparison between ejector operational modes 79 Figure 5.23 Results for the área ratio (varying the CAS diameter) effect for a fixed set of operating conditions 80 Figure 5.24 Results for the área ratio (varying the CAS diameter) effect for several condenser backpressures 81 Figure 5.25 Mach number comparison between two different á r e a ratios 82 Figure 5.26 Velocity and pressure plot comparison between two different á r e a ratios operating at critical mode 83 Figure 5.27 M a c h number contour plots for the N X P ratio study at critical mode .. 84 Figure 5.28 Velocity and pressure plot comparison between two N X P ratios 85 Figure 5.29 Results for the N X P ratio effect for several condenser backpressures.. 86 Figure 5.30 Results for the á r e a ratio (with a variable nozzle throat diameter) effect for several condenser backpressures 87 Figure 5.31 M a c h number comparison between two different á r e a ratios 88 Figure 5.32 Velocity and pressure plot comparison between two á r e a ratios 89 Figure 6.1 Fitted surface for the á r e a ratio and condenser temperature versus entrainment ratio results 93 Figure 6.2 Variable nozzle throat diameter results at critical mode 94 Figure 6.3 Variable constant área section diameter results at critical mode 94 Figure 6.4 Cooling load and C O P results for the variable área ratio study 95. vii.
(13) Figure 6.5 C R M C method solution procedure 98 Figure 6.6 Comparison between the original and the C R M C diffuser designs 99 Figure 6.7 M a c h number contour plot comparison between the baseline and the proposed ejector 100 Figure 6.8 Entrainment ratio results comparison for the baseline and the proposed ejector 101 Figure 6.9 Velocity plot comparison of the baseline and the proposed ejector 102 Figure 6.10 Secondary flow pressure plot comparison between the baseline and the proposed ejector 103 Figure 6.11 Contours of entropy generation rate for the baseline and the proposed ejector at shock position 104 Figure 6.12 Entrainment ratio results for the proposed design w i t h different á r e a ratios 105 Figure 6.13 H y b r i d ejector-compressor cycle 106 Figure 6.14 Pressure-enthalpy diagram for the hybrid ejector-compressor cycle....107 Figure 6.15 Pressure-enthalpy diagram for the conventional vapor compression system 108 Figure 6.16 Pressure-enthalpy diagram for the vapor compression subsystem w i t h a lowered condenser temperature 108 Figure 6.17 C O P results for the ejector sub-cycle using the proposed design 110 Figure 6.18 H y b r i d cycle C O P and generator heat input results 111 Figure 6.19 H y b r i d cycle required collector á r e a results 112 Figure A. 1 Schematic o f the proposed experimental setup 120 Figure A.2 Condenser operation modes 121 Figure. A.3 Schematic of the proposed phase 1 experimental setup 122 Figure A.4 Selected 4 k W split unit model 4 M X W 8 5 1 123 Figure A.5 Selected compact píate heat exchanger model SB1-10 123 Figure A.6 Selected pressure transducers model P220 125 Figure A.7 Selected temperature sensors R T D PT100 125 Figure A.8 Selected 8-channel data acquisition card model U S B - T E M P 126 Figure A.9 Power meter model WattsUp . N E T 126 Figure A . 10 Phase 1 current build state 127 Figure A . l 1 Detail of the installed 3-way valve and intercooler 127 Figure A. 12 Detail of the installed chiller and 1,000 liter water tank 128. viii.
(14) Nomenclature 3. V. Specific volume, m kg"'. Area ratio. n. Compression ratio. CAS. Constant Area Section. p. Density, kg m. COP. Coefficient of Performance. o. A. Area, m. AR. 2. Specific heat of gas at constant. c. P. 1. pressure, k J kg" K. V. 1. Specific heat of gas at constant. c. v. D. 1. volume, k J kg' K" Diameter, m. Solar irradiation, W m". 2. h k. Thermal conductivity, W m" K". L. Length, m. Enthalpy, k J kg". 1. 1. Mass flow rate, kg s". M. Mach number. NXP. 1. Q. Heat flow rate, W 1. Specific gas constant, k J kg" K". R s. a. Ambient. A. Section A - A. c. Condenser. crit. Nozzle Exit Position, m Pressure, Pa. 1. Entropy, k J kg K. Isentropic efficiency coefficient. Primary nozzle exit. e. P. efficiency. 1. co comp. 1. m. Reversible entrainment ratio. Subscripts. 1. Energy loss, J G. 3. 1. 1. Solar collector Mechanical compressor Critical Evaporator. eA ejec. Secondary flow at section A - A. exit. Ejector discharge. Ejector subsystem. f. Failure mode. 8. Generator. Entropy generation rate, W K '. gA. Primary flow at section A - A. T. Temperature, K. int. Intercooler. u. Entrainment ratio. V v w r. 1. Velocity, m s". 1. Velocity at any radius r, m s". Total or stagnation condition. P. Pump. rey. Work, W. rHE. Greek symbols. r n. o. t. Specific heat ratio of gas. turb. Collector efficiency. X. Viscosity, Pa s. ix. Reversible Reversible heat engine Throat Turbine x axis coordínate.
(15) Chapter 1. Introduction The. International. Institute. of. Refrigeration. (HR). has. estimated. that. approximately 15% of all the electricity produced in the w o r l d is employed for refrigeration and air-conditioning applications of various kinds (Abdulateef, Sopian, Alghoul, & Sulaiman, 2009) and w i t h the rapidly growing economies of countries like China, India and South Korea this figure w i l l only get higher; by 1990, less than 1% o f urban Chinese households owned an air conditioner, but by 2003 this number rose to 62% ( M c N e i l & Letschert, 2008). Considering that over 80% of the global warming impact of refrigeration systems is due to its electricity use; energy efficiency and the development of sustainable cooling technologies become a crucial element in minimizing this impact. The existing array of solar cooling solutions corresponding to thermally driven refrigeration cycles, is relatively wide (Deng, Wang, & Han, 2011; K i m & Infante Ferreira, 2008); however there are only a handful of commercially available systems, most o f which are sorption machines powered by steam or hot water that represent only a marginal fraction of the entire cooling market (Wimolsiri Pridasawas, 2006). The main factors behind their low market share are the high prices of the units and the fact that they require specialized installation and maintenance. services. (Wimolsiri Pridasawas, 2006) that often come at higher cost than those of the traditional mechanical compression units. This establishes the need for a system that overcomes the drawbacks of the current solar cooling solutions, that is, a mechanically simple unit, which is therefore low i n cost, capable of working w i t h environmentally friendly refrigerants (low ozone depletion and global warming potential). The ejector based refrigeration cycle has the se characteristics, application has. however its. been limited to industrial processes and a few experimental. installations from research groups around the w o r l d (Ma, Zhang, Omer, & Riffat, 2010; Meyer, Harms, & Dobson, 2009; Pollerberg, A l i , & Dotsch, 2009; Wimolsiri Pridasawas, 2006). This has been mainly because of its low thermal coefficient of performance ( C O P ) , which is even lower than those found on single-effect absorption machines;. 1.
(16) the current experimental installations normally do not reach a C O P higher than 0.4 (Abdulateef et al., 2009). Besides, the majority of them also lacle the means to guarantee its proper functioning along the full range of common operating conditions for traditional vapor compression systems. These. characteristics. have. two. consequences:. a. working. ejector. based. refrigeration system needs more solar collection área than a single effect absorption machine for any given cooling capacity, which translates in higher costs and secondly once the ejector is running there are no guarantees that the changes in ambient temperature w o u l d not drift the ejector apart from its design point, lowering its C O P and potentially causing the system to stop working altogether. Further research is needed to overeóme these obstacles and provide a reliable and efficient ejector refrigeration system, however two promising Unes of research are currently lowering the gap between research and commercially available ejector systems; the first one is the use of variable-geometry ejectors, which are adjustable for a wide range of operating conditions (Aphornratana, 1997; Dennis & Garzoli, 2011; M a et al., 2010; Varga et al., 2011) and secondly the introduction of a hybrid ejector-compressor cycle that pairs an ejector with a mechanical compressor in order to reduce its electricity consumption (Sokolov and Hershgal, 1990).. 1.1 Traditional ejector refrigeration cycle The ejector was invented by Sir Charles Parsons in 1901 (Chunnanond & Aphornratana, 2004) but the first person to use one on a refrigeration cycle was Maurice Leblanc in 1910 (Gosney, 1982), from there its application grew for 20 years up to the early 1930's, during that period, as other researchers have stated, there were even units employed to cool the passenger cabins of the. steam. locomotives (Stoecker & Jones, 1982); however they were eventually phased out by mechanical vapor compression. systems w i t h the arrival of the diesel-electric. locomotive. O n the ejector-based refrigeration system the ejector replaces the mechanical compressor as the component that raises the low-pressure refrigerant to a point high enough for rejection of heat at the condenser. The ejector based refrigeration cycle (Figure 1.1) consists of an evaporator, a condenser and an expansión valve, while the ejector, the refrigerant pump and the generator, which can be powered by solar or any other thermal energy, replace the mechanical compressor.. 2.
(17) Figure 1.1 Ejector based refrigeration cycle and its corresponding P-h diagram The high-pressure refrigerant produced by the generator is used as the ejector's motive fluid, which under a supersonic expansión creates the low pressure required for the evaporation of the refrigerant inside the evaporator, thus producing the desired cooling effect of the system. Both the high-pressure motive fluid (a) and the low-pressure entrained refrigerant from the evaporator (g) are mixed inside the ejector (b) and then discharged at an intermediate condenser pressure (c). Inside the condenser the mix rejects part of its condensation heat and returns to the liquid form (d) , after which part of the mix is returned to the generator by the refrigerant pump (e) where it becomes a high-pressure refrigerant again, while the remaining part returns to the evaporator by the expansión valve (f) to complete the cycle. The operating conditions of the cycle are given in terms of the temperatures and pressures of the generator, the evaporator and the condenser, which are defined by the following factors: the type of heat source, the kind of cooling application and the environmental conditions of the zone. There are four parameters normally used to evalúate the performance of the cycle: the coefficient of performance ( C O P ) , the entrainment ratio, the critical backpressure and the compression ratio. The C O P is defined by the ratio between the heat removed at the evaporator and the amount of heat required by the generator plus the w o r k from the refrigerant pump:. 3.
(18) (1.1). However, due to the low energy consumption of the refrigerant pump in comparison to the generator, its effect is usually neglected, leading to the more common expression of:. (1.2). The C O P is directly proportional to the entrainment ratio (1.3), which is the relationship between the mass fiow of the entrained or secondary fluid and the one of the motive or primary fluid.. (1.3). The ejector's critical backpressure is the m á x i m u m pressure allowed at the condenser before the entrainment ratio drops because the ejector cannot choke the secondary fluid;. i f the. condenser pressure is further. increased the. ejector. malfunctions due to the reversal of the flow inside it. Figure 1.2 shows these operational models.. Figure 1.2 Operational modes of the ejector. 4.
(19) Lastly, the compression ratio of an ejector is defined as the ratio between the evaporator and condenser pressures:. (1.4). Given that the entrainment ratio is related to the energy efficiency of the cycle and that the compression ratio limits the temperature at which the heat can be rejected, there is no doubt that an ejector operating at any given operating conditions w i t h the highest entrainment ratio under the highest possible critical backpressure w i l l be the most desired ejector.. 1.2 Ejector's working principie The required heat input of the cycle is used to genérate the primary fluid that enters the ejector at the convergent-divergent section called the primary nozzle (Figure 1.3), in which it expands and accelerates to a supersonic speed generating a low pressure región at its exit; where it entrains the secondary fluid into the mixing chamber and at the end both fluids are fully mixed. Due to the high pressure that prevails at the end of the diffuser a normal shock occurs causing the compression effect and a sudden deceleration (the mix transitions from supersonic to subsonic). The pressure further rises inside the subsonic diffuser as a result of the additional deceleration generated by the divergent section of the diffuser.. 5.
(20) Distance along thc ejector. Figure 1.3 Schematic diagram of a constant-pressure mixing ejector. 1.3 Enhanced ejector refrigeration cycle I n 1990 Sokolov and Hershgal proposed a series of variations to the traditional ejector refrigeration cycle that introduced an auxiliary mechanical compressor into the system. Their first variant consisted on a system with the mechanical compressor placed in series w i t h the ejector secondary inlet, as shown in Figure 1.4. I n essence this modification raised the suction pressure of the secondary flow, which translates in either a higher outlet pressure or a higher entrainment ratio, positively impacting the overall thermal efficiency of the system.. 6.
(21) Distance along the ejector. F i g u r e 1.3 S c h e m a t i c d i a g r a m o f a c o n s t a n t - p r e s s u r e m i x i n g e j e c t o r. 1.3 Enhanced ejector refrigeration cycle In. 1990 S o k o l o v a n d H e r s h g a l p r o p o s e d a series o f v a r i a t i o n s t o t h e t r a d i t i o n a l. ejector refrigeration cycle that i n t r o d u c e d an auxiliary mechanical compressor. into. the system. T h e i r first v a r i a n t consisted o n a system w i t h the mechanical compressor i n series w i t h t h e ejector s e c o n d a r y. placed. i n l e t , as s h o w n i n F i g u r e 1.4. I n e s s e n c e t h i s. m o d i f í c a t i o n raised the suction pressure o f the secondary. flow, w h i c h translates i n. either a higher outlet pressure or a higher entrainment ratio, positively i m p a c t i n g the overall t h e r m a l efficiency o f the system.. 6.
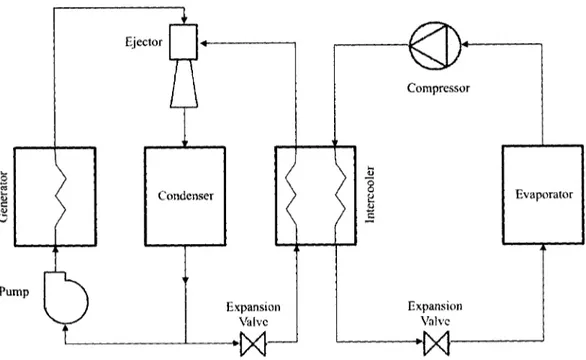
(22) Figure 1.4 Booster assisted ejector cycle However this configuration also presented some disadvantages: coupling the mechanical compressor discharge w i t h the ejector secondary inlet represents a challenge due to the high sensitivity of the ejector for variable inlet conditions. Secondly, the lubricant of the mechanical compressor mixed w i t h the refrigerant may produce a two-phase flow causing efficiency losses; lastly the excess heat produced by the t w o compression stages also represents a higher load on the condenser. The second configuration proposed by Sokolov and Hershgal (1990) tried to o v e r e ó m e the aforementioned disadvantages, as shown in Figure 1.5 the result was a h y b r i d cycle in which the mechanical. compressor and the ejector. sub-cycles. exchange heat through an intercooler. By employing an indirect contact. heat exchanger as the. intercooler. the. refrigerant contamination by the lubricant is avoided, and the capacity of the intercooler is able to compénsate for the fluctuation of the operating conditions, thus guaranteeing the proper operation of the system.. 7.
(23) Figure 1.5 Hybrid ejector-compressor cycle The results from Sokolov and Hershgal (1990) using R114 as the refrigerant proved that by employing only 119 W of mechanical power for the compressor, a C O P of 0.767 can be achieved for the hybrid cycle, compared to the 0.252 C O P of the basic ejector refrigeration cycle. This example shows that by investing a small amount of electrical power into the cycle a high amount of thermal consumption is spared, thus reducing the size and implementation costs of the system.. 1.4 Hypothesis l t is possible to optimize the design of the ejector for a more efficient operation in terms of both critical backpressure and entrainment ratio when compared to current designs.. 1.5 General objective To design an ejector suitable for a hybrid ejector-compressor cycle powered by solar thermal energy.. 8.
(24) 1.6 Specific objectives a.. Identify the root causes of the ejector's low thermal efficiency.. b. Identify. and. implement. the. most. appropriate. one-dimensional. mathematical model to predict the performance of the ejector. c.. Employ a Computational Fluid Dynamics ( C F D ) study to associate the changes in the geometric parameters of the ejector w i t h its operational behavior, in terms of both entrainment ratio and critical condenser backpressure.. d. Optimize the design of the ejector using the results from the C F D study. e. Validate the efficiency increase of the proposed ejector over a baseline design. f.. Ouantify the thermal efficiency of a hybrid ejector-compressor. system. employing the validated ejector. g. Propose the design for a test stand to verify the effect of the new ejector and lay the groundwork for experimentation.. 1.7 Thesis structure The research w o r k for this thesis is presented in the following manner to address each one of the aforementioned specific objectives:. •. Chapter 2 includes the relevant literature review on the subject of ejectors in cooling applications.. •. Chapter 3 presents an ejector efficiency analysis to establish a theoretical limit for the m á x i m u m achievable. entrainment. ratio of an. ejector. undergoing a fully reversible process; the discussion of the main sources of irreversibility within the ejector is also covered in this chapter. •. Chapter 4 includes the implementation of the mathematical model to predict the entrainment ratio for an ejector w i t h a given set of nozzle and constant á r e a section diameters.. •. Chapter 5 covers the Computational Fluid Dynamics design exploration aimed at identifying the effects of the rest of the key geometrical parameters, which are not covered by the mathematical model.. 9.
(25) •. Chapter 6 presents an optimized ejector, which was designed taking into consideration the optimum geometrical parameters found by the design exploration. The Constant Rate of Momentum Change method is selected in this chapter to genérate the diffuser geometry of the proposed design. The chapter concludes w i t h the assessment of the performance increase of the proposed ejector, measured against a baseline design. The thermal efficiency increase of a hybrid ejector-compressor system employing the proposed ejector is also quantified.. •. Chapter 7 includes the conclusions and recommendations for future w o r k in the subject.. •. Appendix A covers the description and current condition of the test stand proposed to experimentally verify the findings of this research w o r k .. •. Appendix B includes the source code developed to obtain the results presented throughout the thesis.. 10.
(26) Chapter 2. Literature Review This literature review is aimed to introduce both background and. recent. developments in ejectors for cooling systems. The included works are grouped in the following. áreas. computational. of interest: thermodynamic modeling of the fluid. dynamics. developments,. variable-geometry. ejector, ejectors,. ejector high. efficiency ejectors, enhanced ejector refrigeration cycles and ejector experimental installations.. 2.1 Thermodynamic modeling of the ejector While the dynamics of the ejector were not fully understood in its early decades, empirical methods had to be used during the design of the first ejectors implemented on cooling systems. I n 1942, the theoretical prediction of the ejector took a giant leap when Keenan and Neumann established a one-dimensional continuity, momentum and energy model that predicted the performance. of the ejector, laying the. groundwork for later models. However most of the modern models are based on the one presented by Huang in 1998. The generator and condenser pressure along w i t h a set of proposed throttle diameters are needed to solve this model. Figure 2.1 summarizes the most influential ejector thermodynamic models to date, in addition to the contributions made by Keenan, the considerations of M u n d a y and Bagster (1977) also aided on the development of these models.. 11.
(27) Figure 2.1 Timeline of some of the most influential ejector thermodynamic models M u n d a y and Bagster (1977) stated that after exhausting from the nozzle, the primary flow fans out without mixing w i t h the secondary flow and induces a converging duct which becomes a virtual converging nozzle such that accelerates the secondary flow to a sonic velocity at the hypothetical throat. Huang (1998) based his model on the fact that this hypothetical throat resides somewhere w i t h i n the constant á r e a section (CAS) of the ejector, this model employed the following assumptions: 1. The w o r k i n g fluid is an ideal gas with a constant specific heat ratio. . 2. The flow inside the ejector is steady and one-dimensional. 3. The kinetic energy at the inlets of primary and suction ports and the exit of diffuser are negligible. 4. For simplicity in deriving the one-dimensional model, the isentropic relations are used as an approximation. But to account for non-ideal process, the effects of frictional and mixing losses are taken into account by using some coefficients introduced in the isentropic relations. These coefficients are related to the isentropic efficiency and needs to be determined experimentally. 5. After exhausting from the nozzle, the primary flow fans out without mixing. with. the. secondary. flow. until. at. some cross section y - y. (hypothetical throat) inside the constant á r e a section. 6. The two streams start to mix at the hypothetical throat cross section w i t h a uniform pressure before the shock occurs (s-s). 7. The entrained flow is choked at the hypothetical throat cross section (y-y). 8. The inner wall of the ejector is adiabatic.. 12.
(28) F i g u r e 2.1 T i m e l i n e o f some o f the most influential ejector t h e r m o d y n a m i c models. M u n d a y and primary. flow. Bagster. fans. out. (1977) stated without. t h a t after exhausting f r o m. mixing. with. the. secondary. the nozzle,. flow. and. the. induces. a. c o n v e r g i n g d u c t w h i c h becomes a v i r t u a l c o n v e r g i n g nozzle such that accelerates the secondary. flow. t o a sonic v e l o c i t y at the h y p o t h e t i c a l t h r o a t . H u a n g ( 1 9 9 8 ) b a s e d his. m o d e l o n the fact t h a t this h y p o t h e t i c a l t h r o a t resides s o m e w h e r e w i t h i n the á r e a section ( C A S ) o f the ejector, this m o d e l e m p l o y e d the f o l l o w i n g. 1. . 2. 3.. The working. fluid. constant. assumptions:. is a n i d e a l gas w i t h a c o n s t a n t s p e c i f i c h e a t r a t i o .. T h e flow i n s i d e t h e e j e c t o r is s t e a d y a n d o n e - d i m e n s i o n a l . T h e k i n e t i c e n e r g y at t h e i n l e t s o f p r i m a r y a n d s u c t i o n p o r t s a n d t h e e x i t o f diffuser are negligible.. 4.. For. simplicity. relations. are. in. used. d e r i v i n g the as. an. one-dimensional. approximation. B u t to. model,. the. account. isentropic. for. non-ideal. p r o c e s s , t h e e f f e c t s o f f r i c t i o n a l a n d m i x i n g losses a r e t a k e n i n t o a c c o u n t b y u s i n g some coefficients i n t r o d u c e d in the isentropic relations.. These. coefficients. to. are. related. to. the. isentropic. efficiency and. needs. be. determined experimentally. 5.. After mixing. exhausting with. the. from. the. nozzle,. secondary. flow. the. primary. until. at. flow. some. fans cross. out. without. section. y-y. (hypothetical throat) inside the constant á r e a section. 6.. T h e t w o streams start to m i x at the h y p o t h e t i c a l t h r o a t cross section w i t h a u n i f o r m pressure before the s h o c k occurs (s-s).. 7.. T h e e n t r a i n e d flow is c h o k e d a t t h e h y p o t h e t i c a l t h r o a t c r o s s s e c t i o n ( y - y ) .. 8.. T h e i n n e r w a l l o f t h e e j e c t o r is a d i a b a t i c .. 12.
(29) Figure 2.2 represents the schematic showing the mixing process of the two streams proposed by Huang (1998).. Figure 2.2 Schematic of the mixing process proposed by Huang (1998) Based on the model from Huang (1998); Ouzzane & Aidoun (2003) worked on schemes to optimize the geometry of the ejector, they implemented a computer program that consisted of two modules, one of which is used to find the optimal design parameters of the ejector while the other simulates the behavior of the cycle. Their results were validated w i t h the experimental data also presented by Huang (1998). Zhu, Cai, Wen, and L i (2007) proposed a model that accurately predicted the performance of the ejector with typical errors of less than 5% compared to published experimental data, this is achieved by considering a 2 D flow near the ejector inner walls at the entrance of the constant á r e a section instead of the traditional I D assumption. I n addition to its accurate results, this model reduced the number of equations to be solved from 18 of the model made by Huang (1998) to only 14, requiring. only t w o basic isentropic coefficients. aforementioned. compared. with. four. in the. I D model, which makes it more convenient to apply to other. refrigerants. This model can be considered as the state-of-the-art for thermodynamic ejector models, a more detailed explanation along w i t h its implementation are given in Chapter 4.. 2.2 Computational fluid dynamics analysis Although it was previously established that the ejector thermodynamic models are able to predict its behavior w i t h relatively small errors ( Z h u et al., 2007) the C F D analysis is still the most reliable tool for this purpose, the reason being its. 13.
(30) capability to not only predict the entrainment ratio and critical backpressure but to fully analyze its flow and pressure field characteristics.. For reference and ease of. understanding Figure 2.3 is a schematic of some geometrical parameters of the ejector that are commonly studied w i t h the use of C F D .. Figure 2.3 Schematic of the geometrical parameters of the ejector Rusly, Aye, Charters, and O o i (2005) employed a C F D study to validate the well-known experimental data provided by Huang (1998) who tested an ejector w i t h R H l b as the refrigerant, the study revealed that the errors from the C F D analysis were lower than 10%, compared to those from one-dimensional predictions that were up to 23%. The data also showed that i n all o f the experimental test cases from Huang (1998), no shock was present i n the ejector, which was inconsistent w i t h the assumption o f the presence of a shock i n their one-dimensional model. After validating the C F D results, Rusly et al. (2005) analyzed the effects of some geometry parameters, focusing only on the constant á r e a section (CAS) diameter and the nozzle exit position ( N X P ) , concluding that a constant á r e a diameter increase only improves the ejector performance when it is operating i n critical mode w i t h a shock in the diffuser and that i n order to obtain a m á x i m u m entrainment ratio, the constant á r e a diameter can be continuously increased until the shock disappears but the secondary flow choking remains. Zhu, Cai, Wen, and L i (2009) also presented an extensive C F D study of a R H l b ejector to investígate the effects of the N X P and the convergence angle of the mixing section. The parameters of the C F D model was calibrated w i t h experimental data from their o w n ejector refrigeration cycle installation, employing a total of 95 different geometrical variations for the ejector.. 14.
(31) O u t of their 210 testing results, they found that the optimum N X P is not only proportional to the mixing section throat diameter, but also increases as the primary flow pressure rises. The authors also found that the performance of the ejector is highly sensitive to the mixing section convergence angle, especially near the optimum w o r k i n g point, when the primary fluid pressure increases this angle should also be increased to maximize the entrainment ratio. However its study had a very limited range of tested operating conditions, the condenser temperature varied from 28.5 ° C to 31.5 ° C w i t h only two evaporator temperatures, 10 ° C and 12 °C, which are not suitable for a h y b r i d cycle. Bartosiewicz, Aidoun, and Mercadier (2006) proved that C F D could successfully predict ejector malfunctions (off design operation or reverse. flow),. which is. something that thermodynamic models are unable to do. A n exemplary w o r k in this área is the one done by Sriveerakul, Aphornratana, and Chunnanond (2007) using steam (R718) as the refrigerant, w i t h the use of F L U E N T 6.0 C F D models validated experimentally, they managed to verify that the hypothetical throat á r e a within the ejector proposed by Munday and Bagster (1977) actually exists. Although. the authors. employed an ideal gas. model for the. refrigerants, its simulation captured the oblique shock patterns occurring w i t h i n the ejector. Table 2.1 summarizes their results. Table 2.1 Effects of the geometric and operating parameters of the ejector. Varga, Oliveira, and Diaconu (2009) also studied the effects of three geometrical parameters for a steam ejector: the N X P , the CAS length and the nozzle throat diameter. Operating conditions were considered in a range that would be suitable for. 15.
(32) a traditional ejector cooling cycle powered by solar heat, that is,. generator. temperatures of 90 ° C and 100 ° C w i t h an evaporator temperature of 10 ° C and condenser temperatures ranging from 25 ° C to 40 °C. The study showed that the ejector using steam as the working fluid running at constant. evaporator. and. generator. pressures improved its entrainment. ratio. considerably when the nozzle throat diameter was reduced, however, this resulted in a smaller critical backpressure. This meant that a single optimum can be identified as the nozzle throat diameter that would bring the ejector to opérate at critical mode for a given condenser temperature. Yan, Cai, and L i (2012) presented a C F D model validated w i t h the experimental data of an air-cooled ejector refrigeration system w i t h R134a refrigerant, that evaluated the influences of 6 key geometrical parameters: CAS diameter, N X P , primary nozzle diverging angle, mixing chamber converging angle, CAS length and diffuser length, on the system performance (entrainment ratio). B y covering this large number of parameters the only downside of the study was the limited set of testing. conditions:. fixed. generator. temperature. of 70. °C, fixed. condenser. temperature o f 32 ° C and variable evaporator temperatures of 8.5 °C, 10 ° C and 11.5 °C. The authors. concluded that the two most influential parameters to the. performance of the ejector are the CAS diameter and the N X P . The pinpointing of the effects. of all the geometrical parameters on. the. performance of the ejector has been only possible because of the use of C F D along w i t h the results from experimental installations, this undoubtedly is facilitating the development of new concepts of ejectors seeking to achieve higher entrainment ratios under several operating conditions, such is the case of the variable-geometry ejectors.. 2.3 Variable-geometry ejectors By knowing the relationship between all the different geometrical parameters of the ejector w i t h its operational modes it is easy to identify the opportunity to implement a mechanism that automatically changes some of those parameters to keep the ejector w o r k i n g inside its critical mode, making the ejector more robust to pressure variations in both the generator and the condenser. The throat á r e a at the primary nozzle has been the most commonly researched parameter in this subject; by using a needle valve inside the nozzle the effective throat á r e a varíes according with the axial position of the needle ( L i u , L i , & Groll,. 16.
(33) 2012; M a et al., 2010; Vereda, Ventas, Lecuona, & Venegas, 2012). Figure 2.4 shows the mechanism i n question.. Figure 2.4 Schematic of the primary nozzle needle valve The ejector proposed by M a et al. (2010) implements such mechanism on a test stand w i t h a cooling capacity of 5 k W with water as refrigerant; they successfully proved that an optimal operation can be maintained at some degree by varying this parameter while the generator pressure varies, which is a very common scenario w i t h solar powered cooling cycles. Varga et al. (2011) worked on a similar design validating it through C F D ; their simulations predicted the mass flow of the primary fluid w i t h an average relative error of 7.7% along the entire range of needle positions in comparison w i t h the measures obtained on their test stand, proving that C F D is an effective tool to validate variable-geometry designs. Later, Varga, Lebre, and Oliveira (2013) made a C F D analysis of the same variable-geometry ejector w i t h R152a and R600a as refrigerants designed for a 1 k W cooling capacity system; compared to its fixed geometry ejector that had an entrainment ratio of 0.22, the resulting variable geometry design operated at 0.39 for low condenser pressures. Some commercial ejectors used on industrial processes have a movable primary nozzle that is adjusted during the set-up of the process (Figure 2.5), but once it operates under the desired conditions the nozzle position gets fixed. Aphornratana (1997) introduced the concept of a manually adjustable primary nozzle in order to test its behavior when the nozzle moves in and out of the mixing chamber.. 17.
(34) The employed 2 k W cooling capacity test stand w i t h water as refrigerant showed that at constant generator pressure the C O P gets lower as the primary nozzle exit becomes closer to the mixing chamber, also Iowering the effective cooling capacity of the system; however, this also increased the critical condenser backpressure. I n a similar way, retracting the primary nozzle resulted on a higher C O P but reduced the critical backpressure. Using only this variable parameter the authors created the performance chart of the ejector for several nozzle positions, concluding that it w i l l be possible to adjust its position automatically by monitoring the real-time parameters of the cycle to guarantee the optimal operation of the ejector. Taking the concept of a variable-geometry ejector from D . W . Sun (1996), Dennis and Garzoli (2011) added the notion of cold store to raise the solar fraction achieved by an ejector based cooling system. Initially D . W . Sun (1996) suggested that an ejector should have a variable á r e a ratio w i t h a variable length i n order to w o r k for a full range o f condenser and generator temperatures. The results from the T R N S Y S simulation of Dennis and Garzoli (2011) showed that the variable-geometry ejector achieved a solar fraction 8% to 13% higher than the fixed geometry one.. 2.4 High-efficiency ejectors While the concept of having a variable-geometry ejector attempts to solve its incapability to adapt to varying working conditions, its low thermal efficiency. 18.
(35) remains as one of its main disadvantages. McGovern, Prakash Narayan,. and. Lienhard (2012) employed the concept of a reversible entrainment ratio, which is the m á x i m u m achievable entrainment ratio for an ejector for a giving set of operating conditions. I n this way by obtaining both the reversible and the actual ratios a thermodynamic ejector efficiency can be calculated. The way to cióse the gap between a real ejector and a reversible one is to identify the sources of ejector irreversibility; Gurulingam (2012) recognized three sources: mixing, kinetic energy losses and normal shock, identifying the large momentum difference between the motive and the secondary fluid as the main cause. The authors proposed a method to raise the velocity of the secondary fluid before it reaches the mixing chamber, thus reducing the momentum difference between the primary and the secondary flows. Watanawanavet (2005) also proposed an ejector design w i t h a prolonged primary nozzle exit that allows the secondary fluid to gain speed before entering in contact w i t h the primary fluid, effectively reducing the momentum difference between them. Yadav and Patwardhan. (2008) studied the effects of the mixing. chamber. geometry on the ejector efficiency, concluding that the convergent section must have o. and angle between 5 - 15° to get an optimum mixing process between both fluids. The constant rate of momentum change method ( C R M C ) introduced by Ian W . Eames. (2002). thermodynamic. is. able. shock. to. genérate. process within. a. diffuser the. geometry. diffuser. by. that. gradually. removes. the. raising. the. momentum of the mix at a constant rate, allowing the static pressure to also rise gradually. This method is able to increase the critical backpressure of the ejector over the entire range of operating conditions; the details of it are explained on Chapter 6, where it is used to model the diffuser of the proposed design.. 2.5 Enhanced ejector refrigeration cycles D . W . Sun (1995) theoretically analyzed the hybrid ejector-compressor. cycle. proposed by Sokolov (1990) to be powered by solar thermal energy, employing R134a as the refrigerant for the mechanical compression sub-cycle instead of R114 as Sokolov (1990) initially proposed,. while its ejector. compression. sub-cycle. employed steam as the refrigerant. D . W . Sun (1995) theoretically proved that when the ejector operated at higher evaporator temperatures it ran more efficiently, however a conventional ejector refrigeration cycle running at high evaporator temperatures has no practical use i n. 19.
(36) refrigeration applications, which is w h y the hybrid ejector-compressor cycle replaces the evaporator w i t h an intercooler running at temperatures from 20 ° C to 25 °C, allowing the ejector to opérate at a higher efficiency. The proposed refrigeration system of 5 k W (1.42 ton) reduced the power 2. consumption of the compressor by 50% employing 23 m of solar collector á r e a w i t h 2. 50% of efficiency (assuming an irradiation of 900 W / m ) at a generator temperature o f 8 0 °C. Subsequently Arbel and Sokolov (2004) reviewed their past w o r k of 1990 to analyze the system w i t h R142b as the refrigerant. This time the authors also analyze the possibility o f using solar thermal energy to power the ejector sub-cycle, finding that R142b is more efficient than R l 14 in such applications. Arbel and Sokolov (2004) found out that in order to produce. 1 ton of. 2. refrigeration, a collector á r e a of 23.5 m w i t h 90% efficiency is required along w i t h a 350 W mechanical compressor. I n 2009,. Huang developed a prototype of the hybrid ejector-compressor cycle,. using a R22 compressor w i t h inverter technology, while the ejector sub-cycle used R365mfc refrigerant. The experimental results showed that the C O P of a commercial inverter-type air conditioner increases at a rate of about 0.12 per ° C of condensing temperature drop. This means that a 20 ° C reduction in condensing temperature w i l l increase the C O P by 2.4, which is about twice the original COP, meaning that it saves about 50% of the compressor power consumption. The. prototype. of the. entire. system. effectively reduced. the. condensing. temperature of the mechanical compressor sub cycle by 12.6 to 7.3°C, reducing the power consumption by 81.2% - 34.5%; this experimental installation can. be. considered as one of the most advanced to date for hybrid cycles.. 2.6 Experimental installations The development of experimental installations or system prototypes is without a doubt the factor that takes us closer to a commercial ejector refrigeration unit; included i n this section are examples of the most recent installations currently available in the literature. Pollerberg et al. (2009) developed an ejector refrigeration cycle installation built by the Fraunhofer U M S I C H T and tested at the University of Bochum, Germany. The system of 1/3 ton of refrigeration uses steam (R718) as the refrigerant and it is 2. powered by a 10.5 m parabolic trough that reaches temperatures of up to 140 ° C. 20.
(37) (this is one of the few installations powered by solar heat instead of electrical steam generators for testing purposes). The G e r m á n company G E A Jet Pumps designed the ejector that operated at a nominal evaporator temperature of 10 °C. Their test results showed that by decreasing the condenser temperature, the C O P rises; below a condenser temperature o f about 20 °C, the C O P reached valúes above 1. A t an evaporator temperature o f 13 °C, a C O P of above 1 could still be reached at a condenser temperature o f 25 °C. Meyer et al. (2009) also developed a steam ejector refrigeration system built by the University o f Stellenbosch, South Africa. A set of two electrical resistances o f 4 k W each was used to genérate the steam from 85 ° C — 140 °C. The ejector used on this installation included a set of three primary nozzles w i t h throat diameters of 2.5, 3 and 3.5 mm. The heat load at the evaporator o f this installation is simulated w i t h a 3 k W electrical resistance while the temperature inside the evaporator is kept at either 5 ° C or 10 °C. The resulting C O P o f this system is about 0.253. I n 2011 Scott, Aidoun, & Ouzzane completed a prototype R245fa installation at the C a n m e t E N E R G Y i n Varennes, C a n a d á . The ejector was machined out of stainless steel and brass, divided into interchangeable sections w i t h. different. geometrical parameters, while the position o f the primary nozzle was also variable. The generator consists of a 165 L stainless steel container, which is heated by a 30 k W electrical resistance. The evaporator is a compact píate heat exchanger heated by a 55% - 45% mixture of glycol-water feeded by a secondary circuit heated w i t h a 9 k W electrical resistance. The condenser is also a compact píate heat exchanger, which is cooled by water from a secondary circuit feeded by an 11 ton electric chiller. The authors used the experimental data to compare it w i t h the results from both one-dimensional and C F D models, concluding that the one-dimensional model over predicted the condenser critical pressure by as much as 69%, while the C F D simulations differed by less than 16% from the actual valúes. J i a and Wenjian (2012) built an air-cooled traditional ejector cycle using R134a w i t h a cooling capacity o f 2 k W . The generator consisted o f a vapor collection tank, a temperature-controlled hot water bath and a tubular heat exchanger immersed in the vapor collection tank powered by an electric heater w i t h a m á x i m u m power output of 8 k W . The air-cooled condenser had a m á x i m u m condensing load of 10 k W and the ejector had 6 interchangeable primary nozzles w i t h different throat diameters. D u r i n g their tests 3 evaporating temperatures were used 8 °C, 10 ° C and 12 °C; the generator temperature varied from 72 ° C to 78 ° C and the condenser temperature. 21.
(38) was fixed at 31 °C. The optimum área ratios were found at 3.69, 4.16 and 4.76 for the aforementioned evaporator temperatures respectively. Showing that the optimum á r e a ratios increase almost linearly w i t h an increase of the primary flow pressures. Finally in 2013 Pounds, Dong, Cheng, & M a tested several operating conditions w i t h an experimental installation of a traditional steam ejector refrigeration cycle, the generator tested temperatures. ranged from. 120 ° C to 135 °C, the. evaporator. temperatures from 5 ° C to 15 ° C and condenser temperatures from 7 ° C to 30 °C. The experimental setup consisted of a boiler for the generator and a low-temperature boiler creating low-temperature evaporation as the evaporator, a condenser, a pressure-tap subsystem, a pumping subsystem, a reservoir, and the ejector. Both boilers were equipped w i t h a 5 k W electric immersion heater and were controlled using a variable voltage transformer. The condenser used was a shell and tube style water-cooled heat exchanger. The ejector had a movable primary nozzle to test several nozzle exit positions ( N X P ) . The experimental results proved that the N X P significantly affects the system C O P and that an optimum N X P exists only for a given set of generator and evaporator temperatures.. 2.7 Summary This. chapter. reviewed. the. state-of-the-art. on. ejectors. for. refrigeration. applications in 6 main lines of research, the following concluding remarks can be declared: •. The thermodynamic models of ejector are able to predict the entrainment ratio w i t h relatively low errors, the shock circle model from Z h u et al. (2007) presents typical errors of less than 5% compared to published experimental data.. •. The thermodynamic models cannot predict the ejector's failure modes, mainly because most of the required assumptions depend of the ejector operating at critical mode, however C F D simulations can predict these failures.. •. Several C F D studies have been conducted to identify the effects of all the different geometrical parameters of the ejector, however most of them focused only i n the operating conditions suitable for the traditional ejector refrigeration cycle.. 22.
(39)
(40) Criapter 3. Ejector Efficiency Analysis I n order to propose an ejector design w i t h improved efficiency, a method to quantify this parameter has to be established. This chapter introduces the concept of the reversible entrainment ratio efficiency as a tool to measure how cióse the actual entrainment. ratio of an ejector is to the theoretical m á x i m u m or reversible. entrainment ratio. This concept was first proposed by Elrod J r . (1945) and was more recently employed by McGovern et al. (2012) for specific ejector applications (air-air, steam-steam and steam-moist-gas ejectors). The particulars of this parameter are fully explained in this section, along with their application to assess a selected set of experimental data currently available from the literature.. 3.1 Reversible ejector entrainment ratio A reversible process is defined as one that can be reversed without entropy production and it is extremely useful for defining limits to a device or system behavior. In reality the processes taking place inside the ejector like the shear mixing or the momentum changes produce an irreversible condition, however the details of it w i l l be explained in section 3.2. The w o r k i n g principie of the ejector has been previously established, however in order to define a reversible reference ejection process, a control volume model has to be outlined. Figure 3.1 describes this model; the primary fluid from the generator is defined by its mass flow rate, pressure, temperature, specific enthalpy and entropy; the same applies for the secondary fluid from the evaporator and the discharged fluid to the condenser. The walls of the ejector are considered as adiabatic, so no transfer of heat or entropy is allowed to its surroundings.. 25.
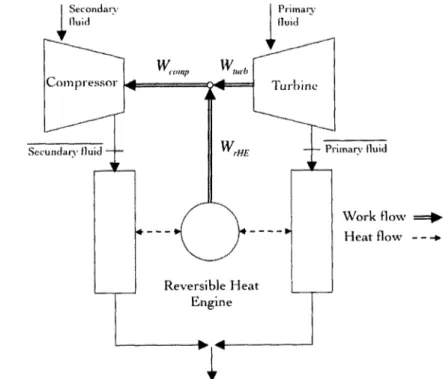
(41) Figure 3.1 Control volume of an ejector process W i t h o u t attempting to explain the specifics of how a reversible process could be achieved inside a real ejector, one can use the turbine-compressor-heat. engine. analogy (Figure 3.2) to describe how such process could take place w i t h i n the control volume.. Figure 3.2 Diagram of a thermodynamically reversible ejector. 26.
(42) For this analogy the primary fluid is expanded through an adiabatic and isentropic turbine, while the secondary fluid is compressed through an adiabatic and isentropic compressor driven by the w o r k produced by the turbine and the reversible heat engine that enables both fluids to reach an equilibrium temperature (T ). c. This analysis considers only equilibrium states for the primary and secondary fluids at stagnation point (the local velocity of the fluid is zero, thus zero kinetic energy is available). By consequence all temperatures and pressures are total and not static. Applying the First Law of Thermodynamics for an adiabatic process:. (3.1). Introducing the definition of entrainment ratio («):. (3.2). (3.3). Second Law of Thermodynamics for an adiabatic process:. (3.4). (3.5). Given that no entropy is generated during a reversible process, the previous equations for the case of an adiabatic reversible process may be formulated as follows, w i t h the introduction of the reversible entrainment ratio definition:. (3.6). (3.7). 27.
(43) Considering the definition o f enthalpy in terms o f both the constant heat capacity at constant pressure (c ) and the temperature: p. h= cT. (3.8). p. the equation (3.3) takes the following form:. c T +u-c T p. g. p. = (l + u)-c T. e. p. (3.9). c. Rearranging this equation, the discharge or condenser temperature for an ejector w i t h an ideal gas as the w o r k i n g fluid may be expressed as:. T. =. "-¥±. (3-10). 1+w Next, rearranging equation (3.7) the Second Law of Thermodynamics may be written as:. .. - í t ^ l. (3.1). Following the ideal gas assumption, the terms that represent the change in entropy between the different states of the process can be denoted in terms o f the state properties T and P by using the expression o f the differential change in entropy of an ideal gas:. ds = c —-—dP P y y. d. s. =. (3.12) '. v. *L_ dP. Cp. (3.13). R. P. T. P. Considering this, the reversible entrainment ratio may be written as follows:. 28.
(44) (3.14). Solving the definite integráis leads to the expression:. (3.15). introducing the definition of the ratio of specific heats ( / ) yields:. (3.16). where c is the specific heat capacity of the gas at constant volume, that relates to v. Rby:. (3.17). Substituting equation (3.16) in (3.17) yields:. (3.18). (3.19). D i v i d i n g both sides of equation (3.15) by the ideal gas constant (R) and using the expression (3.19) the entrainment ratio is defined by:. 29.
(45) (3.20). This expression for the reversible entrainment ratio sets the theoretical m á x i m u m following a Second. Law analysis in terms of the state points of the. ejector. (temperatures and pressures o f the generator, evaporator and condenser) and the constant ratio of specific heats of the refrigerant. The reversible entrainment ratio efficiency, which w i l l always have a valué between 0 and 1, and is expressed by:. (3.21). This parameter is very useful for evaluating the performance results from ejector designs available in the literature, this valué assess how cióse the ejector s actual entrainment ratio is from the m á x i m u m achievable at the given set of operating conditions. The experimental data from Huang (1998) was selected to d e m ó n s t r a t e the use of this parameter; this particular experimental data was chosen because of the level of detail employed by the authors; all the geometrical parameters of the ejectors were included (which is very useful for further C F D studies), along w i t h the operating conditions and the measured entrainment ratios. The authors tested a total of 11 different ejectors under various operating conditions w i t h R141b as the working fluid, the ejectors consisted of several primary nozzles and constant á r e a sections, for abbreviation, ejector A B represents the ejector assembly of nozzle A and constant área section B, for example. The full geometrical specifications are included in Table 3.1. The authors stated that all the ejectors performed at critical mode, so only the critical-point performance is shown and discussed in their publication. The published operating. conditions for each type of ejector. and. the. respective. entrainment ratios are summarized in Table 3.2. Table 3.1 Primary nozzle and constant área section dimensions from Huang. 30. measured.
(46) (3.20). T h i s e x p r e s s i o n f o r t h e r e v e r s i b l e e n t r a i n m e n t r a t i o sets t h e t h e o r e t i c a l m á x i m u m following. a. Second. (temperatures constant. Law. analysis. in. terms. a n d pressures o f the generator,. o f the. state. evaporator. points. o f the. ejector. and condenser). and. ratio o f specific heats o f the refrigerant. T h e reversible e n t r a i n m e n t. the ratio. e f f i c i e n c y , w h i c h w i l l a l w a y s h a v e a v a l u é b e t w e e n 0 a n d 1, a n d is e x p r e s s e d b y :. <D = —. (3.21). T h i s p a r a m e t e r is v e r y u s e f u l f o r e v a l u a t i n g t h e p e r f o r m a n c e r e s u l t s f r o m. ejector. d e s i g n s a v a i l a b l e i n t h e l i t e r a t u r e , t h i s v a l u é assess h o w c i ó s e t h e e j e c t o r s. actual. entrainment. r a t i o is f r o m. the. máximum. achievable. a t t h e g i v e n set. of operating. conditions. T h e e x p e r i m e n t a l d a t a f r o m H u a n g ( 1 9 9 8 ) w a s selected t o d e m ó n s t r a t e t h e use o f this parameter;. this p a r t i c u l a r e x p e r i m e n t a l data w a s chosen because o f the level o f. detail e m p l o y e d b y the authors; all the geometrical parameters o f the ejectors i n c l u d e d ( w h i c h is v e r y u s e f u l f o r f u r t h e r C F D s t u d i e s ) , a l o n g w i t h t h e. were. operating. conditions a n d the measured entrainment ratios. The. authors. tested. a. total of. 11. different ejectors. under. various. operating. c o n d i t i o n s w i t h R H l b as t h e w o r k i n g f l u i d , t h e e j e c t o r s c o n s i s t e d o f s e v e r a l p r i m a r y nozzles ejector. and. constant. assembly. área. sections,. o f nozzle A and. for abbreviation, ejector. constant. á r e a section. AB. represents. the. B, for example. The. full. g e o m e t r i c a l specifications are i n c l u d e d i n T a b l e 3 . 1 . The authors. s t a t e d t h a t a l l t h e e j e c t o r s p e r f o r m e d a t c r i t i c a l m o d e , so o n l y. the. c r i t i c a l - p o i n t p e r f o r m a n c e is s h o w n a n d d i s c u s s e d i n t h e i r p u b l i c a t i o n . T h e p u b l i s h e d operating. conditions. for. each. type. of. ejector. and. the. respective. e n t r a i n m e n t r a t i o s are s u m m a r i z e d i n T a b l e 3.2.. T a b l e 3.1 P r i m a r y nozzle a n d constant á r e a section dimensions f r o m H u a n g. 30. measured.
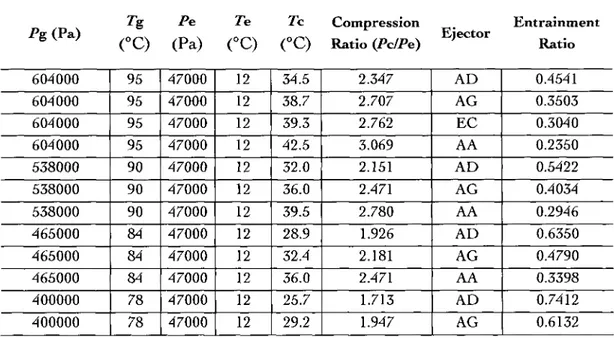
(47) Table 3.2 E x p e r i m e n t a l r e s u l t s f r o m. Huang. 31.
(48) The reversible entrainment. ratio (RER) efficiency. corresponding to each. experimental ejector result was calculated using the Engineering Equation Solver (EES) to compute the thermodynamic properties of the refrigerant and the solution for equation (3.11), appendix B includes the implemented code for this part of the study. The published entrainment ratios and the reversible ones were compared using equation (3.21); these results were later grouped by generator temperature (78 °C, 84 °C, 90 ° C and 95 °C) and plotted in the following figures against their respective compression ratio (P /P ). c. e. Figure 3.3 Calculated RER efficiency for the experimental data of Huang (1998) (Tg= 78 °C). 32.
(49) The. reversible. entrainment. ratio. (RER). efficiency. corresponding. to. e x p e r i m e n t a l ejector result was calculated using the E n g i n e e r i n g E q u a t i o n. each Solver. ( E E S ) to c o m p u t e the t h e r m o d y n a m i c properties o f the refrigerant and the solution for equation (3.11), a p p e n d i x B includes the i m p l e m e n t e d code for this p a r t o f the study.. The. published entrainment. ratios and. the. reversible ones w e r e. compared. u s i n g e q u a t i o n (3.21); these results w e r e later g r o u p e d b y generator t e m p e r a t u r e °C,. 84. ° C , 90. ° C and. 95. respective compression ratio. °C) and. plotted i n the. following. figures. against. (78 their. (P /P ). c. e. F i g u r e 3.3 C a l c u l a t e d R E R e f f i c i e n c y f o r t h e e x p e r i m e n t a l d a t a o f H u a n g ( 1 9 9 8 ) ( T g = 78 ° C ). 32.
(50) Figure 3.4 Calculated RER efficiency for the experimental data of Huang (1998) (Tg= 84 °C). Figure 3.5 Calculated reversible RER for the experimental data of Huang (1998) (Tg= 90 °C). 33.
(51) Figure 3.6 Calculated RER efficiency for the experimental data of Huang (1998) (Tg= 95 °C) The following remarks can be mentioned about the reversible entrainment ratio efficiency results: •. The reversible entrainment ratio efficiency of Huang s ejectors ranged from 12% to 22% over the entire range of operating conditions.. •. Ejectors operating at lower compression ratios achieve higher valúes of reversible entrainment ratio efficiency, which is favorable for a hybrid ejector compressor cycle.. •. Among the 11 different designs, both A G and A D ejectors consistently reached the highest reversible entrainment ratio efficiency over the entire range of operating conditions.. Following this study, the reversible entrainment ratio for a given set of operating conditions can also be calculated, Figure 3.7 shows the results for R141b at three different evaporator temperatures: 10 °C, 15 ° C and 20°C, which are suitable for a hybrid ejector-compressor cycle, the generator temperature was fixed at 80 ° C also suitable for a cycle powered by solar heat and the condenser temperature was varied from 25 ° C to 38 ° C . The corresponding pressure was taken as the saturated pressure for each operating temperature.. 34.
(52) Condenser Temperatura [°C]. Figure 3.7 RER versus condenser temperature for several evaporator temperature conditions ( R H l b / Tg= 80 °C) The effect of the generator temperature was also evaluated (Figure 3.8), ranging from 70 ° C to 130 ° C at the corresponding saturation pressures for 5 different condenser temperature: 24 °C, 26 °C, 28 °C, 30 ° C and 32 °C, this time the evaporator temperature was set at 15 °C.. 35.
(53) Generator Temperatura [°C]. Figure 3.8 RER versus generator temperature for several condenser temperature conditions (R141b / Te= 15 °C) The results show the effect of both the evaporator and condenser temperatures on the m á x i m u m allowable entrainment ratio of the ejector; at low condensing temperatures (i.e. low condenser backpressures) the entrainment ratio limit is higher. For example, an ideal R141b ejector operating at a condenser temperature of 28 ° C and a generator temperature of 80 °C is able to achieve an entrainment ratio of 3 at an evaporator temperature of 20 °C, meaning that the entrained secondary mass flow rate is 3 times higher than the primary mass flow rate from the generator. For a given condenser temperature the reversible entrainment ratio remains almost constant for the generator temperature range of 80 ° C to 100 °C, meaning that the generator temperature has a minor effect on the reversible entrainment ratio, as show in Figure 3.8.. 3.2 Ejector irreversibilities N o w that the limit for the entrainment ratio of an ideal ejector has been described, it is possible to identify the sources of losses in ejector performance; these losses reduce the valué of the actual entrainment ratio on non-ideal ejectors. Since this ideal process is one without entropy generation (i.e. reversible) all of the sources that genérate entropy w i t h i n the ejector can be called "sources of irreversibiliry".. 36.
(54) This subject has been studied in the past (Arbel, Hershgal, Barak, Sokolov, & Shklyar, 2003) and three main sources were identified: "puré mixing losses", "kinetic energy losses" and "normal shock wave losses". The p u r é mixing and the kinetic energy losses occur simultaneously at the mixing chamber followed by the normal shock wave at the constant área section, as shown in Figure 3.9.. Figure 3.9 Ejector irreversibility sources It is believed that the p u r é mixing losses are due to an energy loss from the shear forcé developed at the interface of the primary and secondary flow streams, and consequently the shear mixing. The mixing process w i t h i n the ejector is accompanied by a velocity gradient w i t h a consequent kinetic energy loss. These losses are proportional to the momentum difference between the primary and secondary fluids at the mixing chamber, Arbel et al. (2003) stated that this type of losses are inherent to the mixing nature of the ejector, so they can only be reduced but not entirely eliminated. The shock w i t h i n the constant área section is defined by the transition of the mixed fluids from a supersonic to a subsonic regime, it occurs over a very thin región and it is characterized by large gradients in fluid properties and produces a sudden change i n pressure.. 37.
Figure


+7


Documento similar
Figure 41: Phase’s space diagram for a test at an angular velocity of 19.36 rpmm Figure 42 shows phase’s plane diagram corresponding to a test at an angular velocity of 14.86
The NaYF 4 host matrix is not only a material of choice for Ln 3+ ions doping because of the reliable and reproducible Figure 1. Energy levels diagram of Yb 3+ ions in NaYF 4
scheme with correction has been proven as accurate as the second order scheme, a double simulation with the standard anisotropic model with
Lo más característico es la aparición de feldespatos alcalinos y alcalino térreos de tamaño centimétrico y cristales alotriomorfos de cuarzo, a menudo en agregados policristalinos,
Imparte docencia en el Grado en Historia del Arte (Universidad de Málaga) en las asignaturas: Poéticas del arte español de los siglos XX y XXI, Picasso y el arte español del
Que en la reumon de la Comisión de Gestión Interna, Delegada del Consejo Social, celebrada el día 17 de marzo de 2011 , con quórum bastante para deliberar y
De esta manera, ocupar, resistir y subvertir puede oponerse al afrojuvenicidio, que impregna, sobre todo, los barrios más vulnerables, co-construir afrojuvenicidio, la apuesta
We propose the adaptation of a monolithic architecture (see Figure 2) to a microservices architecture (see Figure 3) based on the following arguments: (1) It is an architecture
