Effects of additional stimuli on ideafinding in design teams
35
0
0
Texto completo
(2) Page 1 of 34. Journal of Engineering Design Vol. X, No. X, Month 200X, 000–000 A.N. Other Journal of Engineering Design RESEARCH ARTICLE. Effects of additional stimuli on idea-finding in design teams. rP Fo a. Name Surnamea*. Department, University, City, Country. Studying the effects of idea-finding design methods experimentally can provide some light into their degree of usability. An experiment was carried out to study the effects that different stimuli proposed in idea-finding methods have on the design process and outcomes of four design teams, and to compare these effects to those produced by the problem-solving characteristic of the team members. Protocol analysis and outcome-based analysis were carried out. The results of the analysis show that stimuli can have a greater effect on the design activity than the influence of the designers’ problem-solving styles in the conditions of the experiment. Stimulus with SCAMPER questions favours refinement of solutions, by using a solution as a frame and the questions as sub-frames. Stimulus with images (related in shape and function with the designed object, and displayed in intervals of time) leads teams to be in a continuous flux of generation of partial solutions.. ev. rR. ee. Keywords: idea finding; protocol analysis; designing in teams; stimuli. w. Title Page Footnote: _____________________ *Corresponding author. Email: a.other@cam.ac.uk. ie ly. On. 1 2 3 4 5 6 7 8 9 10 11 12 13 14 15 16 17 18 19 20 21 22 23 24 25 26 27 28 29 30 31 32 33 34 35 36 37 38 39 40 41 42 43 44 45 46 47 48 49 50 51 52 53 54 55 56 57 58 59 60. Journal of Engineering Design. URL: http://mc.manuscriptcentral.com/cjen E-mail: jed@metronet.co.uk.
(3) Journal of Engineering Design. 1. Introduction The literature maintains that academic design methods have not had the expected impact in industry (Eder 1998, Frost 1999), because they are difficult to use and difficult to fit into real design sessions in industry (Lindemann 1999). To know how to make them fit, it is necessary to know how designers design in industry and what effects design methods have on designing. This paper focuses on the latter. Different design methods have been proposed for different design stages (Cross 2000), idea-finding, concept evaluation, concept selection, and so on. Here, we study methods created for the idea-finding stage.. rP Fo. A central theme in the numerous idea-finding methods is how creativity in a design group is stimulated. Ideafinding methods can be classified in two groups according to whether the stimulation is originated within the group or outside the group: - Stimulation from within the group. In some methods, the stimulation is essentially achieved by using stimuli generated within the group itself. The ideas, then, generated by the group members play two fundamental roles: they can either be a solution (or a part of a solution) or they can also act as a stimulus in the generation of new ideas. Examples of this type of methods are Brainstorming and its variants, such as Brainstorming with post-it®1 notes (Vehar et al. 1999), Visual Brainstorming (Van der Lugt 2000), Objectual Brainstorming (Van der Lugt 2000), Brainsketching (Van der Lugt 2000), 6-3-5 (Vehar et al. 1999), Card Circulating (Parnes 1992), and Brainwriting Pool (VanGundy 1983).. rR. ee. - Stimulation from outside the group. Other idea-finding methods make use of additional stimuli to arouse group creativity, e.g. Direct Analogy (Davis 1999), where the group is encouraged to seek stimulation from existing solutions to a similar problem, especially from biological principles; Random Input (Davis 1999), where random words or images are used to stimulate the group creativity; and SCAMPER (SubstituteCombine-Adapt-Modify-Put to other uses-Eliminate-Rearrange) (Vehar et al. 1999), where the group seeks stimulation from an idea-prompting checklist.. w. ie. ev. Brainstorming methods, in which stimulation is achieved by using stimuli generated within the group, are extensively used in industry (López-Mesa 2003). Stimuli within the group have largely been studied. Purcell and Gero (1998) studied the role of drawings in the design process and observed the influence they have on the working memory, imagery reinterpretation and metal synthesis. Schütze et al. (2003) found that sketching has a positive impact on the quality of the designed solutions, serves as an aid for analysis, short-term memory, communication and documentation, and is helpful for the development and testing of solutions as well as for the identification of errors. The comparison of the effects of the different means of expressions in brainstorming sessions on the outcomes was undertaken by several researchers (Van der Lugt 2000, Vidal et al. 2004). Van der Lugt (2000) found that sentential variations of the brainstorming tool, where written or spoken, means of expression are used by the participants, perform stronger than graphic variations on the brainstorming tool, such as Brainstorming with sketches added, in terms of quantity and combinations seeking. Vidal et al. (2004) concluded that thought should be given to which brainstorming variant to choose, according to the sought goal of the idea-generation activity. If a wide range of ideas in very diverse fields is sought, then the most suitable is the verbal variant, also called sentential variant. If the aim is to obtain solutions that go further in fulfilling the requirements of the problem, the objectual variant is the most. ly. On. 1 2 3 4 5 6 7 8 9 10 11 12 13 14 15 16 17 18 19 20 21 22 23 24 25 26 27 28 29 30 31 32 33 34 35 36 37 38 39 40 41 42 43 44 45 46 47 48 49 50 51 52 53 54 55 56 57 58 59 60. Page 2 of 34. 1. This article includes a work which is or is asserted to be a proprietary term or trade mark. Its inclusion does not imply it has acquired for legal purposes a non-proprietary or general significance, nor is any other judgment implied concerning its legal status.. URL: http://mc.manuscriptcentral.com/cjen E-mail: jed@metronet.co.uk.
(4) Page 3 of 34. appropriate. With these studies a better understanding of the effects of the means of expressions as triggers for new ideas in brainstorming sessions has been achieved. However, less is known about the effects of additional stimuli in idea finding sessions. Goldschmidt and Smolkov (2006) found that external visual representations, when those are present in the designer’s work environment, affect performance, in terms of practicality, originality and creativity, and that their effects are contingent on the type of the design problem that is being solved. Sarkar and Chakrabarti (2008) studied the effectiveness of different representations of triggers in terms of the number of solutions generated in response to the use of each representation and the evaluation of the number and kind of search spaces generated. However, the influence of additional stimuli on other creativity measures, such as novelty and feasibility, still remains unknown. The goal in this paper is to study their effects, both on the design process and on the creativity of the outcomes, in terms of quantity, variety, novelty and feasibility. 1.1 Creativity. rP Fo. Many different definitions of creativity exist. In the article An analysis of Creativity, Rhodes (1961) analysed the different approaches and concluded that creativity had been defined in four different areas, i.e. person, process, product and press, constituting the so-called 4Ps.. ee. The person strand comprises the characteristics of the people involved. The process strand represents how people create, i.e. the steps, techniques, and tools used to create the product. The product strand represents the kind of product that will result from the creative operation. The press strand refers to the atmosphere where people create. According to Rhodes, each strand has its own identity. They can be explored, theorized, or analysed separately, but an understanding of the creative act can only be done when considering the four strands. The creativity of the product is the result of the creativity of the people that develop it, of the working atmosphere, and of the process. For instance, creative people who follow a creative process may not conceive a creative product if management provokes an uncreative atmosphere exposing the workers’ motivation. Also, an ill-defined process to develop a product can make it difficult for creative people within a creative atmosphere to conceive a good product on time.. w. ie. ev. rR. 1.1.1 Creative product As cited in Magyari-Beck (1991), the term creativity in the product strand was originally applied to exceptional results in arts, science, and politics. Gryskiewics explained what makes exceptional a creative result with his definition of creativity. As cited in Vehar et al. (1999), he defined creativity as whatever is novel and useful. Novel ideas are those created for the first time; useful is what adds value.. ly. On. 1 2 3 4 5 6 7 8 9 10 11 12 13 14 15 16 17 18 19 20 21 22 23 24 25 26 27 28 29 30 31 32 33 34 35 36 37 38 39 40 41 42 43 44 45 46 47 48 49 50 51 52 53 54 55 56 57 58 59 60. Journal of Engineering Design. 1.1.2 Creative person Isaksen (1987) identified a general tendency of people to believe that only gifted, creative people can produce creative results. In the course of investigation, researchers had to admit that all people have a potential to be creative (Magyari-Beck 1991). A constructive approach was proposed by Kirton (1994) with his theory of preferred problem solving style. Its basic principle is that different people solve problems in different ways that do not inherently produce more or less creative results, but are certainly better suited to different problem conditions. Kirton’s theory originated from the identification of individuals in organizations who would tend to conceive good ideas to improve the current system, called adaptors, and individuals who would tend to challenge or change the system, called innovators.. URL: http://mc.manuscriptcentral.com/cjen E-mail: jed@metronet.co.uk.
(5) Journal of Engineering Design. Kirston’s studies showed people being neither absolute adaptors nor absolute innovators, but having intermediate positions in a continuum between such extremes. He explored the traits of highly innovative people and highly adaptive people to identify the preferred problem solving style of people (Kirton 1985). A brief summary of those traits are presented next. Highly adaptive people: - Tend to produce a low number of sound ideas to solve problems. - Tend to pay meticulous attention to detail. - Tend to use approved structures to solve problems. - Are methodological, efficient and disciplined.. rP Fo. Highly innovative people: - Tend to consider a large number of potential ideas. - Tend to have a wide overview of the problem. - Tend to approach the problems from unsuspected angles. - Supply task orientation by questioning existing assumptions.. ee. 1.1.3 Creative process López-Mesa and Thompson (2006) suggested that the Adaptor–innovator principles can be mapped onto the creative process in order to identify the method with the ‘style’ that better suits the problem characteristics. They defined what is meant by ‘adaptive’ and ‘innovative’ when applied to design methods as follows:. rR. - Adaptive methods are those that are appropriate for the improvement of existing solutions. Adaptive divergent methods tend to generate solutions to problems by a process of successive incremental improvements (e.g. brainwriting), or use a systematic framework to search for new combinations of existing sub-solutions (e.g. morphological analysis).. ie. ev. - Innovative methods are those appropriate for the exploration of radical new solutions. They facilitate the search for novel solutions by processes that encourage the breaking of the paradigm (e.g. brainstorming), or by abstract association that does not build on previous solutions (e.g. visual stimuli).. On. 1.2 Hypotheses and objective of the study. w. As mentioned before, the objective of the paper is to study the effects of additional stimuli on the design process and on the creativity of the outcomes. This can provide some light into their degree of usability. The objective was achieved by means of conducting a design experiment, in which the authors tested several hypotheses. These hypotheses are:. ly. 1 2 3 4 5 6 7 8 9 10 11 12 13 14 15 16 17 18 19 20 21 22 23 24 25 26 27 28 29 30 31 32 33 34 35 36 37 38 39 40 41 42 43 44 45 46 47 48 49 50 51 52 53 54 55 56 57 58 59 60. Page 4 of 34. 1. The problem solving style of the group members affects the creativity of the results. This hypothesis is derived from Kirton’s theory of adaptive-innovative problem solving styles (Kirton 1994). It was tested by means of composing design groups with known problem solving styles. 2. The additional stimuli affect the creativity of the results and how the design process unfolds. This hypothesis is based on the assumption that if the means of expression used by design teams affect the outcomes and how the design process unfolds, as found by Vidal et al. (2004), and if the ideas expressed through these means of expressions can be seen as stimuli for new ideas, then different types of additional stimuli should also affect the outcomes and how the design process unfolds. This hypothesis was tested by. URL: http://mc.manuscriptcentral.com/cjen E-mail: jed@metronet.co.uk.
(6) Page 5 of 34. means of exposing design groups to different types of additional stimuli. This hypothesis is further developed in hypotheses 2a and 2b. 2a. Graphical additional stimuli help designers to produce more solutions to the same problem than sentential additional stimuli. This hypothesis is based on the findings by Vidal et al. (2004), according to which graphical means of expression help to produce more solutions to the same problem than sentential means of expression. Sarkar and Chakrabarti (2008) found that this hypothesis is true in their experiments. 2b. Sentential additional stimuli better help designers in further developing solutions than graphical additional stimuli. This hypothesis is based on the findings by Vidal et al. (2004), according to which sentential means of expression help to go further in fulfilling the requirements of the problem.. rP Fo. The experiment also helped to explore how additional stimuli affect the design process, what the authors used to theorise about why the proposed hypotheses were right or not. This was done by the use of protocol analysis techniques, which are further described in the next sections. 2. Research methodology. ee. The research methodology consists of conducting an experiment with different design sessions, and applying a combination of outcome-based and process-based evaluations for its analysis, as suggested by Shah and Vargas-Hernandez (2003) for ideation measures. Comparisons were then made to identify what similar patterns might be observed between the sessions. The outcome-based analysis was mainly useful to verify the hypotheses. The process-based analysis was used by the authors to understand why the hypotheses got verified.. ie. 2.1 Experiment arrangement. ev. rR. Analysing the effects of additional stimuli on the design activity of various experimental sessions is a troublesome task, since both, how the design activity unfolds and the results, can be affected by other factors, such as the people involved (Kirton 1994), their level of experience with the problem (Segers et al. 2005), the means to express ideas (Van der Lugt 2000, Vidal et al. 2004), the problem itself (Goldschmidt and Smolkov 2006) or the working atmosphere. The ideal thing would have been to keep all the factors the same, except for the additional stimuli, in several design sessions and compare the results, but when the same people are involved in several design experiments to solve the same problem, the factor ‘level of experience with the problem’ inevitably varies from one session to another. In fact, no experiment arrangement for comparative analysis allows to having just one of the mentioned factors as variable, while the others are kept fixed. For this reason, we set up an experiment where two factors varied: the people and the additional stimuli. The remaining factors were kept the same for the different sessions.. w. ly. On. 1 2 3 4 5 6 7 8 9 10 11 12 13 14 15 16 17 18 19 20 21 22 23 24 25 26 27 28 29 30 31 32 33 34 35 36 37 38 39 40 41 42 43 44 45 46 47 48 49 50 51 52 53 54 55 56 57 58 59 60. Journal of Engineering Design. 2.1.1 Participants in the experiment and design teams For the experiment, a total of 17 potential participants were gathered. The participants were Engineering Design PhD students or doctors with experience in designing. A broadly researched psychometric test, called the KAI inventory (Kirton 1985, www.kaicentre.com) was used to identify the problem solving style of each potential participant. The result was used to form two innovative teams and two adaptive teams, according to Kirton’s terminology of adaptive and innovative problem solving styles (Table 1).. URL: http://mc.manuscriptcentral.com/cjen E-mail: jed@metronet.co.uk.
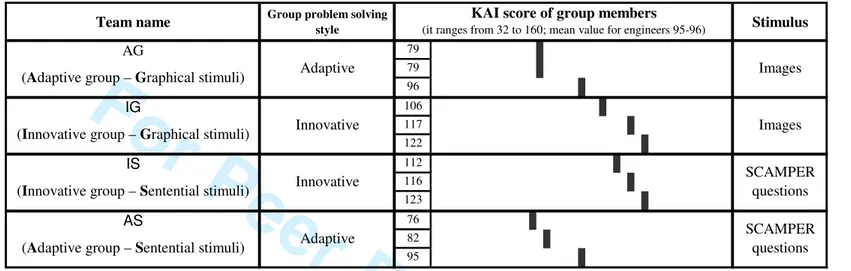
(7) Journal of Engineering Design. Each group was composed of three people and given the same task to solve. The remaining five potential participants were not considered for the experiment analysis. The criterion used to select the final 12 participants was to form groups with the more innovative people for the two innovative teams and with the more adaptive ones for the two adaptive teams. As can be observed in Table 1, the members of the two adaptive groups range from 79 to 96, and from 76 to 95, respectively, whereas the members of the two innovative groups range from 106 to 122, and from 112 to 123, respectively. The remaining five participants were not considered for the study because their KAI score ranged from 96 to 106. 2.1.2 Design task. rP Fo. The task was to generate ideas for a tubular map case allowing for one by one extraction and introduction of maps. 2.1.3 Additional stimuli. The additional stimuli were introduced by means of a computer display, with slides changing every 5 minutes a total of seven times. Each of these five minutes during which the same slide was being displayed is referred as to stimuli episode in this paper. Two types of additional stimuli were used in the experiment:. rR. ee. - Two groups, one innovative and one adaptive, were exposed to only visual images. The images had been previously obtained from the Internet by introducing words related to characteristics linked to the shape and use of the object to be designed.. ev. - The other two groups, one innovative and one adaptive, were exposed to questions of the checklist of creativity stimulating questions developed by Osborn (Vehar et al. 1999) in the SCAMPER method.. ie. Each stimuli episode of 5 minutes contained three images or three questions. The columns with black boxes in Figure 1 represent the stimuli the groups were influenced by. These black boxes are screenshots of the images they could see in the screen. The first black empty box represents the first five minutes, during which there was no additional stimulus; the order of the stimuli was then top-down as in Figure 1. The participants were asked to seek stimulation from the display. The SCAMPER questions of Figure 1 are in Spanish, as seen by the participants. Their translation follows next:. w. ly. - Questions of stimuli episode 2: - What can be blended, mixed, or included? - What if you reverse the assemble? - What are other ways to use it? - Questions of stimuli episode 3: - What can you substitute? - What can be combined? - What else is like a tubular map case? - Questions of stimuli episode 4: - What ideas can you combine? - What can you make bigger, or smaller? - How can you change colour, sound, smell, or touch? - Questions of stimuli episode 5:. On. 1 2 3 4 5 6 7 8 9 10 11 12 13 14 15 16 17 18 19 20 21 22 23 24 25 26 27 28 29 30 31 32 33 34 35 36 37 38 39 40 41 42 43 44 45 46 47 48 49 50 51 52 53 54 55 56 57 58 59 60. Page 6 of 34. URL: http://mc.manuscriptcentral.com/cjen E-mail: jed@metronet.co.uk.
(8) Page 7 of 34. - What parts can you do without? - What parts can you repeat, duplicate, triplicate…? - Does its shape suggest other uses for it? - Questions of stimuli episode 6: - Can it be reversed inside out? - What parts can be longer or thicker? - What parts should be added? - Questions of stimuli episode 7: - What other process of introduction/extraction can be used? - What else is like a classifier? - What if there is no tubular case? - Questions of stimuli episode 8: - How can you make it more compact or shorter? - Can it be turned upside down? - Does its shape suggest other uses for it? 2.1.4 Experiment development. ee. rP Fo. The initial 17 possible participants met initially all together. They first fulfilled the KAI inventory. Then, they were given the initial requirements of the problem along with technical and market data. During 40 minutes, the potential participants read the problem individually and could touch and observe two exemplars of the object that was to be redesigned, namely a tubular map case. Any doubts regarding the initial requirements of the problem were discussed and settled with the whole group.. ev. rR. While the potential participants were given the requirements of the problem, their problem solving style was analysed and the authors of the paper decided upon the composition of the four design groups.. ie. After the 40 minutes, each group of three participants went to a different room where they were given precise instructions on how to proceed. The four sessions were conducted simultaneously for 45 minutes. The first 5 minutes of the idea creation session had no additional stimuli, and then 7 additional stimuli were introduced by means of a computer display every 5 minutes.. w. On. Table 1 represents the name given to the different teams in this paper, the problem solving style of its members, and the type of stimulus they were influenced by. 2.2 Process-based evaluation of the experiment. ly. 1 2 3 4 5 6 7 8 9 10 11 12 13 14 15 16 17 18 19 20 21 22 23 24 25 26 27 28 29 30 31 32 33 34 35 36 37 38 39 40 41 42 43 44 45 46 47 48 49 50 51 52 53 54 55 56 57 58 59 60. Journal of Engineering Design. The process-based evaluation of the influence exerted by the additional stimuli required data collection via protocol studies and analysis using an ideation cognitive model. The model used for analysis is that of designing as a reflective practice, based on Schön’s (1983) theory and further developed as a coding system for analysing the design activity by Valkenburg (2000).. The Reflective Practice theory of designing (Schön 1983) was introduced as an attack on the dominant technical rationality in professional education. Schön argued that the model of training students by charging them up with material that they could apply when entering the industrial world is not a particularly good way. URL: http://mc.manuscriptcentral.com/cjen E-mail: jed@metronet.co.uk.
(9) Journal of Engineering Design. to educate future professionals. He proposed a new theory of professional action by identifying how skilled practitioners responded to situations of uncertainty, uniqueness, and conflict through a combination of intuitive ‘knowing-in-action’, ‘reflection-in-action’, and ‘reflection-on-action’ (Schön 1987). ‘Knowing-inaction’ is the type of knowledge revealed through spontaneous and skilful action, and which is difficult to explain verbally. For instance, a person who expresses how to present an idea in front of an audience more clearly does not necessarily have to be better at presenting ideas than someone who cannot verbalise how he does it. This type of ‘knowing-in-action’ knowledge is proven in action. Schön discusses that professionals design by engaging in a situation without having a full understanding of things before they act. They create their own design situation and engage in situations by making use of their knowing-in-action in a sort of intuitive, routine experience-based process until they come to a situation where the result becomes unexpected. As a response to the surprise, the professional ignores it, or quickly improvises a way out, or reflects upon what has happened. This capacity to respond to surprises through improvisation by readjusting to the new situation is what he calls reflection-in-action. As with knowing-inaction, reflection-in-action is a process that professionals can realise without knowing what they are doing. Reflection-on-action is the action of the person looking back on its previous mindset, strategies, or objectives as a process of self-analysis and evaluation to understand how the previous way of framing the problem has contributed to the unexpected results. Reflection-on-action constitutes an insightful process of learning.. ee. rP Fo. The model was developed into a coding system to analyse group design activity by Valkenburg (2000). It distinguishes basically four types of design actions: naming, framing, moving, and reflecting. Naming is explicitly stating relevant factors of the design problem. Moving is engaging with the situation towards a solution by generating ideas, combining them, evaluating them, sorting information, making an inventory, etc. Reflecting is explicitly expressing a surprise situation. A frame is a perspective from where to look at the problem and, therefore, framing is the action of establishing a frame. Valkenburg modified this model somewhat since it was found to be slightly unreliable due to actions not always being distinguishable. A simplification of the modified coding system model is made in this paper with the aim to increase the reliability. After using the coding systems in several trials, we realised, as Valkenburg did (2000), that the difference between naming and moving is occasionally very weak. For this reason, we did not distinguish between them. Both types of actions are coded as moving. The coding system requires segmenting the whole protocol into episodes where the coder assigns an action. Valkenburg found that both segmenting and identifying frames are subject to some interpretation by the coder. We tried to avoid using the concepts of episodes and frames in a quantitative way for the data analysis, but still made use of them to code the protocol since they constituted a powerful tool in making sense of what has happened in the design process. The protocol analysis consisted of identifying episodes, moves, reflections, and frames, and the links between all these actions. The process and graphical coding (Figure 2) followed for the analysis is as suggested by Valkenburg (2000).. w. ie. ev. rR. ly. On. 1 2 3 4 5 6 7 8 9 10 11 12 13 14 15 16 17 18 19 20 21 22 23 24 25 26 27 28 29 30 31 32 33 34 35 36 37 38 39 40 41 42 43 44 45 46 47 48 49 50 51 52 53 54 55 56 57 58 59 60. Page 8 of 34. 2.3 Outcome-based evaluation Several criteria are considered for the outcome-based evaluation. Shah and Vargas-Hernandez (2003) have proposed to measure novelty, variety, quality, and quantity to evaluate the effectiveness of idea-generation methods: - Novelty is a measure of how unusual or unexpected an idea is as compared to other ideas (Shah and VargasHernandez 2003).. URL: http://mc.manuscriptcentral.com/cjen E-mail: jed@metronet.co.uk.
(10) Page 9 of 34. - Variety is a measure of the explored solution space during the idea generation process. The generation of similar ideas indicates low variety and hence, less probability of finding better ideas in other areas of the solution space (Shah and Vargas-Hernandez 2003). - Quality, in this context, is a measure of the feasibility of an idea and how close it comes to meet the design specifications (Shah and Vargas-Hernandez 2003). - Quantity is the total number of ideas generated. The rationale for this measure is that generating more ideas increases the chance of better ideas (Shah and Vargas-Hernandez 2003).. rP Fo. 2.3.1 Variety and quantity. To measure variety and quantity, the number of global solutions and the number of alternative solutions (or variants) should be considered.. ee. A global solution is understood here, as suggested in (Vidal et al. 2004), as a set made up of one or more ideas that refer to the same solution. All the ideas that are included in one global solution consist of contributions and slight changes to a single solution. The total number of different global ideas allows us to evaluate the diversity of the ideas generated. The more global ideas obtained, the higher the number of different types of solutions that have been produced (Vidal et al. 2004). Initially, to identify global solutions and their different variants, the genealogy tree suggested by Shah and Vargas-Hernandez (2003) was used. This tree distinguishes different levels of solution differentiation: physical principle, working principle, embodiment, and detail. All the ideas with the same physical principle were considered to belong to the same global solution. Variants of the same global solution are those that present differences between them at the working principle, embodiment or detail levels, but have the same physical principle.. ie. ev. rR. However, this method of classification did not provide sufficient reliability between different coders so as to continue with it. Another method of classification of solutions was considered. This second method responds to the levels of abstraction defined by Deng (2002): - The highest level, called purpose function, describes the designer’s intention. - The next level, called action function, describes the desired behaviours and it is operation-oriented. Based on this level, designers can guarantee the achievement of an intention. - The lowest level, called structure, represents the way the action function is transformed in material form.. w. ly. On. 1 2 3 4 5 6 7 8 9 10 11 12 13 14 15 16 17 18 19 20 21 22 23 24 25 26 27 28 29 30 31 32 33 34 35 36 37 38 39 40 41 42 43 44 45 46 47 48 49 50 51 52 53 54 55 56 57 58 59 60. Journal of Engineering Design. A global solution is, with this second method, a solution that shares the same action function. For example, for the purpose function ‘allow for one-by-one extraction of the maps’, action functions are ‘devices securing the diameter of concentrically rolled up maps’, and ‘divisions inside the case for individual rolls storage’. Variants of the same global solution are those that present the same action function, but different structures. Examples of different structures for ‘divisions inside the case for individual rolls storage’ are shown in Figure 3 (global solution 3 for team AG). Two levels of definition of this material form are considered, conceptual structure and detail structure. Within conceptual structure, the solutions are classified in two levels of hierarchy (conceptual structures 1 and 2). The reason for distinguishing between two sub-levels at the structure level is that different coders could not agree upon whether certain variations in a global solution belonged to the conceptual or to the detail levels. This type of variations always had the characteristic of being solutions to a problem encountered within a given structure. For example, for the global solution ‘divisions. URL: http://mc.manuscriptcentral.com/cjen E-mail: jed@metronet.co.uk.
(11) Journal of Engineering Design. inside the case for individual rolls storage’, and the structure ‘grill for the divisions’, various variants were generated: - The first variant was that the grill had square divisions. - The second had round divisions, but one of the team members realised that this way it would be more difficult to extract the maps. - A third variant was mentioned with triangular divisions and both the first and third were considered, by the design team AS, to offer less resistance to maps extraction, than the variant of round divisions. The three variants were classified in the conceptual structure 2 level because the team was observed to consider them as different responses to the encountered problem ‘resistance to maps extraction’ of the conceptual structure 1 ‘grill for the divisions’.. rP Fo. To conclude, for the classification of solutions the following levels of abstraction were used: - Action function, which describes operation-oriented desired behaviours of a solution. - Conceptual structure 1, which represents a way in which the action function is transformed in material form. - Conceptual structure 2, which represents a way of transforming the action function in material form, at the same time that problems associated with the structure itself are dealt with. - Detail structure, which includes ideas given to detail aspects of a global solution.. ee. 2.3.2 Novelty. rR. Novelty is a relative term: there is for example newness with respect to the current paradigm and newness with respect to what others can produce (or non-obviousness, Redelinghuys 2000). The relativity of novelty has also been by pointed out by other authors (Chakrabarti and Khadilkar 2003).. ev. 2.3.2.1 Novelty with respect to the current paradigm. Since in Kirton’s definition of innovators, doing things differently is a key aspect, measuring the outcomes newness with respect to the current paradigm became one of the important measures to consider regarding novelty. The measure was realised by assigning to each design alternative produced a change type of the following four change type patterns: - Type 1: New parts are added to the tubular case to change its characteristics. - Type 2: The tubular case is changed so much that it is not a tubular case any more. - Type 3: The change involves changes even in the characteristics of the paper. - Type 4: The whole system changes.. w. ie. On. Then, the number of alternatives falling in the different change types is counted for each team. To be able to compare the results between the different teams, the relative number of alternatives for each type of change is calculated with respect to the total number of alternatives produced by each team.. ly. 1 2 3 4 5 6 7 8 9 10 11 12 13 14 15 16 17 18 19 20 21 22 23 24 25 26 27 28 29 30 31 32 33 34 35 36 37 38 39 40 41 42 43 44 45 46 47 48 49 50 51 52 53 54 55 56 57 58 59 60. Page 10 of 34. The change types 4 and 3 are more revolutionary than 2 and 1. Therefore, the higher the percentage of change types 4 and 3, the higher the novelty of the team behaviour will be considered. 2.3.2.2 Non-obviousness The methodology followed is the one proposed by López-Mesa et al. (2005) and López-Mesa and Vidal (2006).. URL: http://mc.manuscriptcentral.com/cjen E-mail: jed@metronet.co.uk.
(12) Page 11 of 34. Obvious solutions are those that, even if being far from the current paradigm, can be thought of by most people. In the case of this experiment obvious solutions were those produced by all teams. Non-obvious solutions are solutions which few teams thought about. Therefore, the lower the number of teams that produce a solution, the higher the level of non-obviousness of this solution is. Solutions can have four levels of non-obviousness in this experiment: solutions produced by just one team, solutions produced by two teams, solutions produced by three teams, and solutions produced by the four teams. It was observed in the analysis of non-obviousness of solutions of the four teams that no solution of a team was equal to any of the solutions of the other teams in all respects. Therefore, what was analysed was similarity and not equality. The novelty of solutions was explored, by identifying the similarities of every alternative solution of a team with every alternative solution of the other teams at the levels of action Function (F), conceptual Structure (S), and Detail structure (D). Once all similarities were found, the total number of teams having this solution or a similar one at F level was counted, as well as the total number of teams having this solution or a similar one at S level, and the total number of teams having this solution at D level.. ee. rP Fo. Finally, for each team, we calculated the percentage of solutions of the team, which had only been produced by: - This team at F level, at S level, and at D level. - This team and another one at F level, at S level, and at D level. - This team and two more at F level, at S level, and at D level. - The four teams at F level, at S level, and at D level. 2.3.2 Feasibility. ev. rR. The quality of a solution developed at a conceptual level is to a large extent related to its feasibility (Shah and Vargas-Hernandez 2003). Feasibility is a subjective measure when solutions are developed at a conceptual level. In the search for objectivity of this measure, two parameters that may not give an exact measure of feasibility were chosen, though they have a potential to be positively correlated to it: refinement level measured in time dedicated to a solution and rate of attended reflections (using reflection in Schön’s terms, as suggested in Valkenburg 2000, i.e. explicitly expressing a surprise situation).. w. ie. On. Reflections were upon solutions and the process of designing. The reflections upon solutions are named solution-related reflections in this paper. Reflections are important in design because they represent the moments in which design teams realise about where their previous frames, assumptions and knowledge have conducted them. However, the important reflections in a team design process are those that the team gives importance to, by responding to it. We call them attended reflections. To calculate the rate of attended reflections, it was necessary to firstly count the number of solution-related reflections, secondly count the number of attended solution-related reflections, and finally divide the latter by the number of alternatives.. ly. 1 2 3 4 5 6 7 8 9 10 11 12 13 14 15 16 17 18 19 20 21 22 23 24 25 26 27 28 29 30 31 32 33 34 35 36 37 38 39 40 41 42 43 44 45 46 47 48 49 50 51 52 53 54 55 56 57 58 59 60. Journal of Engineering Design. Table 2 summarises the criteria and measures considered for the outcome-based evaluation of the stimuli.. URL: http://mc.manuscriptcentral.com/cjen E-mail: jed@metronet.co.uk.
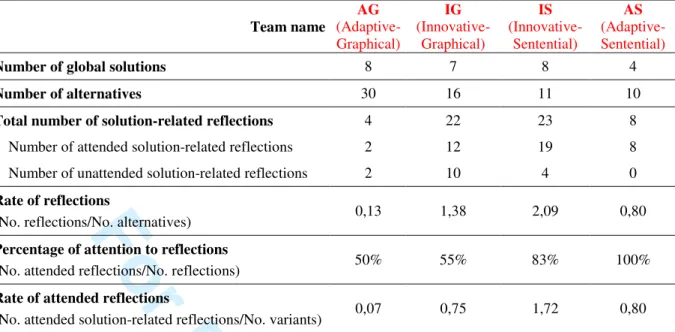
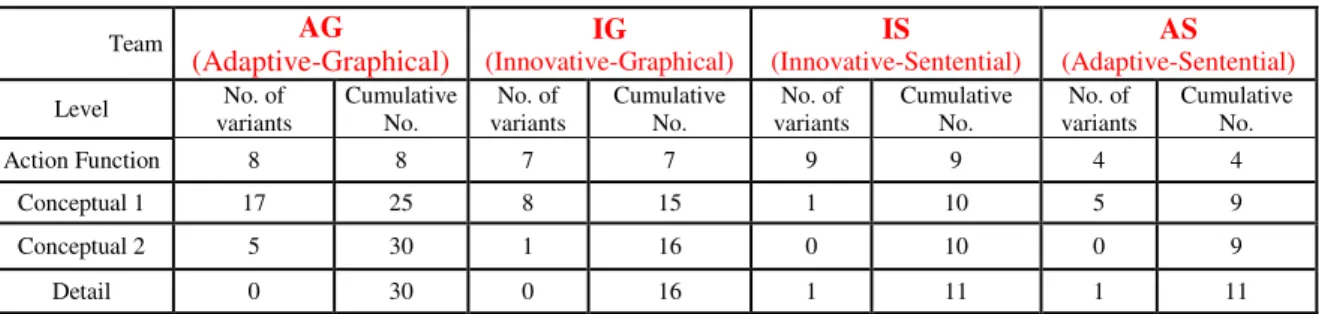
(13) Journal of Engineering Design. 3. Results 3.1 Quantity of solutions The solutions generated by each team were identified and classified using the concepts action function (F), conceptual structure, and detail structure (Table 3). The alternative solutions produced by a team with a similar action function belong to the same global solution, to which a number is assigned. The different alternatives within the same global solution of a team are then distinguished by a letter following the number. Different variants within the same global solution of a team can be different at the levels of conceptual structure 1 (C1), conceptual structure 2 (C2), or detail structure (D) (Table 3).. rP Fo. During the classification of solutions, it was observed that similar (and not identical) alternative solutions produced by different teams may belong to different global solutions. For example, the solution of a tubular case that is opened longitudinally into two half-cylindrical shapes (Figure 4) was proposed as a solution by teams IG and AG. For team IG, it is considered an alternative solution to the global solution ‘ways to assemble thin tubular cases for individual maps’. For the team AG, the tubular case also be opened longitudinally into two halves, but how the papers were stored was different than from that of team IG, and appeared as a new global solution at the action function level for the team. Therefore, in this coding system global solutions are team-specific and depend on the alternative solutions produced by the team. The numbers given to the global solutions for the different teams are independent of each other, and follow the temporal order of appearance in each team. The resultant proposed classification of solutions responds to how the teams were observed to consider what global solution their alternative solutions belonged to.. ev. rR. ee. Table 4 presents, among other things, the total number of alternative solutions produced by the teams. The two teams with graphical stimuli (AG and IG) produced significantly more variants than the two teams with sentential stimuli (IS and AS). Therefore, we can conclude that the hypothesis 2a is verified, as it had also been observed by Sarkar and Chakrabarti (2008).. w. ie. On the other hand, the two innovative teams (IG and IS) produced fewer variants with respect to the adaptive teams using the same stimuli (AG and AS, respectively), which is the opposite of what we could expect according to Kirton’s theory. 3.2 Variety of solutions. ly. Table 4 also presents the total number of global solutions.. On. 1 2 3 4 5 6 7 8 9 10 11 12 13 14 15 16 17 18 19 20 21 22 23 24 25 26 27 28 29 30 31 32 33 34 35 36 37 38 39 40 41 42 43 44 45 46 47 48 49 50 51 52 53 54 55 56 57 58 59 60. Page 12 of 34. The two innovative teams (IG and IS) and the adaptive team with graphical stimuli (AG) produced significantly more global ideas than the adaptive team with sentential stimuli (AS). We could conclude that graphical stimuli help adaptive teams to increase the variety of solutions considered, but we would need to contrast these results with more experiments to confirm this asseveration. Table 5 shows the number of variants produced by each team at the different levels of abstraction. In terms of variety, teams inspired by images had a strong tendency to produce subsequent ideas that consider other similar ways to obtain the same action function as with a suggested solution, leading to numerous solution. URL: http://mc.manuscriptcentral.com/cjen E-mail: jed@metronet.co.uk.
(14) Page 13 of 34. alternatives at conceptual structure level. Teams inspired by SCAMPER questions tended not only to vary construction at the conceptual structure level, but also produce subsequent ideas that further developed a suggested solution, here named solution refinement. Figure 3 shows the drawings of the most developed global solution of group IS (Innovative-Sentential group) in terms of time, and of the most developed solution alternatives produced by group AG (Adaptive-Graphical group), illustrating the idea of solution refinement of groups with sentential stimuli as opposed to variety construction of groups with graphical stimuli. 3.3 Feasibility of solutions In measuring solutions feasibility, the number of reflections was considered. Reflections were coded when teams explicitly expressed a surprise situation. Figure 1 shows when the reflections took place.. rP Fo. The number of solution-related reflections is given in Table 4, and it shows that innovative teams reflect more often than adaptive teams. Whereas the total number of solution-related reflections for the innovative team with graphical stimuli (IG) was 22, and 23 for the innovative team with sentential stimuli (IS), the adaptive teams (AG and AS) had only 4 and 8 reflections.. ee. The rate of attention to reflections is also remarkable. Whereas the teams inspired by SCAMPER questions tried to find solutions or reframe the problem when surprises were found on most occasions (83% and 100% of the times for teams IS and AS), the teams inspired by images did not always engage into solving those uncertainties (50% and 55% of attended reflections for teams AG and IG) (Table 4).. rR. With these measures, number of solution-related reflections and rate of attention to reflections, hypothesis 1 was verified. It was proved that the problem solving style affects the creativity of the results, in terms of reflections. However, since teams using SCAMPER questions pay more attention to reflections, the resulting rate of attended reflections shows that: - The team with more potentially feasible solutions is the innovative one using SCAMPER (team IS) with a rate of 1,72. - The team with less potentially feasible solutions is the adaptive one using images (team AG), with a rate of 0,07. - The other two teams behave similarly regarding the rate of attended reflections.. w. ie. ev. On. Still, a more significant difference is observed when the time of dedication for each alternative solution is analysed. Figure 5 displays the time dedicated to each solution alternative. The curves of groups influenced by SCAMPER questions (IS and AS) present high peaks, which means that they showed preference for a solution to which the group dedicated time to develop further, whereas groups influenced by images (AG and IG) were in a continuous flux of solution alternatives generation.. ly. 1 2 3 4 5 6 7 8 9 10 11 12 13 14 15 16 17 18 19 20 21 22 23 24 25 26 27 28 29 30 31 32 33 34 35 36 37 38 39 40 41 42 43 44 45 46 47 48 49 50 51 52 53 54 55 56 57 58 59 60. Journal of Engineering Design. Using the measure time of dedication to variants, hypothesis 2b was verified. When it came to developing solutions, sentential additional stimuli proved to be of more use to designers than graphical additional stimuli. This is because the former allow teams to dedicate the time they need to develop solutions, whereas the latter make teams continuously change the solution.. URL: http://mc.manuscriptcentral.com/cjen E-mail: jed@metronet.co.uk.
(15) Journal of Engineering Design. 3.4 Novelty of solutions 3.4.1 Novelty with respect to the current paradigm Among the change types previously described, 4 and 3 are more revolutionary than 2 and 1. Therefore, the higher the percentage of change types 4 and 3, the higher the novelty of the outcomes of the team behaviour. The expected possible patterns were: - Since innovative individuals, according to the KAI inventory, prefer to solve the problems by doing things differently, it was expected that the two innovative teams would produce more solutions of type 4 and 3 than the adaptive teams.. rP Fo. - Another expected possible pattern was that the influence of the methods was so important that two teams (one innovative and one adaptive) using the same method (presumably SCAMPER) would produce more novel solutions (of type 3 or 4) than the others.. ee. Surprisingly, none of these possibilities was found. In fact, as shown in Table 6, no trend could be drawn on the influence of people’s problem solving style or type of stimuli on the novelty of solutions. The teams with higher novelty behaviour (highlighted grey) are one innovative team and one adaptive team using different methods. 3.4.2 Non-obviousness. ev. rR. The percentage of solutions of a team that have been produced by just one, two, three or the four teams is represented in Figure 6 for the action function level, and in Figure 7 for the structure level.. ie. In Figure 6, above the mean behaviour dotted line, the behaviour of the team is innovative in comparison with the rest of the teams. In Figure 7, below the mean behaviour dotted line, the behaviour of the team is innovative in comparison with the rest of the teams.. w. The influence of the problem solving style of the teams can be observed regarding non-obviousness at the action function level (Figure 6). According to results, the teams behaviour is ordered from the highest level of non-obviousnes (highest novelty) at F level to the lowest level as follows:. On. 1. The team with less obvious ideas was team IS, innovative team using SCAMPER. 2. The second team with less obvious ideas was IG, innovative team using visual stimuli. 3. The third team with less obvious ideas was AS, adaptive team using SCAMPER. 4. The team with more obvious ideas was AG, adaptive team using visual stimuli.. ly. 1 2 3 4 5 6 7 8 9 10 11 12 13 14 15 16 17 18 19 20 21 22 23 24 25 26 27 28 29 30 31 32 33 34 35 36 37 38 39 40 41 42 43 44 45 46 47 48 49 50 51 52 53 54 55 56 57 58 59 60. Page 14 of 34. Therefore, innovative teams produce a higher percentage of non-obvious solutions than adaptive teams at the action function level. SCAMPER questions also help teams to produce non-obvious solutions at the action function level, since the two types of teams, innovative and adaptive, produce a higher percentage of nonobvious solutions when inspired by SCAMPER. However, it is important to mention that the problem-solving style of designers is a more determinant factor in the non-obviousness of solutions than the method used, in the conditions of the experiment.. URL: http://mc.manuscriptcentral.com/cjen E-mail: jed@metronet.co.uk.
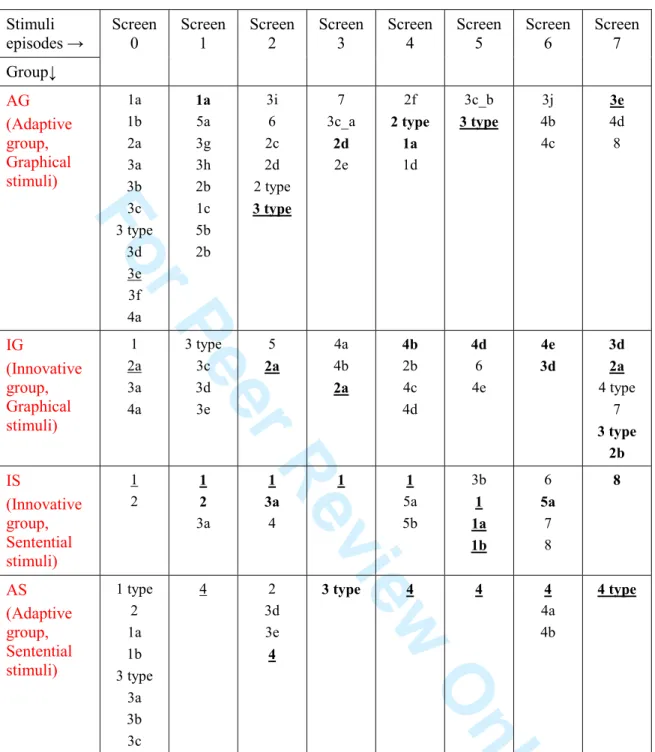
(16) Page 15 of 34. At the conceptual structure level, the influence of the problem solving style is not observed, but the influence of the method is observable (Figure 7). According to results, the teams behaviour is ordered from the highest level of non-obviousness (highest novelty) at structure level to the lowest level as follows: 1. The team with less obvious ideas at the structure level was AG, adaptive team using visual stimuli. 2. The second team with less obvious ideas was IG, innovative team using visual stimuli. 3. The third team with less obvious ideas was IS, innovative team using SCAMPER. 4. The team with more obvious ideas was AS, adaptive team using SCAMPER Therefore, the level of non-obviousness is higher for teams using visual stimuli at the structure level. This may be due to the fact that visual stimuli helped teams to create many solution alternatives at the conceptual structure level.. rP Fo. 3.5 Results from the process-based evaluation The moments of appearance and development of the alternative solutions are indicated in the mapped processes, in Figure 1, as well as in Table 7, which shows the order of appearance and development of the alternative solutions identified for the four groups.. ee. Figure 1 and Table 7 also show that teams influenced by images produced a major number of solution alternatives, whereas groups influenced by SCAMPER questions presented major refinement of solutions.. rR. In Table 7, it is observed that groups inspired by SCAMPER questions keep developing or retake selected solution alternatives during more stimuli episodes than groups inspired by images (retaken alternatives are bold). Groups IS and AS (groups with sentential stimuli) developed solutions 1 and 4 during six of the eight episodes. The alternative solutions retaken more times by teams AG (solution 3e) and IG (solution 2a) (groups with graphical stimuli) were developed during four stimuli episodes out of eight. The alternative solutions retaken more times by each group are underlined in Table 7.. w. ie. ev. How the design activity unfolded in the four cases to solve the problem of generating ideas for a tubular map case that allows for one-by-one extraction/introduction of maps, was mapped out through the use of the reflective coding system. The results of this mapping are found in Figure 1.. On. In Figure 1, it can be observed that whereas the SCAMPER questions can be used as sub-frames within the frame of a specific solution to develop it further (see the grey boxes of frames inside other grey boxes), the images make the group jump from one solution principle to another.. ly. 1 2 3 4 5 6 7 8 9 10 11 12 13 14 15 16 17 18 19 20 21 22 23 24 25 26 27 28 29 30 31 32 33 34 35 36 37 38 39 40 41 42 43 44 45 46 47 48 49 50 51 52 53 54 55 56 57 58 59 60. Journal of Engineering Design. The frames that were used during the design activities by the different groups are in Tables 8 and 9. The frames used by groups inspired by images are (Table 8): - Frame-ideas (ideas for further exploration), such as F1-F6, F8-12 for team IG, and F1, F2, F4-F7, F9 for team AG. - Frames with an inquiring character, such as F7 for team IG, and F3, F8, F11 for team AG. - Frames to propose how to proceed, such as F13 for team IG and F10 for AG. The teams inspired by SCAMPER questions are characterised by (Table 9): - A higher number of inquiring frames (F3, F5, F8, F12, F14, F16 for team IS, and F4, F6, F8, F9, F12 for team AS) mostly from the SCAMPER questions. URL: http://mc.manuscriptcentral.com/cjen E-mail: jed@metronet.co.uk.
(17) Journal of Engineering Design. - Having frame-ideas containing other sub-frames that help to develop the idea further, namely frames 1 and 4 for team IS and frame 13 for team AS (Figure 1 and Table 9). These three solutions are the three highest peaks of Figure 5. The frames coded in bold in Table 9 are those originating from the SCAMPER questions. 5. Conclusions The outcome-based and process-based analysis of an experiment with design teams exposed to different creativity stimuli allowed for the effects of those stimuli on the process of idea generation to be identified, and compared to the effects of the problem-solving characteristic of the team members.. rP Fo. It was observed that the teams inspired by SCAMPER questions: - Keep developing or retake selected solution alternatives during more stimulus episodes than groups inspired by images. - Show preference for a solution to which the group dedicates time to develop further. - Can use the SCAMPER questions within the frame of a frame-idea as a sub-frame to produce subsequent ideas that further develop the idea. - Consider detail aspects of solutions and think about alternative solutions at this level. - Engage in searching for solutions to uncertain design situations (reflections).. ee. Whereas the teams inspired by images were observed to: - Be in a continuous flux of solution alternatives generation. - Use the images to produce subsequent ideas that consider other ways to obtain a similar action function as with a suggested solution, leading to numerous solution alternatives at the conceptual structure level. - Do not engage in detail aspects of solutions. - Ignore uncertain design situations half of the times.. ev. rR. The influence exerted by the teams’ problem-solving style was mainly observed regarding the frequency of reflections and the percentage of non-obvious solutions generated at the action function level. Surprisingly, the influence on number of solutions was not observable.. w. ie. For these reasons, this experiment shows that stimuli can have an important effect on the design activity, sometimes greater than the influence of the designers’ problem-solving style. It was so in the conditions of the experiment, in which the teams were asked to seek stimulation from the display and they did, and in terms of the creativity measures proposed. Stimulus with SCAMPER questions favours refinement of solutions, by using a solution as a frame and the questions as sub-frames. Stimulus with images (related in shape and function with the designed object displayed in intervals of time) favours the generation of numerous partial solutions, which the group does not further explore.. ly. On. 1 2 3 4 5 6 7 8 9 10 11 12 13 14 15 16 17 18 19 20 21 22 23 24 25 26 27 28 29 30 31 32 33 34 35 36 37 38 39 40 41 42 43 44 45 46 47 48 49 50 51 52 53 54 55 56 57 58 59 60. Page 16 of 34. Thought should be given to what type of stimuli to provide to design teams and what cognitive styles to gather for the teams, according to the sought goal of the idea generation activity: - When quantity of solutions is sought, then teams should be triggered with visual stimuli. - When variety and non-obviousness of solutions is sought: - If variety and non-obviousness is sought at the action function level, then innovative teams should be formed, and they should preferably be triggered with sentential stimuli. - If variety and non-obviousness is sought at the conceptual structure level, then teams should be triggered with visual stimuli. - When a high rate of reflections is sought innovative groups using sentential stimuli should be formed.. URL: http://mc.manuscriptcentral.com/cjen E-mail: jed@metronet.co.uk.
(18) Page 17 of 34. - When we want to let teams use their own frame while being triggered with additional stimuli, then sentential stimuli are advisable.. Further investigation should include how images could be displayed more effectively, thereby allowing not only for variety construction at the conceptual level, but also for solution refinement. It should also include comparisons between teams with and without additional stimulation. References. rP Fo. Chakrabarti, A., Khadilkar, P., 2003, A measure for assessing product novelty, CD-rom Proceedings of the International Conference on Engineering Design ICED03, Stockholm, August 19-21, 2003. Cross, N., 2000, Engineering design methods, New York: John Wiley & Sons. Davis, G.A., 1999, 4th ed., Creativity is forever, USA: Kendall/Hunt Publishing Company. Deng, Y.-M., 2002, Function and behaviour representation in conceptual mechanical design”, Artificial Intelligence for Engineering Design, Analysis and Manufacturing, 16, 343-362. Eder, W.E., 1998, Design modelling – A design science approach (and why does industry not use it?). Journal of Engineering Design, 9, 355-371. Frost, R.B., 1999, Why does industry ignore design science? Journal of Engineering Design, 10, pp. 301-304. Goldsmicht, G., Smolkov, M., 2006, Variances in the impact of visual stimuli on design problem solving performance, Design Studies, 27, 549-569. Isaksen, S. G., 1987, Educational implications of creativity research: An updated rationale for creative learning. In Innovation: A cross-disciplinary perspective, edited by G. Kaufmann and K. Gronhaug. NY: Wiley. Kirton, M.J., 1985, 1992, 1999, Kirton Adaption-Innovation Inventory. Feedback Booklet. Kirton, M.J., 1994, Adaptors and innovators. Styles of creativity and problem solving. London: Routledge. Lindemann, U., 1999, A model of design processes of individual designers. In: U. Lindemann, H. Birkhofer, H. Meerkamm, S. Vajna, ed. International Conference on Engineering Design ICED99, August 24-26. Munich: Technical University of Munich. López-Mesa, B., 2003, Selection and Use of Engineering Design Methods using Creative Problem Solving Principles, Licentiate thesis. Luleå University of Technology. López-Mesa, B.,2004, The use and suitability of design methods in practice. Considerations of problemsolving characteristics and the context of design. Thesis (PhD), Lulea University of Technology (Sweden). López-Mesa, B., Mulet, E., Vidal, R., Bellés, M.J., Thompson, G., 2005, Creativity in people vs in methods. Proceedings of IX Congreso Internacional de Ingeniería de Proyectos. Málaga, España. López-Mesa, B., Thompson, G., 2006, On the significance of cognitive style and the selection of appropriate design methods, Journal of Engineering Design, 17 (4), 371-386. López-Mesa, B., Vidal, R., 2006, Novelty metrics in Engineering Design Experiments, Proceedings of the International Design Conference – Design 2006, Dubrovnik - Croatia, May 15 - 18, 2006. Magyari-Beck, I., 1991, Dignity of creative studies, retrieved January 16, 2003 from the World Wide Web: http://www.buffalostate.edu/centers/creativity/Resources/Reading_Room/Magayari-Beck-91.html Parnes, S.J., editor, 1992, Source book for creative problem-solving. A fifty digest of proven innovation processes, New York: the Creative Education Foundation Press. Purcell, A.T., Gero, J.S., 1998, Drawings and the design process, Design Studies, 19 (4), 389-430. Redelinghuys, C., 2000, Proposed criteria for the detection of invention in engineering design, Journal of Engineering Design, 11, 265-282.. w. ie. ev. rR. ee. ly. On. 1 2 3 4 5 6 7 8 9 10 11 12 13 14 15 16 17 18 19 20 21 22 23 24 25 26 27 28 29 30 31 32 33 34 35 36 37 38 39 40 41 42 43 44 45 46 47 48 49 50 51 52 53 54 55 56 57 58 59 60. Journal of Engineering Design. URL: http://mc.manuscriptcentral.com/cjen E-mail: jed@metronet.co.uk.
(19) Journal of Engineering Design. Rhodes, M., 1961, An analysis of creativity, Phi Delta Kappan, 42, 305-310. Sarkar, P., Chakrabarti, A., 2008, The effect of representation of triggers on design outcomes, Artificial Intelligence for Engineering Design, Analysis and Manufacturing, 22, 101-117. Schön, D. A., 1983, The reflective practitioner. New York: Basic Books. Schön, D. A., 1987, Educating the Reflective Practitioner. New York: Basic Books. Schütze, M., Sachse, P., Römer, A., 2003, Support value of sketching in the design process, Research in Engineering Design, 14 (2), 89-97. Segers, N.M., de Vries, B., Achten, H.H., 2005, Do word graphs stimulate design?, Design Studies, 26, 625647. Shah, J., and Vargas-Hernandez, N., 2003, Metrics for measuring ideation effectiveness, Design Studies, 24, 111-134. Valkenburg, R. C., 2000, The Reflective Practice in product design teams. Thesis (PhD). Delft University of Technology. Van der Lugt, R., 2000, Developing a graphic tool for creative problem solving in design groups, Design Studies, 21, 505-522. VanGundy, A.B., 1983, 108 ways to get a bright idea, London: Prentice-hall. Vehar J., Miller B., and Firestien R., 1999, 2nd edition, Creativity Unbound. An introduction to Creative Problem Solving (Innovation Systems Group). Vidal, R., Mulet, E., Gómez-Senent, E., 2004, Effectiveness of the means of expression in creative problemsolving in design groups. Journal of Engineering Design, 3, 285-298.. w. ie. ev. rR. ee. rP Fo. ly. On. 1 2 3 4 5 6 7 8 9 10 11 12 13 14 15 16 17 18 19 20 21 22 23 24 25 26 27 28 29 30 31 32 33 34 35 36 37 38 39 40 41 42 43 44 45 46 47 48 49 50 51 52 53 54 55 56 57 58 59 60. Page 18 of 34. URL: http://mc.manuscriptcentral.com/cjen E-mail: jed@metronet.co.uk.
(20) Page 19 of 34. w. ie. ev. rR. ee. rP Fo Design process of the four teams 237x297mm (300 x 300 DPI). ly. On. 1 2 3 4 5 6 7 8 9 10 11 12 13 14 15 16 17 18 19 20 21 22 23 24 25 26 27 28 29 30 31 32 33 34 35 36 37 38 39 40 41 42 43 44 45 46 47 48 49 50 51 52 53 54 55 56 57 58 59 60. Journal of Engineering Design. URL: http://mc.manuscriptcentral.com/cjen E-mail: jed@metronet.co.uk.
(21) Journal of Engineering Design. w. ie. ev. rR. ee. rP Fo Graphical coding 14x18mm (600 x 600 DPI). ly. On. 1 2 3 4 5 6 7 8 9 10 11 12 13 14 15 16 17 18 19 20 21 22 23 24 25 26 27 28 29 30 31 32 33 34 35 36 37 38 39 40 41 42 43 44 45 46 47 48 49 50 51 52 53 54 55 56 57 58 59 60. Page 20 of 34. URL: http://mc.manuscriptcentral.com/cjen E-mail: jed@metronet.co.uk.
(22) Page 21 of 34. rP Fo. Solution refinement vs. variety construction 184x66mm (300 x 300 DPI). w. ie. ev. rR. ee ly. On. 1 2 3 4 5 6 7 8 9 10 11 12 13 14 15 16 17 18 19 20 21 22 23 24 25 26 27 28 29 30 31 32 33 34 35 36 37 38 39 40 41 42 43 44 45 46 47 48 49 50 51 52 53 54 55 56 57 58 59 60. Journal of Engineering Design. URL: http://mc.manuscriptcentral.com/cjen E-mail: jed@metronet.co.uk.
(23) Journal of Engineering Design. rP Fo. Tubular case opened longitudinally into two half-cylindrical shapes 24x10mm (300 x 300 DPI). w. ie. ev. rR. ee ly. On. 1 2 3 4 5 6 7 8 9 10 11 12 13 14 15 16 17 18 19 20 21 22 23 24 25 26 27 28 29 30 31 32 33 34 35 36 37 38 39 40 41 42 43 44 45 46 47 48 49 50 51 52 53 54 55 56 57 58 59 60. Page 22 of 34. URL: http://mc.manuscriptcentral.com/cjen E-mail: jed@metronet.co.uk.
(24) Page 23 of 34. rR. ee. rP Fo Time of dedication to solution alternatives 120x72mm (600 x 600 DPI). w. ie. ev ly. On. 1 2 3 4 5 6 7 8 9 10 11 12 13 14 15 16 17 18 19 20 21 22 23 24 25 26 27 28 29 30 31 32 33 34 35 36 37 38 39 40 41 42 43 44 45 46 47 48 49 50 51 52 53 54 55 56 57 58 59 60. Journal of Engineering Design. URL: http://mc.manuscriptcentral.com/cjen E-mail: jed@metronet.co.uk.
(25) Journal of Engineering Design. rR. ee. rP Fo Percentage of solutions of each team that have been produced by just one, just two, three or the four teams at the action function level 120x72mm (600 x 600 DPI). w. ie. ev. ly. On. 1 2 3 4 5 6 7 8 9 10 11 12 13 14 15 16 17 18 19 20 21 22 23 24 25 26 27 28 29 30 31 32 33 34 35 36 37 38 39 40 41 42 43 44 45 46 47 48 49 50 51 52 53 54 55 56 57 58 59 60. Page 24 of 34. URL: http://mc.manuscriptcentral.com/cjen E-mail: jed@metronet.co.uk.
(26) Page 25 of 34. rR. ee. rP Fo Percentage of solutions of each team that have been produced by just one, just two, three or the four teams at the conceptual structure level 119x72mm (600 x 600 DPI). w. ie. ev. ly. On. 1 2 3 4 5 6 7 8 9 10 11 12 13 14 15 16 17 18 19 20 21 22 23 24 25 26 27 28 29 30 31 32 33 34 35 36 37 38 39 40 41 42 43 44 45 46 47 48 49 50 51 52 53 54 55 56 57 58 59 60. Journal of Engineering Design. URL: http://mc.manuscriptcentral.com/cjen E-mail: jed@metronet.co.uk.
(27) Journal of Engineering Design. 1 2 3 4 5 6 7 8 9 10 11 12 13 14 15 16 17 18 19 20 21 22 23 24 25 26 27 28 29 30 31 32 33 34 35 36 37 38 39 40 41 42 43 44 45 46 47. KAI score of group members. Group problem solving style. Team name. (it ranges from 32 to 160; mean value for engineers 95-96). Fo. (Adaptive group – Graphical stimuli). Adaptive. Images. 79 96. IG. 106. rP. (Innovative group – Graphical stimuli). Innovative. (Adaptive group – Sentential stimuli). Images. 117 122 112. ee. (Innovative group – Sentential stimuli) AS. Stimulus. 79. AG. IS. Page 26 of 34. Innovative. SCAMPER questions. 116 123. rR. Adaptive. 76. SCAMPER questions. 82 95. ev. Table 1. Teams’ arrangement. iew. On. ly. URL: http://mc.manuscriptcentral.com/cjen E-mail: jed@metronet.co.uk.
(28) Page 27 of 34. Criteria to evaluate the effectiveness of idea-generation methods. Definition. Measures. Variety. Diversity of solutions considered. Number of global solutions. Quantity. Amount of solutions considered. Number of variants. Novelty. Percentage of solutions of a team that have been produced by just one, two, three or the four teams. Non-obviousness. rP. Fo. +. Newness with respect to current paradigm. ee. Feasibility1. How close it comes to meet the design specifications, degree of manufacturability and degree of economic implementability. Characterisation of types of change from type 1 to type 4. Time dedicated to each solution. Rate of attended reflections. Relationship between criteria for ideageneration effectiveness and measures The higher the number of global solutions, the higher the variety The higher the number of variants, the higher the quantity The higher the percentage of solutions produced by just one team or two teams, the higher the novelty of the solutions. The higher the percentage of solutions of high types of a group, the higher the novelty of the solutions The more time dedicated to a solution, the higher the probability of a feasible solution The higher the rate of attended reflections, the higher the probability of a feasible solution. ev. rR. Table 2. Criteria and measures to evaluate the effectiveness of idea-generation methods. iew ly. On. 1 2 3 4 5 6 7 8 9 10 11 12 13 14 15 16 17 18 19 20 21 22 23 24 25 26 27 28 29 30 31 32 33 34 35 36 37 38 39 40 41 42 43 44 45 46 47 48 49 50 51 52 53 54 55 56 57 58 59 60. Journal of Engineering Design. 1. The two parameters chosen for feasibility may not give an exact measure of feasibility, though they have a potential to be positively correlated.. URL: http://mc.manuscriptcentral.com/cjen E-mail: jed@metronet.co.uk.
(29) Journal of Engineering Design. Team. Variant solutions. Time. Level of differentiation. Variant solutions. Time. AS. 1a. 01:12. a. AG. 1a. 01:21. a. AS. 1b. 01:40. b. AG. 1b. 00:05. b. AS. 2. 01:47. AG. 1c. 00:55. c. AS. 3a. 01:59. a. AG. 1d. 00:47. d. AS. 3b. 02:01. b. AG. 2a. 03:08. a. AS. 3c. 01:30. c. AG. 2b. 03:53. b. AS. 3d. 01:26. d. AG. 2c. 03:07. f. AS. 3e. 01:35. e. AG. 2d. 04:03. c. AS. 4a. d. AS. 4b. IG. 1. 02:24. IG. 2a. 02:19. IG. 2b. 02:06. IG. 3a. 01:06. IG. 3b. 02:49. IG. 3c. 00:58. IG. 3d. 05:41. d. IG. 3e. 01:09. a. IG. 4a. 01:43. a. IG. 4b. 03:46. b. IG. 4c. 01:20. c. IG. 4d. 01:48. d. IG. 4e. 03:34. IG. 5. 02:22. IG. 6. 01:03. IG. 7. 00:11. F. Fo. C1. C2. Team. D. Level of differentiation F. 15:07. a. AG. 2e. 03:27. 16:35. b. AG. 2f. 03:10. C1. 3a. 02:16. a. AG. 3b. 02:12. b. a. AG. 3c_a. 03:13. c. b. AG. 3c_b. 02:44. a. AG. 3d. 02:11. d. b. AG. 3e. 02:56. e. d. AG. 3f. 02:25. f. AG. 3g. 02:30. g. AG. 3h. 02:31. h. AG. 3i. 02:31. i. AG. 3j. 03:06. j. AG. 4a. 00:42. a. AG. 4b. 01:35. b. iew. ev. rR. ee e. C2. e. AG. rP. c_a c_b. AG. 4c. 00:45. c. AG. 4d. 00:47. d. AG. 5a. 00:18. a. AG. 5b. 00:42. b. AG. 6. 00:50. On. IS. 1a. 15:00. a. AG. 7. 00:21. IS. 1b. 15:00. b. AG. 8. 01:53. IS. 2. 04:43. IS. 3a. 07:23. a. IS. 3b. 01:23. b. IS. 4. 02:52. IS. 5a. 02:16. a. IS. 5b. 00:06. b. IS. 6. 00:17. IS. 7. 02:07. IS. 8. 03:38. ly. 1 2 3 4 5 6 7 8 9 10 11 12 13 14 15 16 17 18 19 20 21 22 23 24 25 26 27 28 29 30 31 32 33 34 35 36 37 38 39 40 41 42 43 44 45 46 47 48 49 50 51 52 53 54 55 56 57 58 59 60. Page 28 of 34. AG: Adaptive group / Graphical stimuli AS: Adaptive group / Sentential stimuli IG: Innovative group / Graphical stimuli IS: Innovative group / Sentential stimuli Table 3. Classification of solutions. URL: http://mc.manuscriptcentral.com/cjen E-mail: jed@metronet.co.uk. D.
(30) Page 29 of 34. AG Team name (AdaptiveGraphical). IG (InnovativeGraphical). IS (InnovativeSentential). AS (AdaptiveSentential). Number of global solutions. 8. 7. 8. 4. Number of alternatives. 30. 16. 11. 10. Total number of solution-related reflections. 4. 22. 23. 8. Number of attended solution-related reflections. 2. 12. 19. 8. Number of unattended solution-related reflections. 2. 10. 4. 0. 0,13. 1,38. 2,09. 0,80. Percentage of attention to reflections (No. attended reflections/No. reflections). 50%. 55%. 83%. 100%. Rate of attended reflections (No. attended solution-related reflections/No. variants). 0,07. 0,75. 1,72. 0,80. Rate of reflections (No. reflections/No. alternatives). rP. Fo. Table 4. Results from quantity, diversity and feasibility measures. iew. ev. rR. ee ly. On. 1 2 3 4 5 6 7 8 9 10 11 12 13 14 15 16 17 18 19 20 21 22 23 24 25 26 27 28 29 30 31 32 33 34 35 36 37 38 39 40 41 42 43 44 45 46 47 48 49 50 51 52 53 54 55 56 57 58 59 60. Journal of Engineering Design. URL: http://mc.manuscriptcentral.com/cjen E-mail: jed@metronet.co.uk.
(31) Journal of Engineering Design. Team. AG (Adaptive-Graphical) No. of variants. Level. IG. IS. AS. (Innovative-Graphical). (Innovative-Sentential). (Adaptive-Sentential). Cumulative No.. No. of variants. Cumulative No.. No. of variants. Cumulative No.. No. of variants. Cumulative No.. Action Function. 8. 8. 7. 7. 9. 9. 4. 4. Conceptual 1. 17. 25. 8. 15. 1. 10. 5. 9. Conceptual 2. 5. 30. 1. 16. 0. 10. 0. 9. Detail. 0. 30. 0. 16. 1. 11. 1. 11. Table 5. Variety construction. iew. ev. rR. ee. rP. Fo ly. On. 1 2 3 4 5 6 7 8 9 10 11 12 13 14 15 16 17 18 19 20 21 22 23 24 25 26 27 28 29 30 31 32 33 34 35 36 37 38 39 40 41 42 43 44 45 46 47 48 49 50 51 52 53 54 55 56 57 58 59 60. Page 30 of 34. URL: http://mc.manuscriptcentral.com/cjen E-mail: jed@metronet.co.uk.
(32) Page 31 of 34. Team. Team style. Stimuli. AG. Adaptive. Graphical. IG. Innovative. Graphical. IS. Innovative. Sentential. AS. Adaptive. Sentential. Total. Fo. Measure Absolute Relative Absolute Relative Absolute Relative Absolute Relative Absolute Relative. No. of alternatives. Change type 1. Change type 2. Change type 3. Change type 4. 30 1.00 16 1.00 10 1.00 10 1.00 66 1.00. 23 0.77 13 0.81 4 0.40 8 0.80 48 0.73. 5 0.17 3 0.19 2 0.20 2 0.20 12 0.18. 1 0.03 0 0.00 3 0.30 0 0.00 4 0.06. 1 0.03 0 0.00 1 0.10 0 0.00 2 0.03. Table 6. Types of change of alternative solutions. iew. ev. rR. ee. rP ly. On. 1 2 3 4 5 6 7 8 9 10 11 12 13 14 15 16 17 18 19 20 21 22 23 24 25 26 27 28 29 30 31 32 33 34 35 36 37 38 39 40 41 42 43 44 45 46 47 48 49 50 51 52 53 54 55 56 57 58 59 60. Journal of Engineering Design. URL: http://mc.manuscriptcentral.com/cjen E-mail: jed@metronet.co.uk.
(33) Journal of Engineering Design. Stimuli episodes →. Screen 0. Screen 1. Screen 2. Screen 3. Screen 4. Screen 5. Screen 6. Screen 7. 1a 1b 2a 3a 3b 3c 3 type 3d 3e 3f 4a. 1a 5a 3g 3h 2b 1c 5b 2b. 3i 6 2c 2d 2 type 3 type. 7 3c_a 2d 2e. 2f 2 type 1a 1d. 3c_b 3 type. 3j 4b 4c. 3e 4d 8. IG (Innovative group, Graphical stimuli). 1 2a 3a 4a. 3 type 3c 3d 3e. 5 2a. 4a 4b 2a. 4b 2b 4c 4d. 4d 6 4e. 4e 3d. 3d 2a 4 type 7 3 type 2b. IS (Innovative group, Sentential stimuli). 1 2. 1 2 3a. 1. 1 5a 5b. 3b 1 1a 1b. 6 5a 7 8. 8. 1 type 2 1a 1b 3 type 3a 3b 3c. 4. 4. 4 4a 4b. 4 type. Group↓ AG (Adaptive group, Graphical stimuli). 1 3a 4. iew. 2 3d 3e 4. ev. rR. ee. AS (Adaptive group, Sentential stimuli). rP. Fo. 3 type. 4. ly. On. 1 2 3 4 5 6 7 8 9 10 11 12 13 14 15 16 17 18 19 20 21 22 23 24 25 26 27 28 29 30 31 32 33 34 35 36 37 38 39 40 41 42 43 44 45 46 47 48 49 50 51 52 53 54 55 56 57 58 59 60. Page 32 of 34. Table 7. Appearance and development of alternative solutions (retaken alternatives are bold. The alternative solutions retaken more times by each group are underlined).. URL: http://mc.manuscriptcentral.com/cjen E-mail: jed@metronet.co.uk.
(34) Page 33 of 34. Frames used by IG (Innovative group). Frames used by AG (Adaptive group). F1: Longitudinal opening to extract maps F2: Various longitudinal entries in the tubular case F3: Concentric tubular cases F4: Tubular case which is opened longitudinally into two half-cylindrical shapes F5: Flexible storage file for maps that can be rolled up into a tubular shape F7: How to protect the maps from blows? F6: Small individual rolls inside a tubular case F7: How to protect the maps from blows? F8: Manual selection of maps for their introduction/extraction F9: Coins organiser image F10: Joining system that links cells for individual maps F11: Mechanism in the centre of the tubular case to place maps in an empty cell F12: Bottom of tubular case with different heights F13: Comparing solution of flexible storage files for maps with solution of concentric divisions inside the case.. F1: Divisions in the tubular case for individual storage of maps F2: Ways to divide the case or additional pieces that make maps independent F3: The case does not need to be cylindrical F4: Tubular case which is opened longitudinally into two half-cylindrical shapes F5: Divisions in the case of different sizes which are extractable F6: Introduce more maps in the space between individual map rolls inside a case F7: Conic rolling-up of maps F8: How can maps become easy to pile occupying little space? F9: Ways to cut wood F10: Combine already generated ideas F11: Systems of fabric storage which could be used for maps storage. ee. rP. Fo. Table 8. Frames used by the groups with visual stimuli. iew. ev. rR. ly. On. 1 2 3 4 5 6 7 8 9 10 11 12 13 14 15 16 17 18 19 20 21 22 23 24 25 26 27 28 29 30 31 32 33 34 35 36 37 38 39 40 41 42 43 44 45 46 47 48 49 50 51 52 53 54 55 56 57 58 59 60. Journal of Engineering Design. URL: http://mc.manuscriptcentral.com/cjen E-mail: jed@metronet.co.uk.
Figure

+3

Documento similar
The main objective of this paper is to analyse the effect of training based on ad hoc teams in industrial companies implementing a lean production system.. To achieve our goal,
Podemos marcar si es obligatorio para el usuario responder la pregunta antes de enviar el cuestionario e indicar si va a ser una respuesta larga (en este caso no
In the preparation of this report, the Venice Commission has relied on the comments of its rapporteurs; its recently adopted Report on Respect for Democracy, Human Rights and the Rule
The draft amendments do not operate any more a distinction between different states of emergency; they repeal articles 120, 121and 122 and make it possible for the President to
The objective of this paper is to present three reusable solutions at detailed design and programming level in order to effectively implement the Abort
With this in mind, Stevens and Campion (1994, 1999) identified five transportable teamwork competencies that are common to different types of teams: 1) conflict resolution,
This study was aimed at analyzing the average speed of the trips made by each of the national teams taking part in the World Cup South Africa 2010 according to different
In the same way, on-line fractionation of the extract in a depressurization system (comprised of two separators) to produce a selective separation of the antioxidant
