Pollution of Water for domestic use and human consumption, by heavy metals Pb, Cd, Cr, Zn and As, Derived from mining Activity in Hidalgo del Parral, Chihuahua, México
17
0
0
Texto completo
(2) The water pollution in this area began with the Industrial Revolution 2, creating problems on quality as well as the amount of available water 3, 4. The efforts to eliminate the anthropogenic pollutants have not been able to adjust to the increasing rhythm of production of industrial waste and demographic explosion, which has induced the transformation of the oceans’, lakes’ and rivers’ water into deposits of waste matter, resulting in a severe natural imbalance 5, 6. The soil of Parral contains vetiform mineralized structures whose origin is hydrothermal with north – south general orientation, related to normal faults, where the mineral stones are galena, sphalerite and chalcopyrite with important amounts of gold (Au), silver (Ag), lead (Pb), zinc (Zn) and copper (Cu). The mining represented, for over three centuries, one of the most important sources for the economic development of this area, creating significant amounts of waste derived from the very process, with a high content of heavy metals. Tailing deposits are extremely toxic for living creatures and they also act as inhibitor of ecological factors, affecting the growth of plants and the ecosystem life. Heavy metals cannot be naturally eliminated from the aquatic ecosystems because they are not biodegradable 7. They also are indicators of the ecological quality of the whole water flow due to their toxicity and especially to their bio-accumulative behavior 8, 9. The Environmental Protection Agency (EPA) of the United States of America includes elements such as Cr, As, Co, Ni, Cu, Zn, Ag, Cd, Ti, Se and Pb in a group of metals that potentially represent a risk to human health in specific concentrations, or combined with other elements or environment factors. The metals accumulated on the surface of the soil are slowly reduced by lixiviation, plants consumption and erosion. These processes can result in pollution to the aquifer, health risk to humans through ingestion of polluted food, and decreasing air quality due to the presence of heavy metals eroded from the tailing deposits which become airborne and transport to different points away from the source. This phenomenon may overstate the problem by having a greater area of impact Near the deposits, the concentrations of the metals and other products of mines can be rather high10. Gutiérrez-Ruiz et al. (2007) reported values of Cu, As, and Ba up to 2,415 mg/kg, 3,281 mg/kg, and 586 mg/kg respectively, in the mining zone of Santa Barbara Chihuahua. However, the concentrations of these metals in shallow underground water were under the permissible limits for human consumption water. According to Klaasen and Watkins III explanation, 11 metals are naturally distributed into the environment by both biological and geological cycles. Given that there is a great amount of tailings in the research area, which can lead to health problems in high concentrations, it was decided that the analysis of the concentrations of As, Cd, Cr, Pb and Zn in the different sources was necessary.. 2.
(3) EXPERIMENTAL METHODS Sampling Plan Using the zones established by the Junta Municipal de Agua (ZA1, ZA2 and ZA3) and the water sources as references, samples were taken from the following points: 13 Wells and 2 points of re-pumping of Valle del Verano, which feed the east side of the city (ZA3) Water of the mines at the inlet and outlet flow of the water treatment plant, which feed the west part of the city.(ZA2) Storage Tank Vésper, which feeds the north side of the city (ZA1) Figures 1 and 2 show the city divided into the three zones as well as the wells of El Verano. In addition, different samples from domestic faucets were taken in order to evaluate the quality of the water that goes to the population in each one of the distribution zones; including the wells inside the city which sell bottled water. The distribution map of the sampling points and wells of the city are shown in Figure 3. Figure 1. Delimitation of the water distribution zones in Parral.. ZA-1. ZA-2. 11. 17. ZA-3. 3.
(4) Figure 2. General description of the water supply system in Hidalgo del Parral. Tanque Vesper Mina y tanque La Recompensa. Mina Cabadeñas. Mina Vesper. Tanque Montaña. Hidalgo Del Parral Tanque Piezométrica. Mina La esmeralda. Torre de oscilación 2. Presa Parral. Rebombeo El Verano Torre de oscilación 1. Zona de Extracción El Verano. Figure 3. Monitoring points for domestic faucets and wells located within the urban area sampling.. *TD: Domestic Faucets (Tomas Tomiciliares); *MN: Wells located within the urban area (Muestras en Norias). 4.
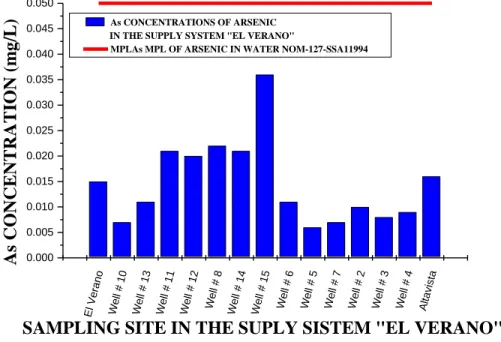
(5) The volume of our samples was of 1 liter (L); they were preserved with nitric acid within a pH < 2 and stored in refrigeration, according to the guidelines established in the NOM-051-SCFI-2001. Determination of the Concentrations of Heavy Metals in Water Laboratory tests were conducted in Atomic Absorption Spectrophotometer GBC brand, model Avanta Σ. Digestion and sample preparation were performed according to the specifications of the standard NMX-AA-051-SCFI-2001, and the analysis of the concentrations was based on EPA Method 7000B-2007. The results of the readings of the samples were compared with the permissible limits established in NOM-127-SSA1-1994, to gauge the potential damage to health.. RESULTS Heavy Metals in Wells from Valle del Verano Table 1 summarizes the monitoring sites and heavy metals results in wells from Valle del Verano investigated in this study. Figure 4 graphically depicts the arsenic results. Table 1. Identification of monitoring sites and concentration levels of heavy metals in wells from Valle del Verano. Sampling Site. ID Site. Location LON LAT. Height (masl). As (mg/L). Zn (mg/L). Cd (mg/L). Cr (mg/L). Pb (mg/L). ND. ND. ND. ND. El Verano Repumping. 1A. -105.6054. 26.8945. 1808. 0.015. Well # 10. 2A. -105.324. 26.8223. 1734. 0.007. 0.3. ND. ND. ND. Well # 13. 3A. -105.6347. 26.802. 1749. 0.011. 3.666. ND. ND. ND. Well # 11. 4A. -105.641. 26.7907. 1760. 0.021. ND. ND. ND. ND. Well # 12. 5A. -105.6404. 26.786. 1752. 0.02. ND. ND. ND. ND. Well # 8. 6A. -105.6465. 26.79. 1759. 0.022. ND. ND. ND. ND. Well # 14. 7A. -105.656. 26.7983. 1769. 0.021. ND. ND. ND. ND. Well # 15. 8A. -105.6614. 26.795. 1768. 0.036. ND. ND. ND. ND. Well # 6. 9A. -105.6395. 26.8004. 1754. 0.011. ND. ND. ND. ND. Well # 5. 10A. -105.644. 26.8207. 1748. 0.006. ND. ND. ND. ND. Well # 7. 11A. -105.3504. 26.615. 1759. 0.007. 0.22. ND. ND. ND. Well # 2. 12A. -105.6487. 26.8043. 1751. 0.01. ND. ND. ND. ND. Well # 3. 13A. -105.6437. 26.8083. 1755. 0.008. ND. ND. ND. ND. Well # 4. 14A. -105.6384. 26.8129. 1763. 0.009. ND. ND. ND. ND. Repumping Altavista. 15A. -105.6694. 26.9191. 1785. 0.016. ND. ND. ND. ND. 5.
(6) Figure 4. Arsenic concentration in samples taken from the supply system "El Verano". As CONCENTRATIONS OF ARSENIC IN THE SUPPLY SYSTEM "EL VERANO" MPLAs MPL OF ARSENIC IN WATER NOM-127-SSA11994. 0.045 0.040 0.035 0.030 0.025 0.020 0.015 0.010 0.005 0.000 El Ve r. ano Well # 10 Well # 13 Well # 11 Well # 12 Well #8 Well # 14 Well # 15 Well #6 Well #5 Well #7 Well #2 Well #3 Well #4 Altav ista. As CONCENTRATION (mg/L). 0.050. SAMPLING SITE IN THE SUPLY SISTEM "EL VERANO" Heavy Metals in Domestic Faucets Table 2 summarizes the monitoring sites and heavy metals results from domestic faucets investigated in this study. Figures 5, 6, 7, and 8 graphically depict the arsenic, zinc, cadmium, and lead results, respectively. Table 2. Identification of monitoring site and concentration levels of heavy metals in domestic faucets. Sampling Site Miguel Hidalgo Ampliación Juárez Bella Vista Cerro Blanco Juárez. ID Site. Location LON LAT. As (mg/L). Zn (mg/L). Cd (mg/L). Cr (mg/L). Pb (mg/L). TD-1. -105.6837. 26.9152. 0.019. ND. ND. ND. ND. TD-2. -105.6737. 26.9135. 0.021. ND. ND. ND. ND. TD-3. -105.6673. 26.92. 0.017. ND. ND. ND. ND. TD-4. -105.6537. 26.9188. 0.015. ND. ND. ND. ND. TD-5. -105.6765. 26.9185. 0.017. 3.23. ND. ND. ND. Alta Vista. TD-6. -105.669. 26.9225. 0.016. ND. ND. ND. ND. Conejo. TD-7. -105.6613. 26.9289. 0.012. 1.064. ND. ND. ND. Kennedy. TD-8. -105.6529. 26.9233. 0.015. 0.25. ND. ND. ND. Tecnológico. TD-9. -105.6453. 26.9329. 0.017. ND. ND. ND. ND. La Peña Loma lindaProgresoPotrero. TD-10. -105.684. 26.928. ND. 9.13. 0.066. ND. 0.208. TD-11. -105.6791. 26.9356. ND. 8.552. 0.06. ND. 0.214. 6.
(7) Montañas. TD-12. -105.6709. 26.9536. 0.104. 0.436. ND. ND. ND. Heroes 1. TD-13. -105.6781. 26.9489. 0.061. 0.985. ND. ND. ND. Heroes 2 Tierra y Libertad UACH. TD-14. -105.6848. 26.9499. ND. 8.92. 0.05. ND. ND. TD-15. -105.7017. 26.9313. ND. 7.788. 0.056. ND. ND. TD-16. -105.6988. 26.9392. 0.018. 7.664. 0.048. ND. 0.424. PRI. TD-17. -105.7034. 26.9348. ND. 5.478. 0.038. ND. ND. Figure 5. Arsenic concentrations in samples taken from domestic faucets. 0.10. 0.08. 0.06. 0.04. 0.02. PRI. UAC H. 2 TyLib ertad. Hero es. TEC La P eña LL-P og-P ot Mont añas Hero es 1. Kenn edy. Juár ez Alta Vista Cone jo. 0.00. M Hid algo A Ju árez Bella Vista C Bla nco. As CONCENTRATION (mg/L). As ARSENIC CONCENTRATION IN DOMESTIC FAUCETS MPLAs MLP OF ARSENIC IN WATER NOM-127-SSA1-1994. SAMPLING SITE - DOMESTIC FAUCETS. 7.
(8) Figure 6. Zinc concentrations in samples taken from domestic faucets.. 8. 6. 4. 2. PRI. UAC H. Hero es 2 TyLib ertad. TEC La P eña LL-P og-P ot Monta ñas Hero es 1. 0 M Hid algo A Ju árez Bella Vista C Bla nco Juáre z Alta Vista Cone jo Kenn edy. Zn CONCENTRATION (mg/L). Zn ZINC CONCERNTRATION IN DOMESTIC FAUCETS MPLZn MPL OF ZINC IN WATER NOM-127-SSA1-1994. SAMPLIN SITE - DOMESTIC FAUCETS. Figure 7. Cadmiun concentrations in samples taken from domestic faucets.. Cd CADMIUM CONCETRATION IN DOMESTIC FAUCETS MPLCd MPL OF CADMIUM IN WATER NOM-127-SSA1-1994. 0.06 0.05 0.04 0.03 0.02 0.01. PRI. Hero es 2 TyLib ertad UAC H. TEC La P eña LL-P og-P ot Mon tañas Hero es 1. Kenn edy. Juár ez Alta Vista Cone jo. 0.00. M Hid algo A Ju árez Bella Vista C Bla nco. Cd CONCENTRATION (mg/L). 0.07. SAMPLING SITE - DOMESTIC FAUCETS. 8.
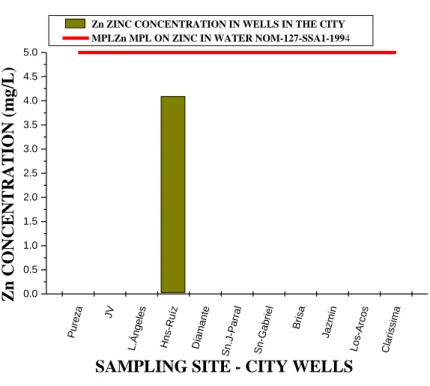
(9) Figure 8. Lead concentrations in samples taken from domestic faucets.. 0.4. 0.3. 0.2. 0.1. PRI. Hero es 2 TyLib ertad UAC H. TEC La P eña LL-P og-P ot Mont añas Hero es 1. Cone jo Kenn edy. Juár ez Alta Vista. 0.0. M Hid algo A Ju árez Bella Vista C Bla nco. Pb CONCENTRATION (mg/L). Pb LEAD CONCENTRATION IN DOMESTIC FAUCETS MPLPb MPL OF LEAD IN WATER NOM-127-SSA1-1994. SAMPLING SITE - DOMESTIC FAUCETS Heavy Metals in City Wells Table 3 summarizes the monitoring sites and heavy metals results from City wells investigated in this study. Figures 9, 10, and 11 graphically depict the arsenic, zinc, and cadmium results, respectively. Table 3. Identification of monitoring sites and concentration levels of heavy metals in City wells. Location LON LAT. As (mg/L). Zn (mg/L). Cd (mg/L). Cr (mg/L). Pb (mg/L). Sampling Site. ID Site. Pureza. MN-02. -105.6540. 26.9243. ND. ND. ND. ND. ND. JV. MN-03. -105.6739. 26.9327. ND. ND. ND. ND. ND. Los Ángeles. MN-05. -105.6738. 26.9272. ND. ND. ND. ND. ND. Hermanos Ruíz. MN-06. -105.6764. 26.9243. ND. 4.095. 0.022. ND. ND. Diamante. MN-07. -105.6705. 26.9247. 0.02. ND. ND. ND. ND. San José del Parral. MN-08. -105.6715. 26.9231. ND. ND. ND. ND. ND. San Gabriel. MN-09. -105.6676. 26.9236. ND. ND. ND. ND. ND. Brisa. MN-10. -105.6537. 26.9229. ND. ND. ND. ND. ND. Jazmin. MN-11. -105.6533. 26.9241. 0.017. ND. ND. ND. ND. Los Arcos. MN-12. -105.6531. 26.9279. ND. ND. ND. ND. ND. Clarissima. MN-13. -105.6467. 26.9316. 0.012. ND. ND. ND. ND. 9.
(10) Figure 9. Arsenic concentrations in wells in the City. As ARSENIC CONCENTRATION IN WELLS IN THE CITY MPLAs MPL OF ARSENIC IN WATER NOM-127-SSA1-1994. 0.045 0.040 0.035 0.030 0.025 0.020 0.015 0.010 0.005. sima Claris. Arco s Los-. Jazm. in. Brisa. l abrie Sn-G. al -Parr Sn.J. ante Diam. Ruíz Hns-. JV. Pure. L.Án geles. 0.000 za. As CONCENTRATION (mg/L). 0.050. SAMPLING SITE - CITY WELLS Figure 10. Zinc concentrations in wells in the City. Zn ZINC CONCENTRATION IN WELLS IN THE CITY MPLZn MPL ON ZINC IN WATER NOM-127-SSA1-1994. 4.5 4.0 3.5 3.0 2.5 2.0 1.5 1.0 0.5. Claris sima. os LosArc. Jazm in. Brisa. Sn-G abrie l. Sn.J -Parr al. Diam ante. HnsRuíz. L.Án geles. JV. 0.0 Pure za. Zn CONCENTRATION (mg/L). 5.0. SAMPLING SITE - CITY WELLS. Figure 11. Cadmium concentrations in wells in the City.. 10.
(11) 0.020. 0.015. 0.010. 0.005. sima Claris. s LosArco. in Jazm. Brisa. Sn-G abrie l. Sn.J -Parr al. Diam ante. Ruíz Hns-. geles L.Án. JV. 0.000 Pure za. Cd CONCENTRATION (mg/L). Cd CADMIUM CONCENTRATION IN WELLS IN THE CITY MPLCd MPL OF CADMIUM IN WATER NOM-127-SSA1-1994. SAMPLING SITE - CITY WELLS. Heavy Metals in the Water Treatment Plant and Mines of the Area of Study Table 4 summarizes the monitoring sites and heavy metals results from the Water Treatment Plant and mines of the area of study. Figures 12, 13, 14, and 15 graphically depict the arsenic, zinc, cadmium, and lead results, respectively. Tables 5, 6, and 7 show calculation results for estimated human doses.. Table 4. Identification of monitoring sites and concentration levels of heavy metals in the Water Treatment Plant and mines of the area of study. Location LON LAT. As (mg/L). Zn (mg/L). Cd (mg/L). Cr (mg/L). Pb (mg/L). 26.932. ND. 32.61. 0.159. ND. 0.317. -105.7224. 26.9519. ND. 3.502. 0.05. ND. 3.502. 18A. -105.7283. 26.9919. 0.025. ND. 0.02. ND. ND. 19A. -105.7096. 26.9536. 0.014. 0.248. ND. ND. 0.248. 20A. -105.6492. 26.9814. 0.095. ND. ND. ND. ND. 21A. -105.6491. 26.9814. 0.028. 0.832. 0.26. ND. 0.832. Entrance to Water Treatmente (Arbolito & Cabadeña Mines. 22A. -105.6889. 26.9324. ND. 1.334. 0.03. ND. 0.21. Out of the Water Treatment Plant. 23A. -105.6889. 26.9317. 0.004. 8.28. 0.054. ND. ND. Sampling Site. ID Site. Potabilizadora (Esmeralda Mine). 16A. -105.6886. Cabadeña Mine. 17A. Veta Colorada Mine Arbolito Mine Recompensa Mine Vesper Mine. 11.
(12) Figure 12. Arsenic concentrations in water from mines and from Water Treatment Plant. As ARSENIC CONCENTRATION IN MINES & WATER TREATMENT PLANT MPLAs MPL OF ARSENIC IN WATER NOM-127-SSA1-1994. As CONCENTRATION (mg/L). 0.10. 0.08. 0.06. 0.04. 0.02. 0.00 16A. 17A. 18A. 19A. 20A. 21A. 22A. 23A. SAMPLING SITE - MINES & WATER TREATMENT PLANT. 12.
(13) Figure 13. Zinc concentrations in water from mines and from Water Treatment Plant. Zn CONCENTRATION (mg/L). 35. Zn ZINC CONCENTRATION IN MINES & WATER TREATMENT PLANT MPLZn MPL OF ZINC IN WATER NOM-127-SSA1-1994. 30 25 20 15 10 5 0 16A. 17A. 18A. 19A. 20A. 21A. 22A. 23A. SAMPLING SITE - MINES & WATER TREATMENT PLANT. Figure 14. Cadmium concentrations in water from mines and from Water Treatment Plant. Cd CONCENTRATION (mg/L). Cd CADMIUM CONCENTRAITON IN MINES & WATER TREATMENT PLANT MPLCd MPL OF CADMIUN IN WATER NOM-127-SSA1-1994. 0.25. 0.20. 0.15. 0.10. 0.05. 0.00 16A. 17A. 18A. 19A. 20A. 21A. 22A. 23A. SAMPLING SITE - MINES & WATER TREATMENT PLANT. 13.
(14) Figure 15. Lead concentrations in water from mines and from Water Treatment Plant (NOTE: Please refer to Table 4 for identification of the sampling sites in Figures 12 through 15). Pb CONCENTRATION (mg/L). Pb LEAD CONCENTRATION IN MINES & WATER TREATMENT PLANT MPLPb MPL OF LEAD IN WATER NOM-127-SSA1-1994. 3.5 3.0 2.5 2.0 1.5 1.0 0.5 0.0 16A. 17A. 18A. 19A. 20A. 21A. 22A. 23A. SAMPLING SITE - MINES & WATER TREATMENT PLANT. Table 5. Calculation of the estimated intake dose (ED) for the output of the Water Treatment Plant. CONC. ED ADULT. ED CHILD. 75Kg. 25Kg. (mg/Kg). (mg/Kg). 0.004. 5.33E-05. 0.00008. 8.28. 0.213. 0.319. Cadmium. 0.054. 0.001. 0.002. Chromium. 0. 0. 0. 0. 0. 0. SITE 23A (mg/L) OUTPUT FROM WATER TREATMENT PLANT.. Arsenic Zinc. Plomo. 14.
(15) Table 6. Calculation of the estimated intake dose (ED) for Repumping Altavista.. REPUMPING ALTAVISTA. CONC. ED. SITE. ADULT. 15A. 75 Kg. (mg/L). (mg/Kg). Arsenic. 0.016. 0.0004. 0.0006. Zinc. 0. 0. 0. Cadmium. 0. 0. 0. Chromium. 0. 0. 0. Lead. 0. 0. 0. ED CHILD 25 Kg (mg/Kg). Table 7. Calculation of the estimated intake dose (ED) for Recompensa Mine. CONC SITE 20A (mg/L) RECOMPENSA MINE. ED ADULT. ED CHILD. 75 Kg. 25 Kg. (mg/Kg). (mg/Kg). Arsenic. 0.095. 0.0014. 0.0021. Zinc. 0. 0. 0. Cadmium. 0. 0. 0. Chromium. 0. 0. 0. Lead. 0. 0. 0. DISCUSSION The concentration of heavy metals Cd, Pb and Zn in the west side of Parral is above the permissible limit established by current regulations, reaching values up to 0.26 mg / L for cadmium, 3502 mg/ L for lead and 32.61 mg / L for zinc. Arsenic in the west side is beyond the permissible limit in 1 of 8 analyzed sources, corresponding to the storage tank Vesper, representing 12.5% of total samples in that area. In the east side, which is served by water wells from Valle del Verano; all the analyzed parameters are within the limits set by current standards for drinking water. The wells located within the urban area that distribute drinking water are also within permissible limits on the content of heavy metals established by national and international standards. In order for water to be considered potable, in terms of arsenic content, it cannot deliver a higher dose than 0.0003 mg / kg / day (* Agency for Toxic Substances and Disease Registry (ATSDR),. 15.
(16) (U.S. Department of Health and Human Services). However, a dose up to 0.00128 mg / kg / day calculated for an average weight of 75 kg was identified from domestic faucets supplied by the water treatment plant. In homes whose source is the storage tank Vesper, the exposure dose of arsenic was calculated to be 0.0022 mg / kg / day. These results indicate that the water treatment process conducted in the water treatment plant does not eliminate heavy metals in the water that comes from the mines. In the east side, although the source has a concentration of arsenic within the acceptable limits, when calculating the dose per exposure in the residential area, it reaches a maximum of 0.00056 mg / kg / day, which may affect human health. The estimated intake dose for the different samples and analyzed metals shows a water pollution problem that may pose a long-term health risk for population. Zinc that was found in the domestic faucets of the east area can be derived from a process of wear and corrosion of repumping systems. The water treatment plant receives water from various mines and Dam Parral. This allows a dilution process that attenuates the concentrations of heavy metals coming out from the water treatment plant, so that in dry seasons, this process of dilution is decreased by the low supply volumes from the dam, increasing the concentrations of heavy metals in the water supplied to the western part of the city. The importance of heavy metals is their high persistence and bioaccumulation within living organisms. These effects are difficult to detect in the short term.. SUMMARY The study for the diagnosis of heavy metals contamination resulting from mining activities in the water supplies for domestic use and human consumption to the population of Hidalgo del Parral was completed. The results show a potential risk to health in the north and west portions of the city, as long as significant concentrations of heavy metals such as lead, arsenic, cadmium and zinc were detected. The estimates of effective doses from the concentrations found in the samples collected are important indicators that require further research to give greater certainty and allow sizing, with greater support, the problem of water pollution by heavy metals in Parral, in order to establish plans and programs for mitigation or remediation to improve the life quality and expectancy of the population and its environment.. ACKNOWLEDGEMENTS To the Consejo Nacional de Ciencia y Tecnología from México (CONACYT) for providing the resources to develop this research project; To the Centro de Investigación en Materiales Avanzados (CIMAV) from Chihuahua City, for technical and scientific support, as well as the hospitality received in their facilities to students of the Institute of Chemical Engineering to track their draft Thesis.. 16.
(17) REFERENCES 1 2. 3. 4. 5 6 7 8 9. 10 11. INEGI, 2005: Instituto Nacional de Estadística Geografía e Informática; Municipios de México Dekov, V.M., Araujo, F., Van Grieken, R. and Subramanian, V. (1998) Chemical Composition of sediments and suspended matter from the Cauvery and Brahmaputra rivers (India). The Science of theTotal Environment 212, 89-105. Förstner, U., Ahlf, W., Calmano, W. and Kersten, M. (1990) Sediment criteria development. In: Heling D, Rothe P, Förstner U, and Stoffers P (Eds), Sediments and environmental Geochemistry. Berlin: Springer-Verlag, pp 311-338. Vink, R., Behrendt, H. and Salomons, W. (1999) Development of the heavy metal pollution trends in several European rivers: an analysis of point diffuse sources. Water Science Technology 39(12), 215-223. Förstner, U. and Wittmann, G.T.W. (1981) Heavy metal pollution in the aquatic environment (2nd Ed). Spring-Verlag. Berlin. Heidelberg New York, p. 486. Rovira, J.V. (1993) Estudio de la contaminación por metales pesados del Río Jarama. Tesis Doctoral. Madrid, p. 360. Murray, K.S. (1996). Statistical comparisons of heavy metal concentrations in River sediments. Environmental Geology 27, 54-58. Purves, D. (1985) Trace element contamination of the environment. Elsevier, Amsterdam, p. 260. Moalla, S.M., Awadallah, R.M., Rashed, M.N. and Soltan, M.E. (1998). Distribution and chemical fractionation of some heavy metals in bottom sediments of Lake Nasser. Hydrobiologia 364, 31-40. Puga, S., et al. 2006: Contaminación por Metales Pesados en Suelo Provocada por la Industria Minera, Ecología Aplicada (Applied Ecology), 5(1,2), 2006. Klaassen, Curtis D. and John B. Watkins III, eds. Casarett and Doull's Toxicology: The Basic Science of Poisons: Companion Handbook. 5th ed. New York, N.Y.: McGraw-Hill, 1999.. 17.
(18)
Figure


+7


Documento similar