J. Barros, M. de Apráiz, R.I. Diego
Dept. Computing Science and Electronics University of Cantabria
Santander, Spain e.mail: [email protected]
P. Saiz, L.A. Leturiondo, J.J. Gutiérrez
Dept. Communications Engineering University of the Basque Country (UPV/EHU)
Bilbao, Spain e.mail: [email protected]
Abstract— IEC 61000-4-30 has recently defined a method for detection and analysis of rapid voltage changes in power system networks. This paper presents some of the results obtained in the application of the IEC standard method in different low-voltage and medium-voltage power system networks with different load types and some of the limitations found in the standard method for the correct detection and characterization of these voltage events.
Index terms - Flicker; Power quality; Rapid voltage changes; Voltage fluctuations.
I. INTRODUCTION
IEC 61000-4-30, Ed. 3, 2015 [1] defines a rapid voltage change “as a quick transition in r.m.s. voltage occurring between two steady-state conditions, and during which the r.m.s. voltage does not exceed the dip/swell thresholds.” The standard defines the Urms(1/2) magnitude (the r.m.s. voltage computed over one cycle and refreshed each half-cycle) as the basic calculation for the measurement and detection of RVC events. In this standard the detection and characterization of RVC events is based on the identification of two consecutive steady states. Only for this purpose, the standard defines that an r.m.s. voltage is in a steady-state condition “if all the immediately preceding 100/120 Urms(1/2) values remain within an RVC threshold from the arithmetic mean of those 100/120 Urms(1/2) values”. IEC 61000-4-30 does not define an RVC threshold. It only indicates that the RVC threshold should be set by the user according to the application, as a percentage of the declared input voltage Udin, recommending a range of 1% to 6% of this voltage.
On the other hand, EN50160:2010/A1:2015 [2], based on the Norwegian power quality regulations [3]-[4], defines the requirements and limits in the number and magnitude for these events (only applicable in Norway). An RVC event is defined
as a change in the r.m.s. voltage in a range of ±10% of the nominal or declared voltage, with a rate of change faster than 0.5%/sec of the nominal voltage. The half period r.m.s. value of the voltage, Uhp,is the basic magnitude for analysis of these events. The Uhp magnitude is the r.m.s. voltage determined over a half period between consecutive zero crossings of the fundamental frequency voltage. The voltage is considered to be in stationary-state when the Uhp magnitude is in a range of ±0.5% of the nominal or the declared voltage during at least one second.
RVCs can be caused by motor starting, capacitor banks switching, load switching and sudden load variations, and their main effect is light flicker, but other non-flicker effects have been reported in the literature [5]. The magnitude and number of RVC events in a specific power system should be limited in order to assess its correct performance. EN50160:2010 specifies a limit of 5% for these events, but more significant variations up to 10% can occur for some switching events. A summary of the RVC limits in different IEC standards can be seen in [6]. IEEE standards do not provide specific recommendations, but individual utilities have their own guidelines in the range of 4% to 7% [7].
The purpose of this paper is to report our experience in the application of the IEC standard method in the measurement of RVC events in different low and medium voltage power system networks and to point out some of the limitations of the standard method in the detection and the characterization of these events.
The paper is arranged as follows. Section II presents a short review of the IEC standard method. Section III studies the effect of the RVC threshold in the performance of the method, presenting some results from real power system networks. Section IV studies the limitations of the method in the detection of RVC events as a function of the rate of change of voltage dv/dt during the event. Section V considers the aggregation of consecutive RVC events when modifying the steady-state condition and how that can affect the detection capabilities of RVC events in load switching operations, as is the case of some types of wind turbines, and finally, Section VI presents the conclusions.
Limitations in the use of the IEC standard method
for detection and analysis of rapid voltage changes
in power system networks
This work received financial support from the Spanish MINECO through the grants ENE2014-54039-R and DPI2014-53317-R (co-financed with European Regional Development Fund), and by the University of the Basque Country UPV/EHU through the project UFI11/16. The authors want to thank Walqa Technology Park (Spain) for the opportunity to measure the available WT free of charge for the purpose of this work.
II. DETECTION AND EVALUATION OF RVC EVENTS According to [1], for a class A instrument, the detection of an RVC should be initiated recording an initial set of 100/120 Urms(1/2) (for 50/60 Hz systems respectively) and computing the arithmetic mean of those values.
To detect and RVC event, first, a ‘voltage-is-steady-state’ logic signal shall be created for each voltage channel. This logic signal is true when the voltage is in steady state, and false otherwise. This logic signal is updated for each new Urms(1/2) value. Every time a new Urms(1/2) value is available, the arithmetic mean of the previous 100/120 Urms(1/2) values, including the new value, is calculated. If every one of the previous 100/120 Urms(1/2) values, including the new value, is within the RVC threshold of the arithmetic mean, then the ‘voltage-is-steady-state’ signal for that channel is set to true; otherwise, it is set to false. When the ‘voltage-is-steady-state’ logic signal changes from true to false the RVC begins. Once the RVC event has begun, an RVC hysteresis is applied to the RVC threshold, disabling changes to the ‘voltage-is-steady-state’ logic signal for 100/120 half cycles.
Finally, an RVC event ends when the ‘voltage-is-steady-state’ logic signal changes from false to true. Then the RVC hysteresis is removed from the RVC threshold and the end of the event is time stamped 100/120 half cycles prior to the logic signal changing from false to true.
Four parameters characterize an RVC event by: start time, duration, ΔUmax and ΔUss (Fig. 1).
• The start time of the event shall be time stamped with the time when the “voltage-is-steady-state” logic signal became false and initiated the RVC event.
• The event duration is 100/120 half cycles shorter than the length of time during which the “voltage-is-steady-state” logic signal is false.
• ΔUmax is the maximum absolute difference between any of the Urms(1/2) values during the RVC event, and the final arithmetic mean 100/120 Urms(1/2) value just prior to the RVC event.
• ΔUss is the absolute difference between the final arithmetic mean 100/120 Urms(1/2) value just prior to the RVC event and the first arithmetic mean 100/120 Urms(1/2) value after the RVC event.
Fig. 1. RVC events as defined in [1]
III. EFFECT OF THE DETECTION THRESHOLD IN THE PERFORMANCE OF THE METHOD
As was previously mentioned, IEC 61000-4-30 does not define a rapid voltage change threshold, just recommending a range of 1% to 6% of Udin. The selection of the RVC threshold and the RVC hysteresis can affect the characterization of the event. The same RVC event detected with different instruments using different RVC thresholds and different RVC hysteresis can result in different RVC parameters (start time, duration, ΔUmax and ΔUss).
As an example of the effect of the selection of the RVC threshold in the detection and assessment of RVCs, Fig. 2 and Table I show the results obtained in the detection of the same RVC event using two different RVC thresholds, 0.5% and 3% of the nominal voltage respectively, in the low-voltage distribution network reported in [6]. In both cases, the RVC hysteresis applied is 50% of the RVC threshold selected.
a)
b)
Fig. 2. Detection and characterization of a RVC event using two different RVC thresholds: Urms(1/2) magnitude and logic signal, a) 0.5% detection threshold, and
b) 3% detection threshold
TABLE I.RESULTS OBTAINED IN THE DETECTION AND CHARACTERIZATION OF THE SAME RVC EVENT WHEN USING TWO DIFFERENT RVC THRESHOLDS.
RVC threshold (%)
Start time (s)
Duration
(s) ΔUmax (%) ΔUss (V)
0.5 1.89 1.22 3.91 1.13
As can be seen from the results, the use of higher RVC detection thresholds and higher RVC hysteresis produces a delay in the detection of the event, shorter event duration, and different ΔUmax and ΔUss magnitudes. The large differences in the event duration and the ΔUss magnitude are because when using higher RVC thresholds and hysteresis, the Urms(1/2) value returns more rapidly to the stationary-state condition. Obviously, the effect on flicker of this event is the same, no matter what the RVC threshold and RVC hysteresis is used.
IV. EFFECT OF THE RATE OF CHANGE OF VOLTAGE DV/DT IN THE RVC DETECTION PERFORMANCE
An RVC event is defined as a quick transition in r.m.s. voltage between two steady-state conditions. However, there is no reference in IEC 61000-4-30 about how to measure this rate of change of voltage supply during the voltage change, or how quick an r.m.s. transition should be to be considered as an RVC event.
Taking into account the flicker effect produced by rapid voltage change events, EN 50160:2011/A1:2015 defines that the rate of change of voltage, dv/dt during the event should be faster than 0.5%UN/sec of the nominal voltage. According to [4], more than half of the population exposed to a test on the visibility of rapid voltage changes in lighting from lighting equipment, noticed the event when the rate of voltage change per second in a 230 volt system, was faster than 0.5%UN /sec.
This limit in the rate of change of voltage, only applicable in Norway, indirectly implies a maximum in the duration of an RVC event, i.e. the time required to reach the limit of ±10% of the nominal voltage that defines the range of these voltage events.
How fast should the rate of change of voltage during an RVC event be in order to be detected using the IEC standard method? To study the performance of the IEC standard method in the detection of RVC events as a function of the rate of change of voltage per second, simulated voltage waveform records of 50 Hz and 230 V r.m.s. with RVC transitions of magnitudes from 1% to 10% of the nominal voltage in steps of 1%, and rates of change of voltage from 0.5%UN/sec to 1000%UN/sec were used.
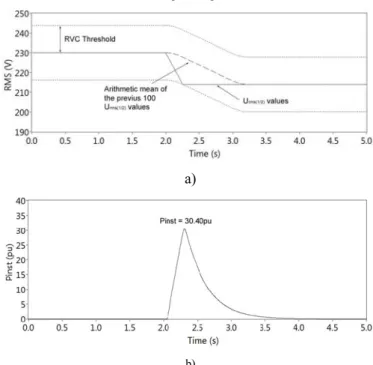
Fig. 3 shows the RVC detection limits as a function of the rate of change of voltage. Each curve represents the detection limit of the rate of change of voltage in %UN/sec, for 0.5%, 3% and 6% RVC thresholds respectively. Undetected RVCs are on the left side and detected RVCs lie on the right side of the corresponding curve. As can be seen from the results, higher RVC thresholds require higher rate of change of voltage during the event to be detected using the standard method. Thus, as an example, using a 6% RVC threshold, the highest threshold recommended in [1], a 7% ΔUmax RVC magnitude requires a minimum 27.1%UN/sec (62.33 V/sec in a 230 V system) rate of change of voltage to be detected. Fig. 4 shows the time evolution of the r.m.s. voltage and the instantaneous flicker sensation Pinst, measured using the digital implementation of the IEC standard flickermeter presented in [8],for this event.
The r.m.s. voltage never surpasses the RVC threshold, so this voltage event is not detected using the standard method, although the visible effect on the luminance of lighting equipment is clearly noticeable (Pinst,max = 30.4), as is shown in Fig. 4.b.
DETECTION LIMITS: RATE OF CHANGE OF VOLTAGE
RVC magnitude (%) RVC threshold: 0.5% RVC threshold: 3% RVC threshold: 6% 1 1.1% - - 2 1.1% - - 3 1.1% 89.2% - 4 1.1% 8.4% - 5 1.1% 6.4% - 6 1.1% 6.1% 1282% 7 1.1% 6.1% 27.1% 8 1.1% 6.1% 16.7% 9 1.1% 6.1% 13.9% 10 1.1% 6.1% 12.8%
Fig. 3. RVC detection limits for different detection threshold and rate of change of the voltage during the event.
a)
b)
Fig.4. a) Time evolution of the r.m.s. voltage, and b) instantaneous flicker sensation for a simulated RVC of 7% magnitude and 27.1%UN/sec rate of
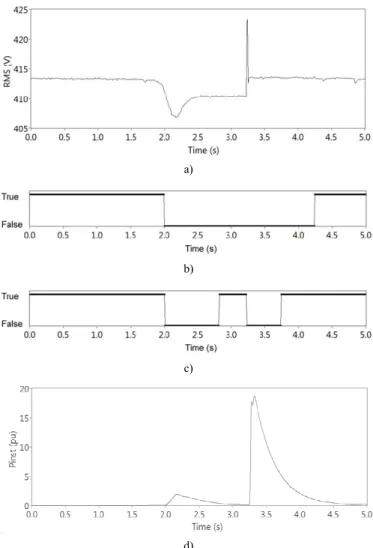
RVCs caused by motor starting or capacitor switching show sudden transitions in r.m.s. voltage with high dv/dt magnitude, faster than the RVC detection limits in Fig. 3. However, other load switching operations, as is the case of the wind turbines, could produce rates of change of voltage with lower magnitude. Fig. 5.a shows an example of two RVC events produced in the starting operation of a type I wind turbine, namely VESTAS V29, that was equipped with an asynchronous generator and a pitch-regulated power control. The first RVC event has a magnitude of 1.54% of the nominal voltage with a rate of change of 5%UN/sec.
V. TIME AGGREGATION OF RVC EVENTS
According to [4], when the time duration between two consecutive voltage changes reaches one second, the percentage of people that perceive the two events was between 80 and 90%, for voltage changes of 4% or 5% magnitude, whereas for consecutive voltage changes of these magnitudes only 0.5 seconds apart, 40% of people can distinguish the two events.
This section studies the effect of reduction of the time for detection of two consecutive RVC events from 1 second to 0.5 seconds on their detection and assessment.
The separate perception of consecutive RVC events will be different than the one reported in [4] for the case of consecutive events of different magnitude and different rate of change of voltage. This is the case of the RVC events produced by the starting operation in type I wind turbines. Those turbines are equipped with a soft-starter that limits the cut-in current based on thyristors. The thyristor cut-in took approximately 1.5 s, after that the wind turbine started to generate active power, generating two consecutive events. Normally, the second one has a higher magnitude and higher rate of change of voltage. In our opinion, it would seem that they should be considered separately because of their different effect on flicker.
The RVC event is detected as a single event at instant 2 sec and with 10.26 V magnitude and 1.14 seconds duration, using the standard method with a 0.5% of nominal voltage RVC threshold and 1 second for detection of consecutive events (Fig. 5.b).
On the other hand, the event is detected as two separate events, detected at instants 2.01 and 3.23 seconds, with 6.15 V and 12.96 V magnitudes respectively, using the same RVC threshold, when the time for the detection of consecutive RVC events is reduced to 0.5 seconds (Fig. 5.c). Fig. 5.d shows the time evolution of the instantaneous flicker sensation Pinst during the event, measured using the digital implementation of the IEC standard flickermeter presented in [8].
The time evolution of the instantaneous flicker sensation Pinst in Fig. 5.d shows that the event can be clearly noticed as two separate events by a standard observer, as the instantaneous flicker sensation shows a peak magnitude in each transition and a null value between the two transitions.
a)
b)
c)
d)
Fig. 5. Effect of time aggregation on the detection of RVC events and instantaneous flicker sensation.
CONCLUSION
This paper studies the limitations in the use of IEC 61000-4-30 standard method for detection and characterization of rapid voltage changes. The selection of the RVC threshold and the RVC hysteresis, the effect of the rate of change of voltage during the event, and the time aggregation between consecutive RVC events when using the standard method are considered. As a conclusion, we would suggest that the following should be considered:
• The definition of a RVC threshold and a RVC hysteresis in order to avoid that different instrument using different RVC threshold and RVC hysteresis provide different results for the same event.
• The definition of a method to estimate the rate of change of voltage dv/dt during the event.
• The definition of a minimum dv/dt magnitude for consideration of an event as a rapid voltage change event. • And the definition of a minimum aggregation time to
REFERENCES
[1] Electromagnetic Compatibility (EMC) – Part 4-30: Testing and measurement techniques. Power quality measurement methods, IEC 61000-4-30, Ed. 3, 2015.
[2] EN50160:2010/A1:2015, Voltage characteristics of electricity supplied by public electricity networks.
[3] Reg. No. 1557 of 30 November 2004: Regulations relating to the quality of supply in the Norwegian power system.
[4] K. Brekke, H. Seljeseth, and O. Mogstad, “Rapid voltage changes – definition and minimum requirements,” presented at the 20th International Conference on Electricity Distribution, CIRED 2009, Prague, Czech Republic, 2009.
[5] A. J. Schlabbach, D. Blume, T. Stephanblome, Voltage quality in electrical power systems, Institution of Electrical Engineers, London, 2001.
[6] Julio Barros, Jose Julio Gutiérrez, Matilde de Apráiz, Purificación Saiz, Ramón I. Diego, and Andoni Lazkano, “Rapid voltage changes in power system networks and their effect on flicker,” IEEE Transactions on Power Delivery, vol. 31, no. 1, February 2016, pp. 262-270.
[7] IEEE Std 1250TM-2011, IEEE Guide for identifying and improving
voltage quality in power systems.
[8] J.J. Gutierrez, L.A. Leturiondo, J. Ruiz, A. Lazkano, P. Saiz, I. Azkarate, “Effect of the Sampling Rate on the Assessment of Flicker Severity Due to Phase Jumps,” IEEE Transactions on Power Delivery, vol. 26 , no. 4, pp. 2215-2222, October 2011.
![Fig. 1. RVC events as defined in [1]](https://thumb-us.123doks.com/thumbv2/123dok_es/6859294.284975/2.892.457.832.401.904/fig-rvc-events-defined.webp)