Full PDF
12
0
0
Texto completo
(2) El Niño-Southern Oscillation (ENSO) is an oceanographic phenomenon that has occurred every five to ten years over the last 2000 years (Hoegh 1994) and is characterized by a weakening or reversing of the SE wind field over the Eastern Pacific Ocean. It generates important changes in the ocean (increased surface water temperatures and alterations in marine currents) and climatic patterns (air temperature, local winds) across the entire planet (Hoegh 1994, McPhaden 2004, McClanahan et al. 2007). ENSO has two clearly discernible phases: the warm and the cold phases; the latter has been called “La Niña” by some authors (Hoerling et al. 1997). Globally, ENSO generated massive bleaching during 1982-1983 (Glynn 1984, Glynn & Weerdt 1991), 1997-1998 (Bruno et al. 2001, McClanahan et al. 2008) and 2002-2003 (Strong et al. 2003). Therefore there is a need for research on the effects of 2010 ENSO on. MATERIALS AND METHODS Study Area: Puerto Cabello is located in the Central-West of the Venezuelan coast and its coral reefs are present on small islands close to Puerto Cabello Harbor. These islands are Isla Ratón (IRA), Isla Santo Domingo (ISD), Isla del Rey (IRE), Isla Alcatraz (IAL) and Isla Larga (ILA) (Fig. 1). Only IAL and ILA belong to Jose Miguel Sanz National Park, which was established in 1987 (Cisneros & Barrientos 2008). Field work: The field work was conducted in November, 2010. We evaluated all the islands at two depths: three and five meters, located in the fore-reef in all localities. The live coral cover, and bleached and non-bleached colony. 608.000. 1.162.000. 605.000. Caribbean coral reefs, and this study analyzes its effects on Venezuelan coasts.. 611.000. 614.000. Caribbean Sea ILA IRE. ISD. 1.159.000. Climatic station. ILA IRA. Puerto Cabello bay. 1.156.000. Puerto Cabello. Venezuela Caribbean Sea Venezuela. Fig. 1. Islands studied of Puerto Cabello, Venezuela: Isla Ratón (IRA), Isla Santo Domingo (ISD), Isla del Rey (IRE), Isla Alcatraz (IAL) and Isla Larga (ILA).. 528. Rev. Biol. Trop. (Int. J. Trop. Biol. ISSN-0034-7744) Vol. 60 (2): 527-538, June 2012.
(3) densities were estimated in 15 random quadrats of 1m2 at each depth, totaling an evaluated area of 30m2 in each locality. The diameter of all the colonies was also measured. All the colonies were categorized according to their proportion of bleached tissue as follows: (1) Healthy: Good coloration of colony without bleached areas, (2) Low-bleached colony: Includes those colonies with bleached areas or bright tones across less than 40% of its total area, (3) Moderately-bleached colony: Colonies with bleached areas or bright tones across 40-70% of its total area and (4) Highlybleached colony: Consist of those colonies with bleached areas or very bright tones across more than 70% of its total area. To determine the bleaching prevalence, the relation between the number of affected and total coral colonies per species was estimated. The intensity of coral bleaching per locality was calculated by dividing the bleached coral cover by the total coral cover at both evaluated depths. Salinity and surface seawater temperature (SST) were estimated in situ by a Multi-parameter Water Quality Meter (accuracy ±3ppt and ±0.3°C respectively). Furthermore, we analyzed monthly averaged satellite images (MODIS SCAR, 1km2 spatial resolution) of surface water temperature and chlorophyll-a (Chl-a) concentration, from August-November from 2008-2010 (Klein & Castillo 2011). Chl-a images were used in order to estimate the salinity of the research area due to its negative correlation with this parameter (Fang et al. 2010). We used information provided by the climatic station of the “Dirección de Hidrografía y Navegación”, Puerto Cabello, to evaluate meteorological factors, specifically: total precipitation (mm), air temperature (°C) and wind velocity (m/s) in August, October, November and December of 2009 and 2010. September data were not available in both years. ANOVA (Two-ways) and Tukey tests were used to compare prevalence and total live cover of scleractinian corals, as well as species population densities between the study sites and. depths. Live cover and prevalence data were normalized using the following formula: X=Log(x)+1. Variance equality (Levene 1960) and normality (Shapiro & Wilks 1965) tests were used in order to verify the data distribution. RESULTS Cover and densities of coral colonies: A high spatial variability was observed in the coral live cover of the sampled localities. The mean values of scleractinian cover at both depths in all the sampled sites are presented in table 1. Statistically, the coral cover of ILA was significantly higher than IRA (p=0.00), ISD (p=0.01) and IRE (p=0.03), and IAL was significantly higher than IRA (p=0.03). Differences between depths were not significant (p=0.48). We observed 15 scleractinian species in the study area, IAL being the richest (12 species), followed by ILA and IRE (eight species), ISD (six species) and IRA (four species). The most noteworthy finding was the high cover of Erythropodium caribaeorum (35.1±1.2%) and Palythoa caribaeorum (7.3±7.8%) at IRA and the high cover values of C. natans and M. annularis at ILA (21.8±23.8 and 9.8±8.3%) and IRE (5.9±13.4 and 10±21.4%) (Table 2). Bleaching: At all the sampled localities, 93 of 160 scleractinian colonies (58.3%) had experienced different levels of bleaching. However, in terms of live coral cover, 46.3% was completely bleached. The mean intensity of bleaching was highest at IRA (62.73±36.55%) followed by IRE (44.72±39.36%), ISD (25.53±22.31%), IAL (24.29±17.73%), and finally ILA (20.25±14.00%). However, only IRA differed significantly from the rest of the sampled localities (p<0.05). Most localities had a higher number of bleached scleractinian colonies at 5m depth, except IRA and ILA, where this. Rev. Biol. Trop. (Int. J. Trop. Biol. ISSN-0034-7744) Vol. 60 (2): 527-538, June 2012. 529.
(4) TABLE 1 Colony densities, hard coral live cover, number of species and scleractinian colony diameters (See text for localities’ codes). Locality IRE3M IRE5M IAL3M IAL5M IRA3M IRA5M ISD3M ISD5M ILA3M ILA5M. Scleractinian live coral cover (%) Average SD 14.17 28.36 20.33 46.51 28.94 66.33 25.67 66.97 1.17 3.19 7.00 19.66 11.73 32.23 8.93 21.99 31.80 33.79 40.00 56.35. Colony density (Col./m2) Average 1.47 0.53 1.60 0.67 0.67 0.27 1.07 0.40 2.80 1.07. SD 1.19 0.83 0.99 0.72 0.72 0.46 0.88 0.63 1.74 0.70. Number of scleractinian species. Colony diameter (cm) Average 20.14 76.25 46.55 77.00 4.40 52.50 22.00 38.00 21.74 75.00. 7 3 9 7 3 2 5 3 5 3. SD 39.80 49.26 57.08 55.19 3.98 37.75 42.75 25.95 27.83 55.26. TABLE 2 Cnidarian live cover at five study sites. Species. IRE. IAL. IRA. ISD. ILA. Average. SD. Average. SD. Average. SD. Average. SD. Average. SD. 0.97. 2.91. 0.90. 3.48. 0.83. 3.23. 0.30. 0.80. 0.00. 0.00. C. natans. 5.87. 13.38. 2.68. 5.71. 2.83. 7.25. 0.00. 0.00. 21.77. 23.80. M. annularis. 10.03. 21.44. 4.69. 11.90. 0.00. 0.00. 7.73. 18.44. 9.73. 8.28. M. faveolata. 0.00. 0.00. 8.17. 15.37. 0.00. 0.00. 0.00. 0.00. 0.00. 0.00. M.franksi. 0.00. 0.00. 8.23. 20.70. 0.00. 0.00. 0.00. 0.00. 0.67. 2.58. P. astreoides. 0.08. 0.27. 0.86. 2.66. 0.25. 0.65. 1.18. 3.64. 2.48. 5.71. S,siderea. 0.07. 0.26. 1.00. 3.87. 0.00. 0.00. 0.00. 0.00. 0.00. 0.00. A. agaricites. 0.02. 0.06. 0.08. 0.25. 0.17. 0.29. 0.05. 0.10. 0.75. 2.76. E.fastisgiata. 0.00. 0.00. 0.00. 0.00. 0.00. 0.00. 0.07. 0.26. 0.17. 0.65. M. alcicornis. 0.79. 2.87. 0.93. 0.91. 1.97. 1.82. 2.57. 4.10. 0.20. 0.53. M. complanata. 0.00. 0.00. 0.57. 0.54. 0.98. 3.77. 1.70. 6.45. 0.00. 0.00. E. caribaeorum. 3.84. 10.23. 3.51. 3.28. 35.05. 1.95. 6.00. 11.28. 0.57. 1.85. P. caribaeorum. 3.31. 8.59. 3.73. 3.63. 7.28. 7.82. 1.00. 3.21. 0.00. 0.00. D. strigosa. number was higher at 3m depth. These differences were not significant (p<0.05). IRA and IRE had the highest number of moderately and highly-bleached colonies, whereas ILA and IAL exhibited the smallest proportion of highly bleached colonies. ISD and IAL had the major proportion of healthy colonies (Fig. 2). 530. We observed 11 scleractinian, two hydrocoral (Millepora alcicornis y M. complanata), one zoanthid (P. caribaeorum) and one octocoral (Erythropodium caribaeorum) species affected by bleaching. M. cavernosa and M. faveolata were the most affected scleractinian species; however, it is important to note that from the total of 31 colonies of C. natans. Rev. Biol. Trop. (Int. J. Trop. Biol. ISSN-0034-7744) Vol. 60 (2): 527-538, June 2012.
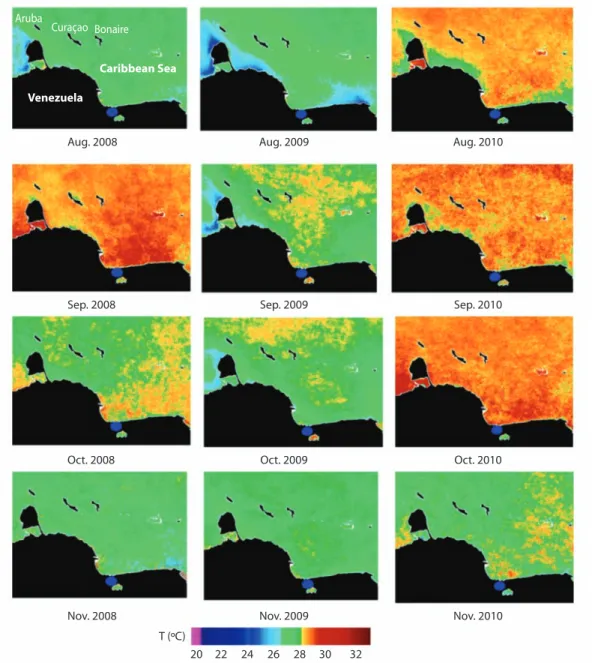
(5) Proportion of Scleractinian colonies (%). 100 90 80 70 60 50 40 30 20 10 0. IRE3M IRE5M IAL3M IAL5M IRA3M IRA5M ISD3M ISD5M ILA3M ILA5M. S. intercepta. T. aurea. E. fastisgiata. M. decactis. A. agaricites. S. siderea. P. astreoides. M. cavernosa. M. franksi. M. faveolata. M. annularis. C. natans. D. labyrinthiformis. 100 90 80 70 60 50 40 30 20 10 0 D. strigosa. Proportion of Scleractinian colonies (%). Fig. 2. Proportion of total scleractinian colonies at four levels of bleaching, locality and depth. IRE3M, 21; IRE5M, 8; IAL3M, 23; IAL5M, 10; IRA3M, 10; IRA5M, 4; ISD3M, 16; ISD5M, 6; ILA3M, 42; ILA5M, 16. Normal conditions , Low bleaching , Moderate bleaching , High bleaching .. Fig. 3. Proportion of colonies of species at each level of bleaching. Number of observed colonies: D. strigosa, 12; D. labyrinthiformis 1; C. natans, 32; M. annularis, 48; M. faveolata, 6; M. franksi 6; M. cavernosa 2; P. astreoides, 31; S. siderea 2; A. agaricites, 15; M. decactis, 3; E. fastisgiata, 4; S. intercepta 1; M. angulosa, 1. Normal conditions , Low bleaching , Moderate bleaching , High bleaching .. counted, 27 showed different levels of bleaching (87.1%), whereas 31 of 46 colonies of M. annularis, demonstrated minor bleaching (Fig. 3). Water salinity and temperature: Surface temperature of the water estimated in situ in all the localities was relatively homogeneous oscillating slightly between 28 and 29ºC, whereas salinity concentrations were 30ppm in IRE and IRA and 33ppm in ILA, ISD and IAL.. Based on the satellite images, temperature values during August 2008 and 2009 were between 27 and 28ºC, however in 2010 they were between 28.5 and 29ºC. Conversely, the surface water temperature in September was relatively high, especially in 2008 and 2010, when it oscillated between 28.5 and 30.5ºC. October registered the highest temperature in this study at 31ºC, in contrast to 2008 and 2009, which registered maximum temperatures of 29ºC and 28.0ºC, respectively.. Rev. Biol. Trop. (Int. J. Trop. Biol. ISSN-0034-7744) Vol. 60 (2): 527-538, June 2012. 531.
(6) study area Chl-a concentrations are relatively low and stable with maximum values of 1.5 mg/cm3 in comparison with other coastal zones shown in the images (Fig. 5). Precipitation in Puerto Cabello harbor in October, November and December were significantly higher in 2010 than in 2009 (p<0.05). A. In November, the temperature was the lowest in all the evaluated years, being 28ºC in both 2008 and 2009. However, in 2010 a value of 30ºC was observed (Fig. 4). An evaluation of Chl-a concentrations revealed a pattern of regional increase in 2010 compared with 2008 and 2009. However, in the Aruba. Curaçao Bonaire Caribbean Sea. Venezuela Aug. 2008. Aug. 2009. Aug. 2010. Sep. 2008. Sep. 2009. Sep. 2010. Oct. 2008. Oct. 2009. Oct. 2010. Nov. 2009. Nov. 2010. Nov. 2008 T (ºC) 20. 22. 24. 26. 28. 30. 32. Fig. 4. Satellite images MODIS SCAR of the Sea Surface Temperature of the Venezuelan central-west coast from August (Aug), September (Sept), October (Oct) and November (Nov) of 2008, 2009 and 2010 (Klein & Castillo 2010). Study area ( ).. 532. Rev. Biol. Trop. (Int. J. Trop. Biol. ISSN-0034-7744) Vol. 60 (2): 527-538, June 2012.
(7) Aruba. Curaçao Bonaire Caribbean Sea. Venezuela Aug. 2008. Aug. 2009. Aug. 2010. Sep. 2008. Sep. 2009. Sep. 2010. Oct. 2008. Oct. 2009. Oct. 2010. Nov. 2009. Nov. 2010. Nov. 2008 Chla (mg/m3) 0. 2. 4 6 8 10 18. Fig. 5. Satellite MODIS SCAR of the chlorophyll concentration (mg/cm3) of the Central Venezuelan coast from August (Aug), September (Sept), October (Oct) and November (Nov) of 2008, 2009 and 2010 (Klein & Castillo 2010). Study area ( ).. significant drop of wind intensity (p<0.05) was also observed in 2010. Conversely, significant differences in air temperature between both years were not observed (Fig. 6). DISCUSSION Typical features of the ENSO phenomenon were observed in satellite images and climatic data. Data confirmed an important increase in SST (Hoegh 1994), abnormal precipitation. pattern (Day & Wigley 2000) and decrease in wind intensity (Taylor et al. 2002) compared with previous years. Although not considered in this study, it is very likely that a synergy and interaction of these factors affected the coral reefs in the study area. It is important to note that changes in temperature and salinity have been reported as factors which induced bleaching separately. However, in combination, they are likely more damaging than the sum of their individual effects.. Rev. Biol. Trop. (Int. J. Trop. Biol. ISSN-0034-7744) Vol. 60 (2): 527-538, June 2012. 533.
(8) 350. A. Precipitation (mm). 300 250 200 150 100 50 0. Aug.. Oct.. Nov.. Dec.. 6 Wind Speed (m/s). 4 3 2 1 0. Air Temperature (ºC). B. 5. 40 35 30 25 20 15 10 5 0. Aug.. Oct.. Nov.. Dec.. C. Aug.. Oct.. Nov.. Dec.. Fig. 6. A: Precipitation (mm), B: wind speed (m/s) and C: air temperature (ºC) in August (Aug), October (Oct), November (Nov) and December (Dec), 2009 and 2010 .. Villamizar et al. (2008) indicated that bleaching is considered severe when over 50% of colonies are affected. Based on that criterion, the bleaching recorded in the study area could be categorized as severe. In fact, the level of bleaching was much more prevalent in comparison with previously reported bleaching in Venezuelan coral reefs by Lang et al. (1992) in Morrocoy National Park (MNP) (4.1%), Rodriguez et al. (2010) in four coral reefs on the Venezuelan coast (18%), Villamizar et al. (2008) in Los Roques National Park (LRNP) (9.9%) and Rodríguez et al. (2008) in MNP (26.5%) and LRNP (3.7%). 534. Intensity of bleaching from the ENSO warming showed an important spatial heterogeneity in the study area, with a clear decreasing gradient from the continent, being the closest coral reefs the most affected (IRA and IRE). Although in situ salinity values oscillated within the tolerance range for corals (25 and 40ppm; Edmondson 1928, Nyawira et al. 1987), it is likely that the crucial trigger was a drop in salinity caused by a great volume of continental fluvial water from the very large amount of precipitation that occurred in November. Such reductions in salinity were previously reported by Delcroix et al. (1998) during the ENSO 1997-1998. Chlorophyll concentration patterns were not clearly detected locally. This is likely due to the image scale and the flow of the rivers in the study area or nearby zones (Burro sin cabeza and Goaigoaza Rivers) were not large enough (pers. observ.) to be detected with the available images. However, there was a clear increase in Chl-a concentration regionally, indicating that there was an important effect from ENSO on the Venezuelan coast. Westmacott et al. (2000) and Ouillon et al. (2005) reported that large amounts of precipitation and low salinity are possibly the consequence of the “cold phase” of ENSO, known as “La Niña” and Glynn (1991) asserted that a decrease in salinity concentration is the second most common trigger for coral reef bleaching. Increases in temperature could also have provoked the massive bleaching. Satellite images showed that in August, September and October 2010, the average SST value was 31ºC, which was greater than in previous years (2008 and 2009), and more than the maximum healthy temperature for coral reefs (29.5ºC). Such surface sea temperature increases are typical of ENSO (Glynn 1991) and it has been remarked that between 1991 and 1998, almost half of the massive coral bleaching reported were caused by ENSO 1997-1998 (Glynn 2000). Done et al. (2003) pointed out that a key factor which produces bleaching of coral reefs is their number of exposure days to high temperatures. They claimed that exposure to temperatures over. Rev. Biol. Trop. (Int. J. Trop. Biol. ISSN-0034-7744) Vol. 60 (2): 527-538, June 2012.
(9) 30ºC for 20-40 days would lead to massive bleaching. According to satellite images, coral reefs in the study area were exposed to 31ºC temperatures for approximately 90 days. Therefore, this three month period of increased temperature could have been a key factor in the widespread bleaching of the Puerto Cabello coral reefs, or at least, an important element resulting in these coral reefs being more vulnerable to lower salinity concentrations in November. Increased SST and duration observed have caused extensive bleaching in Australia and Panama (Jones et al. 1997, Glynn 1990). Villamizar et al. (2008) and Rodríguez et al. (2008) indicated that coral reefs were most bleached in November, despite the fact that SST was lower than in September and October. Villamizar et al. (2008) explained that the bleaching happened possibly because coral colonies suffered an accumulated stress. This was due to their exposure to high SST in the previous months. Jokiel & Coles (1977) pointed out that when a simultaneous increase in SST and decrease in salinity occur, the survival abilities of coral colonies are significantly reduced. High turbidity observed in all the reefs, especially those closest to the continent (IRE and IRA), was most likely because of the high precipitation recorded. This could be an important factor in the prevalence of differences in bleaching between both evaluated depths. The quantity and quality of light or photosinthetically active radiation at five meters is lower than at three meters, which could lead to a greater loss of Symbiodinium algae thereby increasing the bleaching event. Baker (2003) asserted that shallower corals have a greater diversity of Symbiodinium than deeper corals, and in turn, helps them to resist major variation in environmental conditions, and as a result they are less vulnerable to bleaching events. Differential effects on coral species: Important interespecific differences were observed in the effects of bleaching on scleractinian corals in the study area. Based on the number of evaluated colonies and prevalence. and intensity of bleached colonies, a hierarchical order was noted, which was, in decreasing order: C. natans, M. faveolata, M. cavernosa, M. franksi, M. annularis, A. agaricites, D. strigosa and P. astreoides. In contrast, D. labyrinthiformis, E. fastisgiata, T. aurea and S. intercepta were apparently not affected by the event. However, few colonies of these species were evaluated due to their low abundance. Therefore, vulnerability could be categorized according to genus in the following order: Colpophyllia, Montastraea, Agaricia, Diploria and Porites. This result partially coincides with Villamizar et al. (2008) who indicated that the most affected scleractinian species was D. labyrinthiformis followed by M. annularis, M. faveolata and P. astreoides (considering only the species investigated in this study). Conversely, Rodríguez et al. (2008) found that the species most affected by bleaching were M. franksi and M. faveolata. Trench & Blank (1987) and Fitt & Warner (1995) pointed out that interespecific differences in bleaching tolerance are related to physiological dissimilarities associated with zooxanthellae. LaJeunesse (2002) and Baker (2003) remarked that there is an important variability in Symbiodinium clades, which defines the vulnerability of coral species in presence of bleaching factors. For example, the more Symbiodinium clade richness a coral species has, the more tolerant it will be when facing adverse conditions (Baker 2003). Baker (2003) indicated that M. annularis and M. faveolata contain up to four clades: A, B, C and D, whose presence varies according to depth (A, B and D present to 6m; C from 3-14m). Conversely, clade D is predominant in M. franksi and B and C in C. natans. Moreover, Glynn et al. (2001) and Baker (2003) asserted that the clade D is the most tolerant to temperature variations and Gates & Edmunds (1999) pointed out that clades A and B are less vulnerable to bleaching factors than clade C. Baker (2003) claimed that the Montastraea genus is relatively flexible in presence of environmental changes in comparison with other genera. This argument might explain the. Rev. Biol. Trop. (Int. J. Trop. Biol. ISSN-0034-7744) Vol. 60 (2): 527-538, June 2012. 535.
(10) RESUMEN. reason why bleaching of C. natans was higher than Montastraea species. However, the aforementioned tolerances are only related to temperature changes, and not to salinity variability. Therefore, the vulnerability of the clades may change before the incidence of this factor. Importantly, most of the evaluated colonies showed severe bleaching (over 70%), of which a high proportion were completely bleached. This makes the recovery of the affected reefs difficult and could lead to massive mortality, especially in IRA and IRE. Whelan et al. (2007) asserted that completely bleached colonies of C. natans and Porites porites presented a larger mortality percentage affecting importantly the coral cover in evaluated reefs, and Rogers (1990) and Trench & Blank (1987) pointed out that the bleached tissue of M. annularis dies more frequently than the bleached tissue of other species. In conclusion, it is very likely that bleaching in Puerto Cabello coral reefs was caused by the synergetic effects of increases in SST and decreases in salinity, as a consequence of the ENSO phenomenon. However, the lower salinity could have been the main trigger of this event whilst the SST could have contributed to a more vulnerable physical environment. In relation to bleached scleractinian species, it is evident that structural species such as C. natans and M. annularis were the most affected. Therefore, recovery of these species is fundamental to the persistence and resilience of the coral reefs of Puerto Cabello.. El Niño ha generado blanqueamientos masivos en todo el mundo. El objetivo del estudio fue evaluar el blanqueamiento masivo de los arrecifes coralinos de Puerto Cabello, Venezuela debido al efecto del ENSO, 2010. En cada arrecife se seleccionaron dos profundidades: tres y cinco metros. Para determinar las concentraciones de clorofila-a y la temperatura en los meses de Agosto a Noviembre 2008 al 2010 se analizaron imágenes de satélite (tipo Modis Scar 1km2 de resolución). La precipitación, la velocidad del viento y la temperatura del aire fueron evaluadas según datos metereológicos del 2009 y 2010. La cobertura coralina y la densidad de colonias fue estimada, se anotó la cobertura de coral vivo de cada especie y el número y diámetro de colonias sanas y con blanqueamiento. Cada colonia fue clasificada según su área con blanqueamiento. Un 58.3% del total de las colonias fueron afectadas, estas pertenecen a 11 especies hexacoralinas. Las localidades con mayor afectación fueron las más cercanas al continente, la cuales presentaron una proporción de blanqueamiento de hasta 62.73±36.55% y un mayor porcentaje de colonias afectadas, mientras que la localidad más lejana presentó un 20.25±14.00% y una menor proporción de colonias afectadas, respectivamente. La salinidad registrada in situ varió entre 30 y 33ppm y se observó un alto nivel de turbidez. Según las imágenes de satélite, en el 2010 se observó una temperatura del agua de hasta 31ºC en los meses de agosto, septiembre y octubre. Los valores de clorofila fueron mayores en 2010 que en 2008 y 2009. Los datos meterorológicos indicaron que los valores de precipitación del 2010 triplicaron los del 2009. El blanqueamiento masivo fue la consecuencia de tres meses de altas temperaturas seguido de un mes de intensas precipitaciones asociadas al ENSO. Sin embargo, este último factor probablemente fue el detonante debido al gradiente observado.. ACKNOWLEDGMENTS. REFERENCES. We are grateful to Dirección de Hidrografía y Navegación de Venezuela (DHN), especially to Adrián Alaña, Bill Abreu, Adriana Becerra and Sohanny Farías for all the assistance provided in the achievement of this project and Eduardo Klein for providing the satellite images.. Baker, A. 2003. Flexibility and specificity in coral-algal symbiosis: Diversity, Ecology, and Biogeography of Symbiodinium. Annu. Rev. Ecol. Evol. Syst. 34: 661-89.. 536. Palabras clave: ENSO, arrecifes, blanqueamiento, Puerto Cabello.. Bruno, J., C. Siddon, J. Witman, P. Colin & M. Toscano. 2001. El Niño related coral bleaching in Palau, Western Caroline Islands. Coral Reefs 20: 127-136.. Rev. Biol. Trop. (Int. J. Trop. Biol. ISSN-0034-7744) Vol. 60 (2): 527-538, June 2012.
(11) Buddemeier, R. & D. Fautin. 1993. Coral bleaching as an adaptive mechanism: A testable hypothesis. Bioscience 43: 320-326. Cisneros, E. & Y. Barrientos. 2008. Fluctuaciones anuales de la temperatura, salinidad, pH y alcalinidad total en aguas superficiales de Isla Larga, estado Carabobo, Venezuela. Rev. Inv. 63: 153-172. Coles, S.L. & B.E. Brown. 2003 Coral bleaching-capacity for acclimatization and adaptation. Adv. Mar. Biol. 46: 183-223. Day, A. & T. Wigley. 2000. Global patterns of ENSO induced precipitation, Geophys. Res. Lett. 27: 1283-1286. Delcroix, T., L. Gourdeau & C. Henin. 1998. Sea surface salinity changes along the Fiji: Japan shipping track during the 1996 La Niña and 1997 El Niño period, Geophys. Res. Lett. 25: 3169- 3172. Done, T., P. Whetton, R. Jones, R. Berkelmans, J. Lough, W. Skirving & S. Wooldridge. 2003. Global Climate Change and Coral Bleaching on the Great Barrier Reef. Queensland Government Department of Natural Resources and Mines. Edmondson, C. 1928. The ecology of a Hawaiian coral reef. Bernice P. Bishop Museum Bull. 45: 1-64. Fang, L., S. Chen & J. Qian. 2010. Deducing salinity from Chlorophyll-a using EO-1 Hyperion satellite imagery: A case study in Modaomen and Shawan waterway, Pearl River Estuary, South China. 18th Inter. Conf. Geoinformatics. Beijing, China. Fitt, W.K. & M.E. Warner. 1995. Bleaching Patterns of Four Species of Caribbean Reef Corals. Biol. Bull. 189: 298-307. Gates, R. & P. Edmunds. 1999. The Physiological Mechanisms of Acclimatization in Tropical Reef Corals Amer. Zool. 39: 30-43. Glynn, P. 1984. Widespread coral mortality and the 19821983 El Niño warming event. Environm. Conserv. 11: 133-146. Glynn, P. 1990. Global Ecological consequences of the 1982-1983 El Niño-Southern Oscillation. Elsevier Oceanography Series, New York, USA. Glynn, P. 1991. Elimination of two reef-building hydrocorals following the 1982-83 El Niño warming event. Science 253: 69-71. Glynn, P. & W.H. de Weerdt. 1991. Elimination of two reef building hydrocorals following the1982-83 El Niño warming event. Science 253: 69-71.. Glynn, P. 1996. Coral reef bleaching: facts, hypotheses and implications. Glob. Chan. Biol. 2: 495-509. Glynn, P.W. 2000. El Niño-Southern Oscillation mass mortalities of reef corals: a model of high temperature marine extinctions? In E. Insalaco, P. Skelton & T Palmer (eds.) Organism-Environment Feedbacks in Carbonate Platforms Systems: components and interactions. Geological Society, London, Special Pub. 178: 117-133. Glynn, P.W., J.L. Mate, A.C. Baker & M.O. Calderón. 2001. Coral bleaching and mortality in Panama and Ecuador during the 1997-1998 El Niño-Southern Oscillation event: spatial/temporal patterns and comparisons with the 1982-1983 event. Bull. Mar. Sci. 69: 79-109. Hoegh, O. 1994. Global warming and coral reef ecosystems: Ecological consequences of increased tropical sea temperatures. Clim. Imp. Ser. 1: 1-37. Hoerling, M., A. Kumar & M. Zhong. 1997: El Niño, La Niña, and the nonlinearity of their teleconnections. J. Climate 10: 1769-1786. Jokiel, P. & S. Coles. 1977. Effects of temperature on the multiple stressors on corals mortality and growth of Hawaiian reef corals. Mar. Biol. 43: 201-208. Jones, R., R. Berkelmans & J. Oliver. 1997. Recurrent bleaching of corals at Magnetic Island (Australia) relative to air and seawater temperature. Mar. Ecol. Prog. Ser. 158: 289-292. Klein, E. & J. Castillo. 2010. Observatorio Oceanográfico Digital Del Mar Venezolano. Laboratorio de Sensores Remotos, Centro de Biodiversidad Marina INTECMAR-USB (Downloaded: January 27, 2011, http://ood.cbm.usb.ve). Kleypas, J. & O. Hoegh. 2005. Coral reefs and climate change: susceptibility and consequences, p. 19-29. In C. Wilkinson & D. Souter (eds.). Status of Caribbean CoralReefs after Bleaching and Hurricanes in 2005. Global Coral Reef Monitoring Networkand Reef and Rainforest Research Centre, Townsville, Australia. LaJeunesse, T. 2002 Diversity and community structure of symbiotic dinoflagellates from Caribbean coral reefs. Mar. Biol. 141: 387-400. Lang, J., H. Lasker, E. Gladfelter, P. Hallock, W. Jaap, F. Losada & R.G. Muller. 1992. Spatial and temporal variability during periods of “recovery” after mass bleaching on Western Atlantic coral reefs. Amer. Zool. 32: 696-706.. Rev. Biol. Trop. (Int. J. Trop. Biol. ISSN-0034-7744) Vol. 60 (2): 527-538, June 2012. 537.
(12) Levene, H. 1960. Robust Tests for Equality of Variances, in Contributions to Probability and Statistics. Stanford University, California, USA.. Strong, A.E., A.E. Strong & W. Skirving. 2003. Remote Sensing of Sea Surface Temperatures during 2002 Barrier Reef Coral Bleaching. Eos 84: 137.. McClanahan, T., M. Ateweberhan, C. Muhando, J. Maina & M. Mohammed. 2007. Effects of climate and seawater temperature variation on coral bleaching and mortality. Eco. Monog. 77: 503-525.. Taylor, M., D. Enfield & A. Chen. 2002. Influence of the tropical Atlantic versus the tropical Pacific on Caribbean rainfall. J. Geo. Res. 107 C9: 1-14.. McClanahan, T. 2008. Response of the coral reef benthos and herbivory to fishery closure management and the 1998 ENSO disturbance. Oecologia 155: 169-177 McPhaden, M. 2004. Evolution of the 2002/2003 El Nino. Amer. Met. Soc. 677-695. Nyawira, A. & A. Szmant. 1987 the effects of salinity stress on the rates of aerobic respiration and photosynthesis in the hermatypic coral Siderastrea siderea. Biol. Bull. 173: 539-551. Ouillon, S., P. Douillet, R. Fichez & J. Panche. 2005. Enhancement of regional variations in salinity and temperature in a lagoon, New Caledonia. Comptes Rendus Geoscience 337: 1509-1517. Rodríguez, A., C. Bastidas, S. Rodríguez, Z. Leão, R. Kikuchi, M. Oliveira, D. Gil, J. GarzónFerreira, M.C. Reyes, R. Navas, N. Santodomingo, G. Díaz, D. Venera, L. Florez, A. Rangel, C. Orozco, J.C. Márquez, S. Zea, M. López, J.A. Sánchez & M.C. Hurtado. 2008. The effects of coral bleaching in Southern Tropical America: Brazil, Colombia, and Venezuela, p. 105-114. In C. Wilkinson & D. Souter (eds.). Status of Caribbean Coral Reefs after Bleaching and Hurricanes in 2005. Global Coral Reef Monitoring Network, and Reef and Rainforest Research Centre, Townsville, Australia. Rodríguez, S., A. Cróquer, D. Bone & C. Bastidas. 2010. Severity of the 1998 and 2005 bleaching events in Venezuela, Southern Caribbean. Rev. Biol. Trop. 58: 189-196.. Trench, R. & R. Blank. 1987. Symbiodinium microadriaticum Fruendenthal,S. goreauii sp. nov., S. kawaguti sp. nov. and S. pilosum sp. nov.; Gymnodinoid dinoflagellate symbionts of marine invertebrates. J. Phycol. 23: 469-481. Villamizar, E., J. Posada & S. Gómez. 2003. Rapid assessment of coral reefs in the Archipiélago de Los Roques National Park, Venezuela (Part I: stony corals and algae). In J.C. Lang (eds.). Status of Coral Reefs in the Western Atlantic: Results of Initial Surveys, Atlantic and Gulf Rapid Reef Assessment. Atoll Res. Bull. 496: 512-529. Villamizar, E., H. Camisotti, B. Rodríguez, J. Pérez & M. Romero. 2008. Impacts of the 2005 Caribbean bleaching event at Archipiélago de Los Roques National Park, Venezuela. Rev. Biol. Trop. 56: 255-270. Westmacott, S., K. Teleki, S. Wells & J. West. 2000. Management of Bleached and Severely Damaged Coral Reefs. IUCN, Gland, Switzerland. Whelan, K., J. Miller, O. Sanchez & M. Patterson. 2007. Impact of the 2005 coral bleaching event on Porites porites and Colpophyllia natans at Tektite Reef, US Virgin Islands Coral Reefs 26: 689-693. Wilkinson, C. & D. Souter. 2008. Status of Caribbean coral reefs after bleaching and hurricanes in 2005. Global Coral Reef Monitoring Network, and Reef and Rainforest Research Centre, Townsville, Australia.. Rogers, C. 1990. Responses of coral reefs and reef organisms to sedimentation. Mar. Ecol. Prog. Ser. 62: 185-202.. Wilkinson, C. 2000. World-wide coral reef bleaching and mortality during 1998: a global change warning for the new millennium? In Seas of the Millennium: An Environmental Evaluation, Vol. III, Global Issues and Processes, Sheppard, C. (ed.). Elsevier, Amsterdam, Holland.. Shapiro, S.S. & M.B Wilks. 1965. An analysis of variance test for normality (complete samples). Biometrika 52: 591-611.. Williams, E. & I. Bunkley. 1990. The worldwide coral reef bleaching cycle and related sources of coral mortality. Atoll Res. Bull. 335: 1-71.. 538. Rev. Biol. Trop. (Int. J. Trop. Biol. ISSN-0034-7744) Vol. 60 (2): 527-538, June 2012.
(13)
Figure


+2

Documento similar
ABSTRACT Transformation of the Specialized Knowledge of Future Primary Teachers on Fraction Division
From the phenomenology associated with contexts (C.1), for the statement of task T 1.1 , the future teachers use their knowledge of situations of the personal
For the second case of this study, the features for training the SVM will be extracted from the brain sources estimated using the selected SLMs MLE, MNE and wMNE. The scenario is
No obstante, como esta enfermedad afecta a cada persona de manera diferente, no todas las opciones de cuidado y tratamiento pueden ser apropiadas para cada individuo.. La forma
Motivated by the dense-luminaries infrastructure and the concept of Cell-Free Massive MIMO, we proposed DenseVLC, a novel massive VLC system enabled by densely distributed LEDs
Figure 5. Haeme oxygenase-1 is localized in the red pulp of the spleen and is induced by activation of nAChRs.. that HO-1 overexpression has an anti-inflammatory
Díaz Soto has raised the point about banning religious garb in the ―public space.‖ He states, ―for example, in most Spanish public Universities, there is a Catholic chapel
By the consistency of the truncation, the metric and dilaton in (3.5), together with the constant-scalar field strengths (3.8), solve the field equations of massive type
It is important to make this identification because several studies [2-3, 8, 11], have reported the dissolution of magnetite, hematite, and greigite using oxalic acid, and agree
