Full PDF
10
0
0
Texto completo
(2) 11º0’0” N. Nicaragua. 10º0’0” N. A. 9º0’0” N. Costa Rica. Caribbean Sea. Pacific Ocean. 8º0’0” N. Panama. 0 86º0’0” W. B. 85º0’0” W. 84º0’0” W. 75 150. 300 km. 83º0’0” W. Wind speed (m s-1). 20 15 10 5 0. 2. 4 6 8 10 12 14 16 18 20 22 24 26 28 30. April 2009. Fig. 1. A. Sampling site (black arrow). B. Daily wind speeds measured at the meteorological station Liberia, Costa Rica. The grey bar indicates the sampling period.. MATERIAL AND METHODS Study site: The Papagayo wind is a strong north-easterly jet blowing through low elevation gaps of the Central American cordillera in southern Nicaragua and northern Costa Rica. The jet is driven by the sea level pressure difference between the Caribbean Sea and the eastern tropical Pacific (ETP) which develops during the boreal winter and the associated south-eastward migration of the subtropical Azores-Bermuda high (Clarke 1988, Amador et al. 2006, Romero-Centeno et al. 2007). Outbreaks of cold air masses from the North American continent into the Caribbean occasionally increase the sea level pressure difference between the two oceans and intensify the Papagayo winds (Clarke 1988, Alfaro & Cortés 2011). During such wind events, offshoreadvecting cyclonic and anticyclonic eddies spin 188. up south and north of the axis of the Papagayo Jet leading to upwelling of subsurface waters along the Nicaraguan coast and in the Gulf of Papagayo (McCreary et al. 1989, Ballestero & Coen 2004, Kessler 2006). The cyclonic eddies south of the Papagayo Jet intensify the shoaling of the thermocline within the Costa Rica Dome region, which is connected to the coast between March and April (Fiedler 2002, Fiedler & Talley 2006). Due to upwelling and wind mixing the SST can drop by up to 10°C within hours within the Gulf of Papagayo (Jiménez 2001, Alfaro & Cortés 2011). The coral habitats of the Gulf of Papagayo are of special interest due to the high abundance of large reefs built almost entirely by Pavona clavus and Pocillopora spp. and the presence of rare or endangered coral species with restricted distributions (Cortés & Jiménez 2003, Jiménez et al. 2010). Methods: The SST and the mole fraction of CO2 (xCO2) was measured by an underway pCO2 system (SUNDANS) at a water-depth of ~ 3 m. The system was set up on April 24th at 1:00 am at one of the outer piers of the Marina Papagayo (85°39’21.41”W; 10°32’32.89”N) in order to reduced impacts from the Marina at our sampling site. However, during the sampling period there was no ship traffic and the pier moved up and down with the tide so that water-depth from which we pumped the water remained constant throughout the experiment. SUNDANS was developed by “Marine Analytics and Data” (MARIANDA, Germany, www.marianda.com) according to the recommendations of the 2002 underway pCO2 system workshop in Miami, Florida (NOAA & AOML 2002). It was equipped with a shower type equilibrator, an open pre-equilibrator and a non-dispersive dual cell infrared gas analyzer (LI-7000). The LI-7000 was calibrated by using nitrogen gas (zero CO2) and a standard gas for CO2. The CO2 standard gases were checked against the standard gases provided by NOAA (CA07600 and CC311968) at the Institute for Baltic Sea Research in Warnemünde, Germany. The accuracy of the measured xCO2 was ±1.6 ppm. The xCO2 data were recorded every six. Rev. Biol. Trop. (Int. J. Trop. Biol. ISSN-0034-7744) Vol. 60 (Suppl. 2): 187-195, April 2012.
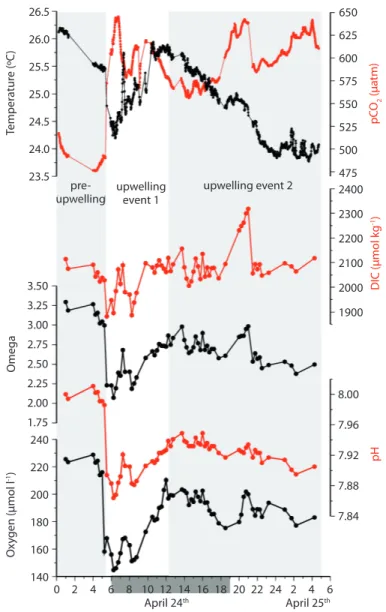
(3) seconds and subsequently averaged minute by minute. xCO2 was converted into pCO2 and the fugacity of CO2 (ƒCO2) according to equations provided by Zeebe and Wolf-Gladrow (2001). The SSTs were measured within the equilibrator. The atmospheric pressure and the wind speed were obtained from the meteorological station in Liberia approximately 30 km east of the sampling site (NCDC 2011). Salinity and the dissolved oxygen concentrations were determined by using WTW probes (Cond3310 and Multi 340i). The pH was measured using an Orion ROSS electrode and an Orion StarTM. The Orion ROSS electrode was calibrated by using NBS standards and re-calibrated by using the RCM standards (Batch 82: http://andrew. ucsd.edu/co2qc/). Ωa, DIC, and TA were calculated based on the ƒCO2 and the pH. In order remove effects caused by temperature changes, DIC and TA were used to compute the ƒCO2(DIC/TA) using a constant salinity and temperature of 34.51 and 25.01°C. RESULTS During the experiment the salinity and temperature varied between 34.4 and 34.9 and 23.7 and 26.2°C. The mean salinity and temperature of 34.51 and 25.01°C were used to calculate ƒCO2(DIC/TA) as mentioned before. On April 24th between 05:00 and 06:00 am the SST dropped precipitously from 26.4°C to 24.1°C (Fig. 2). This drop was associated with decreases in pH and oxygen concentration from 8.01 to 7.86 and 228 to 144 µmol l-1, respectively, as well as an increase in pCO2 from 475 to 645 µatm. Between 06:00 and 12:00 am, the SST increased from 24.1°C to 25.9°C, and then steadily decreased to a minimum value of around 23.9°C at ~ 23:00. The first and the second period during which cold water occurred at the surface are referred to as the first and the second upwelling event during the following discussion (Fig. 2). The period prior to the first upwelling event is considered as pre-upwelling period. Wind speeds measured at the Meteorological Station Liberia indicate that. the sampling period was characterized by an intensification of the Papagayo winds (Fig. 1). DISCUSSION The simultaneous drop of SST, dissolved oxygen, and pH indicate that oxygen-depleted and CO2-enriched subsurface waters were entrained into the surface layer in the early morning hours on April 24th (Fig. 2). The observed SST drop of 2.3°C was associated with a decrease in the oxygen concentration of 84 µmol l-1 corresponding to a 37% reduction of the dissolved oxygen concentration. During the second upwelling event the decrease in oxygen concentration and pH was less pronounced but reveal as the data obtained during the first upwelling event and elsewhere (Feely et al. 2008, Manzello et al. 2008, Manzello 2010b), that wind-driven upwelling events in the ETP can deliver oxygen-poor, acidic waters to the surface along the coast. Continuous measurements of SST in the vicinity of our sampling site between 1993 and 1996, within a reef built by the massive coral species Pavona clavus, show as mentioned before, that SST can decrease by up 8-10°C for some hours during upwelling events (Jiménez 2001). This SST-record was extended until March 2009 and revealed a mean SST of 25°C in April (Fig. 3a) which almost equals the mean SST of 25.09°C measured during our experiment. As indicated by the 1x1 degree gridded World Ocean Atlas Data (WOA09 2009) a temperature of 25°C associated with oxygen concentrations of 209 µmol l-1 occur on average at water-depth between 20 and 30 m within the this region in April (Fig. 3b). Since this oxygen concentration is similar to those measured during our experiment (Fig. 2) it is assumed that the upwelled water was originated at this depth-range during our experiment. Oxygen concentrations between 40 and 80 µmol l-1 which are assumed to represent a range below which benthic fauna and reef fishes start to respond to oxygen depletion (Nilsson et al. 2007, Diaz & Rosenberg 2008) occurred at water-depth between 75 and 100 m (Fig. 3b). These oxygen concentrations are associated. Rev. Biol. Trop. (Int. J. Trop. Biol. ISSN-0034-7744) Vol. 60 (Suppl. 2): 187-195, April 2012. 189.
(4) 26.0. 625 600 575. 25.0. 550. 24.5. 525. 24.0. 500. 23.5. preupwelling upwelling event 1. upwelling event 2. 475 2400 2300 2200 2100. 3.50. 2000. 3.25. 1900. Omega. 3.00 2.75 2.50 2.25. 8.00. 2.00 1.75 240 Oxygen (µmol l-1). DIC (µmol kg-1). 25.5. pCO2 (µatm). 650. 7.96 7.92. 220. pH. Temperature (ºC). 26.5. 7.88. 200. 7.84. 180 160 140. 0 2. 4 6 8 10 12 14 16 18 20 22 24 2 4 6 April 24th April 25th. Fig. 2. Temperature, pCO2, dissolved inorganic carbon (DIC) concentrations, omega (Ωa), pH, and dissolved oxygen concentrations determined at the pier of the Marina Papagayo, Costa Rica. The light bars indicate the pre-upwelling period and the second upwelling event.. with temperatures between approximately 14.5 and 16.5 C°. Since such low SSTs occur only during extreme strong upwelling events at the surface (Fig. 3a) oxygen-depletion caused the entrainment of oxygen-poor subsurface water appears only occasionally be of importance at the study site. However, this might change in future because mid-water oxygen minimum zone are expanding in the ETA (Stramma et al. 190. 2008, Stramma et al. 2010) and a strengthening of the trade winds system and the associated upwelling systems is assumed to be caused by global warming (Mitas & Clement 2005, 2006, Bakun et al. 2010). SSTs correlate not only with the oxygen concentrations but also with the pH and DIC/ TA ratios (Fig. 4 a, b). Varying values and relationships between these parameters and the. Rev. Biol. Trop. (Int. J. Trop. Biol. ISSN-0034-7744) Vol. 60 (Suppl. 2): 187-195, April 2012.
(5) A. B. Temperature (ºC) 12 14 16 18 20 22 24 26 28 0. 32. -50. 28. Depth (m). Temperature (ºC). 36. 24 20 16 12. -100 -150 -200. J F M A M J J A S O N D. 0. 50. 100. 150. 200. 250. Oxygen (µmol l-1). Month. Fig. 3. (a) Monthly mean temperatures (black circle) as well as maxima and minima derived from measurements carried out in a reef close to our sampling site between December 1994 and March 2009. (b) Profiles showing the distribution of temperature (black circles) and dissolved oxygen concentrations (open circles) in the water column. This data were selected from the 1x1 degree gridded World Ocean Atlas for the grid box at 85°W and 10°N.. SSTs indicate a different history of the water masses, which were entrained into the surface waters during the pre-upwelling period and the two upwelling events. The main factor controlling the pH and the pCO2 is the DIC/TA ratio as indicated by the correlation between this ratio, the pH and pCO2(DIC/TA) (Fig. 4 c, d). The DIC concentration and the TA are influenced by the precipitation and dissolution of calcium carbonate as well as by the photosynthesis and the respiration of organic matter (Fig. 5). In addition to these two biological processes windinduced turbulent mixing of surface and subsurface water could be another important factor affecting these parameters at our sampling site. Contrary to biological processes and mixing, the CO2 fluxes across the air-sea interface, which as assumed to be minor importance on the time scale considered here (Frankignoulle et al. 1996) influence the DIC concentration, only. Since respiration consumes oxygen and release DIC, oxygen-depleted subsurface waters are generally enriched in DIC. This appears not be the case at our study during the first upwelling event (Fig. 2). During this event water depleted in oxygen, DIC, and TA welled up and displaced surface waters enriched in all these parameters.. Enhanced DIC concentrations and high TA imply that the dissolution of carbonates was a dominant process within the surface water during the pre-upwelling period. The much slower entrainment of subsurface water and resulting stronger effect of the carbonate dissolution on the carbonate chemistry within the upwelled water might also explain the higher pH values within the surface water during the second upwelling event. Ignoring physical effects, increases of the DIC concentration and the TA would imply a mean carbonate dissolution to respiration ratio of ~1.8 during the pre-upwelling period as indicated by the linear correlation between DIC and TA (Fig. 5). During the first upwelling event the mean carbonate dissolution to respiration ratio was 1.3. If this ratio would have been < ~1 due to reduced dissolution of calcium carbonate and an enhanced respiration an increase in DIC and TA would have reduces instead of increased Ωa (Fig 5). Prior to the first upwelling event between 1:00 and 5:00 am, Ωa was ~3.2 with slightly lower than the values shown on maps (~3.5-3.6) derived from climatological data for the region off Costa Rica (Manzello et al. 2008). During the first upwelling event, Ωa fell to values as. Rev. Biol. Trop. (Int. J. Trop. Biol. ISSN-0034-7744) Vol. 60 (Suppl. 2): 187-195, April 2012. 191.
(6) A. B 7.98 7.95. 0.91 upwelling 2. 7.92. DIC/TA. pH. 0.92. pre-upwelling. 7.89. 0.90 0.89. 7.86 upwelling 1. 7.83 0.88 23..5 24.0 24.5 25.0 25.5 26.0 26.5 23..5 24.0 24.5 25.0 25.5 26.0 26.5 Temperature (ºC) Temperature (ºC). D. C 7.98. fCO2(DIC/TA) (µatm). pH. 7.95 7.92 7.89 7.86 0.89. 0.90. DIC/TA. 0.91. 640 600 560 520 480. y=-4.107*x+11.612, r=0.972, n=83. 7.83 0.88. 680. 0.92. 0.88. y=6298*x-5101.6, r=0.952, n=63. 0.89. 0.90. DIC/TA. 0.91. 0.92. Fig. 4. Temperatures versus pH (a) and the DIC/TA ratios (b) as well as the DIC/TA ratio versus the pH (c) and the temperature corrected ƒCO2 (fCO2(DIC/TA)) (c). Black, red, and blue circles indicate the data measured during the preupwelling period, the first and the second upwelling event.. 2700. 9. 8. 7. 6. 5. 3. 2600 TA (µeq kg-1). 4. 2. 2500 2400 2300 2200. low as ~2.1. During the second, slower entrainment of subsurface waters, Ωa reached a value of ~2.5 which is similar to those measured in reefs effected by upwelling in Galápagos (Fig. 6). Such low Ωa’s could reduce the growth of many coral species (Langdon & Atkinson 2005, Kleypas et al. 2006) and favor, at the same time, bioerosion within reefs by reducing the formation of carbonate cements (Manzello et al. 2008). Bioerosion could explain. 2100 1900 2000. 2100 2200 2300. 2400. DIC (µmol kg ) -1. Fig. 5. Dissolved inorganic carbon concentrations (DIC) versus the total alkalinity (TA) measured during the experiment. The arrows indicate the impacts of the mentioned processes on the DIC concentration and the TA.. 192. The dotted lines show constant levels of Ωa and the number indicates the levels. The shaded area reveals the area characterized by an Ωa < 1. For calculating the constant Ωa lines a mean temperature and salinity of 25.09 and 34.51 was considered. Black, red, and blue circles indicate as mentioned in figure 4 the data measured during the preupwelling period, the first and the second upwelling event.. Rev. Biol. Trop. (Int. J. Trop. Biol. ISSN-0034-7744) Vol. 60 (Suppl. 2): 187-195, April 2012.
(7) A. 2.0. Upwelling. B. Upwelling. Extension (cm yr-1). 5.0. 1.6 1.4 1.2 1.0 0.8 2.50. 5.5. 3.1 ?. 1.8 Extension (cm yr-1). n-upw.. n-upw.. 3.0 ?. 4.5 4.0 3.5 3.0 2.5. Pavona clavus 2.75. 3.00. 3.25. 3.50. 2.0 2.50. Omega. Pocillopora damicornis 2.75. 3.00. 3.25. 3.50. Omega. Fig. 6. Mean omega (Ωa) versus mean linear extension rates derived from Pavona clavus and Pocillopora damicornis in Galápagos (G), Panamá (P), and at our study site in Costa Rica (C). The data from Galápagos (G), Panamá (P) were obtained from Manzello et al. (2010a,b) and the error bars indicate the standard deviations. The broken line shows regression equation derived from data obtained in the upwelling region and number shows the annual Ωa at which the linear extension rates measured at our study site would meet the regression lines.. carbonate dissolution in water supersaturated with respect to calcium carbonates (Ωa <1, Fig. 5) and lowers impacts of acidic water in reefs by increasing Ωa during upwelling periods. The main reef building corals in the vicinity of our study sites Pocillopora spp. and Pavona clavus reveal growth rates exceeding those measured in Galápagos, Panamá, and Colombia (Fig. 6, Jiménez & Cortés 2003). Coral calcification is an energy demanding process in the course of which proton pumps such as the Ca2+-ATPase increase pH and the Ca2+ concentration within the calcifying cells (Al-Horani et al. 2003). Accordingly it was suggested that an enhanced energy supply could also counteract effects of a reduced Ωa on the coral calcification by increasing the activity of the Ca2+-ATPase (Cohen & Holcomb 2009). High density of nutrient and biomass and the resulting enhanced autotrophic and heterotrophic energy supply might in addition to hosting growth supporting thermally less tolerant zooxanthellae, be a process explaining the high growth rate of Pocillopora spp. and Pavona clavus at our study site (Manzello 2010a). However, in high productive regions shading caused by the high biomass density. could reduce the penetration depth of light and thus the photosynthesis. Compared to Pavona calvus, Pocillopora damicornis seem to be less efficient in compensating a reduced energy supply of its zooxanthellae by an increased heterotrophic feeding (Houlbrèque & FerrierPagès 2009). This might be a reason for the growth rates of Pocillopora damicornis which are lower in upwelling regions off Galápagos and Panamá than in the non-upwelling region off Panamá and their enhanced sensitively against ocean acidification in the ETA (Manzello 2010a). However, the high growth rates at our study site in Culebra Bay might additionally be favored by a higher Ωa during the nonupwelling season, which needs to be proved in future studies. Such future studies should also consider impacts of reduced availability of dissolved oxygen on the heterotrophic energy supply, which is assumed to be of importance for counteracting ocean acidification effects in upwelling influence reef in future. ACKNOWLEDGMENTS We would like to thank the ZMT and the CIMAR (projects 808-A7-520,. Rev. Biol. Trop. (Int. J. Trop. Biol. ISSN-0034-7744) Vol. 60 (Suppl. 2): 187-195, April 2012. 193.
(8) FUNDEVI-2059) for the financial support, Ludger Mintrop, Eleazar Ruíz (Gaspa), Celeste Sánchez-Noguera and Nicolas Duprey for discussions and support during the fieldwork as well as Eric Alfaro, Joanie Kleypas and one anonymous reviewer for constructive comments and suggestions which were very helpful for improving the manuscript. We are also grateful to Robert Schmidt and Bernd Schneider for calibrating our CO2 standards with the NOAA gas and to P. Wessels and W.H.F. Smith for providing the generic mapping tools (GMT).. photosynthesis and respiration in the scleractinian coral Galaxea fascicularis. Mar. Biol. 142: 419-426. Alfaro, E.J. & J. Cortés. 2012. Atmospheric forcing of cold subsurface water events in Bahía Culebra, Costa Rica. Rev. Biol. Trop. 60 (Suppl. 2): 173-186. Amador, J.A., E.J. Alfaro, O.G. Lizano & V.O. Magaña. 2006. Atmospheric forcing in the Eastern Tropical Pacific: A review. Prog. Oceanog. 69: 101-142. Bakun, A., D.B. Field, A. Redondo-Rodriguez & S.J. Weeks. 2010. Greenhouse gas, upwelling-favorable winds, and the future of coastal ocean upwelling ecosystems. Glob. Change Biol 16: 1213-1228. Ballestero, D. & J.E. Coen. 2004. Generation and propagation of anticyclonic rings in the Gulf of Papagayo. Int. J. Remote Sens. 25: 2217-2224.. RESUMEN El Golfo de Papagayo, costa Pacífica de Costa Rica, es una de las tres regiones de afloramiento estacional de Mesoamérica. Las características físicas y químicas del agua que aflora no habían sido estudiadas. Durante 29 horas en Abril 2009, se estudiaron la temperatura superficial del mar (TSM), la concentración de oxígeno disuelto, salinidad, pH y la presión parcial de CO2 (pCO2), en la Marina Papagayo, Bahía Culebra. Con base en las mediciones de pH y pCO2 se calculó el estado de saturación de la aragonita (Ω) y otros parámetros del sistema de carbonatos como lo es el carbono orgánico disuelto (COD) y la alcalinidad total (AT). Los resultados indican que el arrastre por convección del agua sub-superficial durante los eventos de afloramiento aumenta la pCO2 y disminuye la TSM, la concentración de oxígeno disuelto y Ω. Aunque se asume que estas condiciones reducen el crecimiento coralino, las principales especies constructoras de arrecife en la región de Papagayo (Pocillopora spp. y Pavona clavus) tienen las mayores tasas de crecimiento en el Pacífico Tropical Oriental. Esto posiblemente implica que el efecto negativo del afloramiento es compensado por el crecimiento durante la época de no afloramiento.. Clarke, A.J. 1988. Inertial wind path and sea surface temperature patterns near the Gulf of Tehuantepec and Gulf of Papagayo. J. Geophys. Res. 93: 15491 - 15501. Cohen, A.L. & M. Holcomb. 2009. Why corals care about ocean acidification: Uncovering the mechanism. Oceanography 22: 118-127. Cortés, J. & C.E. Jiménez. 2003. Corals and coral reefs of the Pacific of Costa Rica: history, research and status, pp. 361-385. In: J. Cortés (Ed.). Latin American Coral Reefs. Elsevier, Amsterdam. Diaz, R.J. & R. Rosenberg. 2008. Spreading dead zones and consequences for marine ecosystems. Science 321: 926-929. Feely, R.A., C.L. Sabine, J.M. Hernandez-Ayon, D. Ianson & B. Hales. 2008. Evidence for upwelling of corrosive “acidified” water onto the continental shelf. Science 320: 1490-1492. Fiedler, P.C. 2002. Environmental change in the eastern tropical Pacific Ocean: review of ENSO and decadal variability. Mar. Ecol. Prog. Ser. 244: 265-283. Fiedler, P.C. & L.D. Talley. 2006. Hydrography of the eastern tropical Pacific: a review. Prog. Oceanog 69: 143-180.. REFERENCES. Frankignoulle, M., J.P. Gattuso, R. Biondo, I. Bourge, G. Copin-Montégut & M. Pichon. 1996. Carbon fluxes in coral reefs. II. Eulerian study of inorganic carbon dynamics and measurement of air-sea CO2 exchanges. Mar. Ecol. Prog. Ser 145: 123-132.. Al-Horani, F.A., S.M. Al-Moghrabi & D. de Beer. 2003. The mechanism of calcification and its relation to. Houlbrèque, F. & C. Ferrier-Pagès. 2009. Heterotrophy in tropical Scleractinian corals. Biol. Rev. 84: 1-17.. 194. Rev. Biol. Trop. (Int. J. Trop. Biol. ISSN-0034-7744) Vol. 60 (Suppl. 2): 187-195, April 2012.
(9) Jiménez, C. 2001. Seawater temperature measured at the surface and at two depths (7 and 12 m) in one coral reef at Culebra Bay, Gulf of Papagayo, Costa Rica. Rev. Biol. Trop. 49 (Suppl. 2): 153-161. Jiménez, C. & J. Cortés. 2003. Growth of seven species of scleractinian corals in an upwelling environment of the eastern Pacific (Golfo de Papagayo, Costa Rica). Bull Mar Sci 72: 187-198. Jiménez, C., G. Bassey, A. Segura & J. Cortés. 2010. Characterization of the coral communities and reefs of two previously undescribed locations in the upwelling region of Golfo de Papagayo (Costa Rica). Rev. Cienc. Mar. Cost 2: 95-108.. Murphy, A. Noda, S.C.B. Raper, I.G. Watterson, A.J. Weaver & Z.-C. Zhao. 2007. Global climate projectios, pp. sm10-1-sm10-8. In: S. Solomon, D. Qin, M. Manning, Z. Chen, M. Marquis, K.B. Averyt, M. Tignor & H.L. Miller (eds) Climate Change 2007: The Physical Science Basis. Contribution of Working Group I to the Fourth Assessment Report of the Intergovernmental Panel on Climate Change. Cambridge University Press, Cambridge, United Kingdom Mitas, C.M. & A. Clement. 2005. Has the Hadley cell been strengthening in recent decades? Geophys. Res. Lett. 32: L03809.. Kessler, W.S. 2006. The circulation of the eastern tropical Pacific: A review. Prog. Oceanog. 69: 181-217.. Mitas, C.M. & A. Clement. 2006. Recent behavior of the Hadley cell and tropical thermodynamics in climate models and reanalyses. Geophys. Res. Lett. 33: L01810.. Kleypas, J.A., R.A. Feely, V.J. Fabry, C. Langdon, C.L. Sabine & L.L. Robbins. 2006. Impacts of Ocean Acidification on Coral Reef and Other Marine Calcifiers: A Guide for Future Research. NSF, NOAA and the U.S. Geological Survey. St. Petersburg, Florida.. NCDC. 2011. http://www.geodata.us/weather/show.php?usaf =787740&uban=99999&m=5&c=Costa%20 Rica&y=2011.. Langdon, C. & M.J. Atkinson. 2005. Effect of elevated pCO2 on photosynthesis and calcification of corals and interactions with seasonal change in temperature/ irradiance and nutrient enrichment,. J. Geophys. Res. 110: C09S07. Manzello, D. 2010a. Coral growth with thermal stress and ocean acidification: lessons from the eastern tropical Pacific. Coral Reefs 29: 749-758. Manzello, D. 2010b. Ocean acidification hotspots: Spatiotemporal dynamics of the seawater CO2 system of eastern Pacific coral reefs. Limnol. Oceanogr. 55: 239-248. Manzello, D.P., J.A. Kleypas, D.A. Budd, C.M. Eakin, P.W. Glynn & C. Langdon. 2008. Poorly cemented coral reefs of the eastern tropical Pacific: Possible insights into reef development in a high-CO2 world. Proc. Natl. Acad. Sci. USA 105: 10450-10455.. Nilsson, G., J.P. Hobbs, S. √ñstlund-Nilsson & P. Munday. 2007. Hypoxia tolerance and air-breathing ability correlate with habitat preference in coral-dwelling fishes. Coral Reefs 26: 241-248. NOAA & AOML 2002. http://www.aoml.noaa.gov/ocd/ gcc/uwpco2/workshops/ workshop2002/. Romero-Centeno, R., J. Zavala-Hidalgo & G.B. Raga. 2007. Midsummer gap winds and low-level circulation over the Eastern Tropical Pacific. J. Clim. 20: 3768-3784. Stramma, L., G.C. Johnson, E. Firing & S. Schmidtko. 2010. Eastern Pacific oxygen minimum zones: Supply paths and multidecadal changes. J. Geophys. Res. 115: C09011. Stramma, L., G.C. Johnson, J. Sprintall & V. Mohrholz. 2008. Expanding oxygen-minimum zones in the tropical oceans. Science 320: 655-658.. McCreary, J.P., H.S. Lee & D.B. Enfield. 1989. The response of the coastal ocean to strong offshore winds: with application to circulations in the Gulfs of Tehuantepec and Papagayo. J. Mar. Res. 47: 81-109.. WOA09. 2009. National Oceanographic Data Center: http://www.nodc.noaa.gov/ OC5/WOA09/woa09data.html.. Meehl, G.A., T.F. Stocker, W.D. Collins, P. Friedlingstein, A.T. Gaye, J.M. Gregory, A. Kitoh, R. Knutti, J.M.. Zeebe, R.E. & D. Wolf-Gladrow. 2001. CO2 in Seawater: Equilibrium, Kinetics, Isotopes. Elsevier, Amsterdam.. Rev. Biol. Trop. (Int. J. Trop. Biol. ISSN-0034-7744) Vol. 60 (Suppl. 2): 187-195, April 2012. 195.
(10)
(11)
Figure


+2

Documento similar
In this model we studied the e ffect of the variation of parameter values (temperature, crevice depth, oxygen and sodium chloride concentration outside the cavity, and pH) on all
In Figure 4b, the iron (II) present in the chalcopyrite oxidises and slowly dissolves in an environment of high concentration of sulfuric acid and high level of chloride forming
To determine the evolution of the organic matter concentration in the reactors, several analytical parameters were measured: volatile solids (VS), dissolved organic
The main aim of this study is to compare fruit yield, water consumption and pH and salinity variations in two different tomato hydroponic crops: a recycling system in which
Improve on the traditional manual filling and ventilation to reduce the risk of Oxygen depletion in order to maintain the double doors closed and reduce the disturbance on
(a) Biological oxygen concentration calculated from the dissolved oxygen saturation data measured by the Hydrolab probe, and solar radiation data obtained from the
Simple Summary: The main aim of the present study was to assess the effects of acidification (pH 6.5 vs. pH 8.0) under two salinity conditions (brackish water—BW vs. seawater—SW) on
In order to achieve this goal, we report an empirical study that attempts to systematically measure the effects of two variability sources in the estimation of the number of
