An evaluation of anaerobic co digestion implementation on New York State dairy farms using an environmental and economic life cycle framework
13
0
0
Texto completo
(2) Applied Energy 211 (2018) 28–40. J.G. Usack et al.. production and synthetic fertilizer replacement. Economically, gate-fee revenue was the most important contributor to profitability, substantially outweighing the revenue from electric power production, while also compensating for the increased handling costs of the added waste volume. Ultimately, the model clearly demonstrated the important environmental and economic implications arising from current anaerobic digestion implementation practices and policy in New York State. In addition, the model highlighted key stages in the system life-cycle, which was used to instruct and recommend immediately actionable policy changes.. 1. Introduction. Moreover, none of the existing life-cycle studies have included a robust AD process-based model capable of capturing the potentially important dynamic effects or process limits arising from organic overloading or substrate-related inhibition. Rather, these studies select a single substrate mixture and then assign a static value for methane yield, nutrient concentrations, and digestate composition. Using a simplified approach is acceptable for rough estimates of AD process performance at conservative loading rates. However, this approach is less appropriate for high co-digestion mixture ratios and loading rates, which is the way most farm-based AD systems are being operated in the U.S. Therefore, the inclusion of a more robust model at the AD process stage may prove to be important for quantifying final life-cycle outcomes. A sufficiently robust AD process model is the Anaerobic Digestion Model #1 (ADM1). ADM1 is a dynamic anaerobic digestion modeling tool developed by the International Water Association Anaerobic Digestion Modelling Task Group. This structured model combines differential and algebraic equations to simulate the physicochemical (acidbase reactions, liquid-gas transfer) and biochemical kinetic processes (biomass growth and decay, disintegration, hydrolysis, acidogenesis, acetogenesis, and methanogenesis), and the various process inhibitions associated with AD [13]. Moreover, the model allows detailed feedstock characterization and dynamic flow-rate inputs to predict methane production, biogas composition (i.e., CH4, CO2, and H2), N mineralization, and digestate composition, amongst other parameters [13]. The ADM1 model has been validated by multiple research groups for a wide range of feedstock and operating conditions [13]. Here, our objective was to systematically evaluate the technical, environmental, and economic consequences associated with co-digestion feedstock selection and management strategy in NYS for a 1000cow dairy farm. Furthermore, because the operating choices will alter the performance of the AD system, we sought to determine whether it was necessary, from the standpoint of causing significant changes in life-cycle outcomes, to more accurately estimate AD performance using a robust AD process-based model rather single-value estimates. To address the high degree of uncertainty associated with emission factor estimates in agricultural systems, we included an uncertainty analysis to further qualify the significance of our model results. We hypothesized that the three fundamental parameters: (1) feedstock selection; (2) co-digestion loading rate; and (3) changes in AD process performance would significantly affect both the environmental and economic life-cycle outcomes of the AD system. In addition, we anticipated that by combining the technical, environmental, and economic aspects of the AD system, this model would be able to identify key life-cycle stages, and thereby help guide future co-digestion implementation practices and policy.. Livestock operating systems, such as beef and milk producing farms, are inherently resource intensive and environmentally detrimental; yet, demand for beef and milk products continues to grow globally [1]. Through anaerobic digestion (AD), some of the carbon that is present in livestock manure and other agricultural residues is recaptured as methane, which may then be used in a combined heat and power (CHP) cycle. As an end-use technology, CHP is reliable and versatile and with short-term storage, can produce base-load power and heat. Besides energy production, there are additional opportunities to improve waste stabilization and nutrient emissions to further mitigate environmental impacts compared to conventional livestock operations [2]. For instance, the macronutrients (nitrogen [N], phosphorus [P], and potassium [K]) are partly mineralized and mostly conserved during the AD process, and thus the digestate may serve as a substitute for synthetic fertilizers [3]. Also, the use of digestate rather than raw manure often facilitates nutrient recovery, using technologies such as: membrane separation, ammonia stripping, and struvite precipitation [4]. Even without nutrient recovery, life-cycle assessment (LCA) studies predict considerable environmental impact reductions when AD is used in place of conventional manure management [5,6]. The majority of the environmental impact reductions in these studies came from the displacement of fossil-fuel derived electric power or heat. In the U.S., AD from livestock operating systems alone has the potential to generate an estimated 5.5% of U.S. electric power [2]. Co-digestion of dairy manure with other organic waste streams, such as food waste (40 million tons annually [7]), would considerably increase AD electric power generation potential and further reduce environmental impacts. Due to these perceived benefits, many federal and state governmental agencies are actively subsidizing AD implementation on farms via capital cost sharing grants and compensation for electric power production. Despite these financial incentives, however, high capital and operating costs still represent a major barrier toward achieving economic viability [2,8]. Consequently, farmers are increasingly relying on co-digestion of externally sourced organic wastes to provide additional revenue in the form of gate fees. In fact, a marked increase in co-digestion implementation has been observed during the last 10 years, with 98 of the 260 farm-based AD operating systems in the U.S. now applying co-digestion [5]. However, because gate fees are paid on a per volume (or weight) basis (e.g., $60–100 m−3) [9], farmers are incentivized to maximize the loading rate of these co-substrates. This often results in system overloading, which decreases digester stability and performance (i.e., specific methane yields and waste stabilization). Moreover, the digestate from an overloaded AD system may induce greater residual methane and nutrient emissions downstream of the digester, especially when open digestate storage is employed [10]. Finally, the additional volume and nutrients embedded in the digestate may incur greater downstream-handling costs; for example, from increased storage infrastructure, transport distances, and digestate export [11]. These environmental and economic considerations are important given the versatility of the AD process, which permits the use of compositionally diverse feedstock across a relatively wide range in loading rates [12]. To our knowledge, the environmental and economic life-cycle consequences resulting from feedstock selection combined with a specific AD management strategy have not been systematically evaluated.. 2. Methods 2.1. Model description Dairy manure served as the basal substrate for anaerobic digestion in all model scenarios, and when digested alone, represented the base case to which all co-digestion scenarios were compared. The co-digestion scenarios involved 10 unique co-substrates, which were separately mixed with manure at incremented loading rates spanning the technical range of the AD process. The co-substrates were selected to ensure variation in these three key characteristics: (1) organic composition; (2) 29.
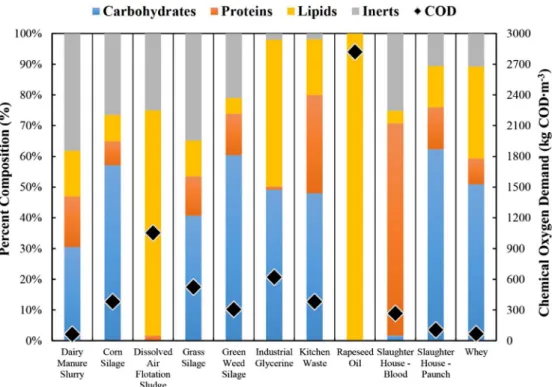
(3) Applied Energy 211 (2018) 28–40. J.G. Usack et al.. 2.2. Six unit process descriptions. substrate quality; and (3) nutrient concentration (Fig. 1, Table S1). These characteristics are defined as follows: first, the organic composition of a substrate represents the proportion of carbohydrates, proteins, lipids, and inert material that contributes to the chemical oxygen demand (COD), which is mostly a measure of organic strength. The inert material includes both totally and practically non-biodegradable constituents, and is analogous to substrate biodegradability. For example, we considered lignin practically non-biodegradable [14]. Second, substrate quality represents the physical and non-biological properties of a substrate, such as the organic strength (total COD concentration, TCOD), water content, inorganic carbon (CO2 and HCO3−), and relative proportion of soluble and particulate COD. The TCOD is equal to the sum of soluble and particulate COD. Third, nutrient concentration includes specific nutrient sources: total P, organic N, and ammoniacal N (both ionized and unionized species). The geographic scope of our model prioritized the Northeast U.S., and specifically, NYS in 2014, for defining the regional electric power mix, energy prices, livestock intensity, synthetic fertilizer value, general farm practices, emission factors, and climate. We defined the functional unit as the treatment of 1000 kg of COD by AD and the system boundary as farm-gate–to–farm-gate (Fig. 2). We created six unit processes within the system boundary of the life-cycle model: (1) pre-digestion processing; (2) anaerobic digestion; (3) biogas utilization; (4) digestate storage; (5) land application; and (6) digestate export, which we describe in six separate Sections 2.2.1–2.2.6. With these six unit processes, we explored three decision variables related to AD operating conditions: (1) mono-digestion vs. co-digestion; (2) co-substrate type; and (3) applied loading rate (i.e., mixture ratio) for co-digestion. Because dairy manure and the co-substrates are considered waste streams from preexisting commercial operating systems, we assumed that the production of these waste streams would be unaffected by their use in AD. Therefore, we excluded all upstream emissions and cash flows that are associated with the commercial operating systems producing these wastes [15]. Finally, we assumed that the end-of-life emissions and cash flows of the AD system (e.g., from recycling and disposal) were negligible [9].. 2.2.1. Pre-digestion processing The United States Department of Agriculture Integrated Farm System Model 4.1 was used to estimate the volumetric production rate and composition of dairy manure slurry (NPK and total solids concentrations) from a conventional (intensive, non-organic) 1000-cow dairy farm in NYS using the default farm parameters that were assigned to this region [16]. We assumed that the composition and production rate of manure was constant during the lifetime of the AD system. Predigestion processing involved pumping dairy manure slurry and cosubstrates into short-term holding tanks (i.e., 4–10 days with intermittent mixing). The manure and co-substrate were then blended, and if necessary, diluted with water to 10% total solids, before being pumped into the digester. 2.2.2. Anaerobic digestion The ADM1 was used to model a single-stage, continuous-flow, mesophilic (35 °C) continuously-stirred tank reactor. For the manure-only digestion simulation (base-case scenario), the hydraulic retention time (HRT) was set at 35 days, with a corresponding organic loading rate of 1.81 kg COD·m−3·Day−1. The organic loading rate represents the mass of COD that is fed per digester volume per day. For the co-digestion simulations, we incremented the total influent organic loading rate by 5% (COD-basis) by increasing the amount of co-substrate added to the dairy manure slurry. We granted five HRTs at each loading rate to ensure steady-state conditions in silico before we collected performance data. Since we assumed that the digester volume was fixed, the HRT of the digester was reduced proportionally with the amount of co-substrate added to manure (with a minimum HRT of 12 days). The composition of the final co-digestion mixture (i.e., dairy manure slurry + co-substrate) fed to the digester was calculated by weighted average w/w (see Table S1 for complete substrate composition). Also, it is important to emphasize that the total organic loading rate of the digester during co-digestion was dictated by the applied co-digestion mixture ratio (kg COD substrate · kg COD manure−1). For example, a 2:1 co-digestion mixture ratio results in a total organic loading rate of (3 × 1.81) = 5.43 kg COD·m−3·Day−1. Furthermore, the volumetric loading rate (m3·m−3·Day−1) of a substrate at a given organic Fig. 1. The organic composition of dairy manure slurry and the 10 co-substrates (primary axis) based on total COD concentration (secondary axis).. 30.
(4) Applied Energy 211 (2018) 28–40. J.G. Usack et al.. Fig. 2. Environmental and economic life-cycle model of a farm-based anaerobic digestion system showing the system boundary (solid line), unit processes (solid line), sub-unit processes (solid line), decision variables (dash-dot line), NYS electricity and synthetic fertilizer substitutions (dotted arrow lines), and major environmental and economical flows (solid arrow lines).. electric grid and credited through net-metering. Farm electric power demand was estimated from published literature values [19,20] (Table S2) and was credited the premium value of NYS electric power (i.e., $0.15 kW h−1), while electric power delivered to the grid was credited at wholesale value (i.e., $0.03 kW h−1). Lubrication oil consumption by the CHP was estimated relative to the quantity of biogas combusted [21] (Table S2). The CHP was replaced after 10 years of operation.. loading rate is directly proportional to the organic strength (kg COD·m−3), and represents the volume of substrate that is fed per digester volume per day. Also, the mass loading rate (kg·m−3·Day−1) is related to the volume loading rate by the density (kg·m−3) of the substrate, and represents the mass of substrate fed per digester volume per day. Finally, performance data included biogas yield and composition (i.e., CH4, CO2, and H2), as well as digestate quality parameters, including organic and inorganic carbon species, and organic and ammoniacal N concentrations. These performance data represented the inputs to the biogas utilization and digestate storage process stages. We defined the maximum organic loading rate of a co-digestion scenario as either the penultimate mixture ratio before process failure occurred, or the mixture ratio corresponding to an HRT of 12 days. We modeled the electric power requirements of the digester relative to the volume loading rate of the influent, and additionally modeled heat requirements using specific heat capacities assuming an initial influent temperature of 13 °C (annual average for NYS).. 2.2.4. Digestate storage We extended the ADM1 model to estimate residual methane emissions and N transformation during summer and winter storage of digestate. The storage facilities were modeled as open lagoons (earthenlined embankments) with dynamic volume, which we assumed to remain anaerobic [22]. We sized summer and winter storage to accommodate 14 days and 180 days of digestate, respectively, including the additional volume contributed by NYS precipitation. Average seasonal temperatures were included in the ADM1 model to account for the effect of temperature on physical-chemical and biochemical processes. Also, we assumed that digestate from winter storage was spread on cropland in spring, and digestate from summer storage was spread biweekly during the growing season. Energy requirements for digestate mixing and pumping during truck loading were estimated using published literature values [15] (Table S2).. 2.2.3. Biogas utilization All the captured biogas from the AD stage was used for CHP with a reciprocating gas engine. The CHP was sized based on the lower heating value of the biogas and the electrical and heat capture efficiency of the CHP. The capacity factor (i.e., run-time efficiency) of the CHP was estimated based on published literature values (Table S2), and ranged from 75% to 94% [17,18]. We assumed that the heat captured by the CHP was used to heat the digester, and any remaining heat was exhausted to the environment via radiators. Also, the produced electric power was first allocated to meet the electric power demand of the AD system (e.g., biogas conditioning, pumps, blowers, mixers), and then to offset farm electric power. Any surplus electric power was fed to the. 2.2.5. Land application The model assumed that the N and P present in digestate was used to displace the synthetic fertilizers – ammonium nitrate and triple-super phosphate, respectively – assuming a 20–100% fertilizer equivalence for N and 100% for P [23]. The livestock intensity of the farm was set to 0.74 livestock units per hectare, which was based on data that we collected from the 2014 NYS agricultural census [24]. Digestate 31.
(5) Applied Energy 211 (2018) 28–40. J.G. Usack et al.. application rates were modeled to meet the N fertilizer requirements of crop lands [25]. Embedded P applied in excess of crop demand was assumed to be emitted as phosphate at a rate of 5% of total P applied [6] (Table S2). Cropland cultivation area was not expanded in the model to match increased nutrient loads resulting from co-digestion. Methane emissions from agricultural soil were estimated using the model outlined by the International Panel on Climate Change 2006 [26]. In this model, the amount of organic material applied (kg COD) and the maximum specific methane yield (m3 CH4·kg COD−1) need to be specified. Because we used ADM1 to determine the exact organic composition of digestate after winter and summer storage, we were able to directly compute these values. Although our model precisely quantified carbon-based emissions, it did not quantify soil carbon changes. Still, N emissions from soil were estimated using emission factors from published literature (Table S2) and the total and ammoniacal N concentrations in the digestate, which was simulated by ADM1. Finally, labor and diesel fuel inputs for synthetic fertilizer and digestate fertilizer application were treated separately to account for differences in fertilizer equivalences (Table S2).. AD process performance; (2) environmental impacts; and (3) economic viability. These metrics are defined as follows: first, AD process performance considers specific methane yield (SMY) and COD removal efficiency. SMY is important for energy production, while COD removal efficiency indicates the degree of waste stabilization. Second, we characterized environmental impacts of the AD system using IMPACT 2002 + v2.12 methodology. This methodology includes both midpoint and endpoint impact categories, and provides an unweighted singlepoint score [29]. To simplify the presentation of these results, we only report the endpoint categories (i.e., climate change, ecosystem quality, human health, resources) and single scores for the six unit processes. Moreover, we applied a cut-off value of 1% at the environmental endpoint level. Third, we evaluated economic viability using an after-tax net-present value (NPV) analysis, assuming a discount rate of 15% and project lifetime of 20 years (except for the CHP). For the depreciation of capital assets, we followed the U.S. Federal Modified Accelerated Cost Recovery System. Finally, we assumed an income tax rate of 38%.. 2.2.6. Digestate export We used the N fertilization rate and the total N concentration in the digestate after storage to define the maximum land application rate. All additional digestate in excess of N demand was assumed to be exported from the farm according to the energy calculation for truck loading in Section 2.2.4 (Table S2). Labor and diesel fuel inputs for digestate export were estimated assuming a 5–40 km hauling distance using a 12ton lorry, including empty returns [27,28]. The final end-use of digestate after leaving the farm boundary was not included in the life-cycle model.. Uncertainty analysis is seldom included in life-cycle studies because it requires additional data collection, higher computational demands, and is very often limited by data availability. However, it is important to conduct uncertainty analysis because vastly different life-cycle outcomes may arise due to different model assumptions and parameter estimates [30]. This is especially true of environmental life-cycle studies involving agricultural systems where emission factor estimates vary considerably between geographic regions and across studies. To specifically account for such inter-study uncertainty, we compiled uncertainty ranges from relevant studies for each LCI input item and then created a composite uncertainty distribution using a Monte Carlo simulation (50,000 iterations). Next, we fitted a log-normal distribution for the composite uncertainty distribution in Matlab R2015a (Mathworks Inc., Natick, MA) using the makedist.m function, and then implemented the log-normal distribution in SimaPro. The uncertainty ranges that were used to develop the composite uncertainty distributions are provided in the Supplementary Information section (Table S2).. 2.5. Uncertainty analysis. 2.3. Life-cycle inventory The life-cycle inventory (LCI) was compiled using SimaPro 8.1 software (Pré North America Inc., Washington D.C.) using process data that were derived from the EcoInvent v3.1 database, where applicable (Ecoinvent, Zurich, Switzerland). The LCI included direct, local emissions (i.e., originating on the farm), indirect, non-local emissions (i.e., originating off the farm), and composite uncertainty ranges that were derived from published literature (Table S2). Direct environmental emissions that were produced on the farm included: methane (CH4), nitrous oxide (N2O), nitrogen oxides (NOx), nitrate (NO3−), ammonia (NH3), and phosphate (PO43−). Indirect emissions included those associated with the production of off-farm energy (e.g., grid-electric power, diesel), materials (e.g., synthetic fertilizer, lubrication oil), and the manufacturing of capital assets (e.g., infrastructure, equipment). The economic LCI included cost of capital assets and cash flows derived from published literature estimates (Table S2). Capital assets included: anaerobic digestion system infrastructure (e.g., holding tanks, digester vessel, plumbing, digestate storage) and equipment (e.g., CHP, pumps, heat exchangers). Equipment used for crop cultivation, such as tractors and tankers, were not included because demand for this equipment would not change appreciably between scenarios. The cash flows included: gate-fee revenue, net-metered electric power revenue, operating material costs (e.g., engine lubrication oil, synthetic fertilizer, and diesel), maintenance costs, labor costs, indirect costs, and insurance. Gate-fees were credited to the farm based on the wet weight of the co-substrate, which is the convention in NYS. All monetary flows were actualized to 2014 U.S. currency using Chemical Engineering Plant Cost Index values. Further details regarding all life-cycle inventory items are available in the Supplementary Information section (Table S2).. 3. Results 3.1. A robust model was needed to capture changes in AD performance caused by feedstock selection and co-digestion loading rates Dairy manure slurry proved to be a conducive basal feedstock for co-digestion, permitting relatively high mixture ratios (i.e., CODloading rates) for all the co-substrates evaluated. The maximum mixture ratios achieved during co-digestion ranged from 2.35 to 6.5 times the COD input of dairy manure slurry (i.e., 2.35–6.5 CODco-substrate: 1 CODmanure). The high buffering capacity of dairy manure slurry resisted acidification when carbon-rich co-substrates were applied with low alkalinity such as industrial glycerine and rapeseed oil (Table S1). Dairy manure slurry also acted as an N source for biomass growth for codigestion with N-limited co-substrates (e.g., rapeseed oil, industrial glycerine, DAF). In addition, dairy manure slurry, on its own, was found to be the least favorable substrate, resulting in the lowest SMY and COD removal efficiency for the modeled conditions (195 L CH4·kg−1 and 50.1%, respectively). The comparatively poor AD performance from dairy manure slurry can be attributed to the high inert fraction (i.e., lower biodegradability) (grey bar in Fig. 1), which arises from the high lignin content [31]. For the 10 co-digestion scenarios, AD performance most often depended on the biodegradability and organic strength of the co-substrate, while only in exceptional cases did it depend on nutrient concentration (i.e., co-substrates with extremely low/high N content). Maximum AD performance exhibited a strong, direct correlation with co-substrate biodegradability (R2 = 83% for SMY, 82% for COD. 2.4. Life-cycle scenario evaluation We evaluated the model scenarios using three primary metrics: (1) 32.
(6) Applied Energy 211 (2018) 28–40. J.G. Usack et al.. particulate COD fractions in whey are also higher than for the other cosubstrates. Although slaughter house-blood has the highest soluble COD ratio at 95%, this co-substrate performed poorly, because it has a large proportion of soluble inert matter (24% of soluble COD) (Fig. S1, Table S1), and because inhibitory levels of ammonia developed at higher loading rates (explained below). Finally, the high carbon content of rapeseed oil induced an N limitation at a very high co-digestion mixture ratio, which constrained biomass growth and caused an accumulation of fermentation intermediates. The ADM1 model simulations also captured the effects of process inhibition. For example, ADM1 predicted AD process failure due to ammonia inhibition during slaughter house-blood co-digestion (AD process failure occurred at a 4.25 mixture ratio in Fig. 4). Slaughter house-blood was the only co-substrate with higher N content than dairy manure slurry (orange and purple bars in Fig. S2). Dairy manure slurry itself contains high N levels, which already was sufficient to cause partial inhibition of the AD process during manure-only digestion (represented as the 0:0 mixture ratio in Fig. 4D). However, acetate accumulation did not occur during manure-only digestion due to the conservative organic loading rate (1.81 kg COD·m−3·Day−1), low biodegradability, and long hydraulic retention time (i.e., 35 days) (Fig. 4A). Yet, during co-digestion of slaughter house-blood (i.e., mixture ratios > 0), ammonia inhibition increased to levels where acetate and other short-chain carboxylic acids (Fig. 4E) began to accumulate, which caused proportional reductions in SMY and COD removal efficiency (Fig. 4B). As a result, maximum AD performance occurred at a relatively low co-digestion mixture ratio with slaughter-house blood (i.e., ∼0.3:1, COD-Basis). Still, the AD process was able to tolerate considerably higher mixture ratios, operating at “inhibited steady-state conditions” before total process failure occurred [32]. Process failure occurred when the pH dropped to inhibitory levels (Fig. 4C). Leading up to process failure, COD removal efficiency continued to decrease (∼40% compared to the optimal COD removal efficiency of ∼60%). Unique AD process constraints also limited the maximum loading rate of the other co-digestion scenarios (Table S3).. removal efficiency). The most biodegradable co-substrates were rapeseed oil, kitchen waste, and industrial glycerine, with a correspondingly high SMY (blue bars in Fig. 3) and COD removal efficiency (data not shown). The least biodegradable co-substrates were the silages (i.e., corn, grass, and green weed), DAF, and slaughter house-blood. Despite having an inferior AD performance, however, these co-substrates with low biodegradability permitted relatively high mixture ratios by avoiding organic overloading. Moreover, due to their lower organic strength (inset black diamonds in Fig. 1), these co-substrates achieved high mass loading rates (yellow-diamonds inset within orange bars in Fig. 3). High mixture ratios were also achieved with more biodegradable cosubstrates, such as rapeseed oil, kitchen waste, and industrial glycerine. However, these carbon-rich co-substrates were more susceptible to process constraints, such as N limitations and organic overloading, which occurred with rapeseed oil and industrial glycerine co-digestion, respectively. Furthermore, because both rapeseed oil and industrial glycerine had relatively high organic strength (Fig. 2, Table S1), their mass loading rates were limited (Fig. 3). On the other hand, low organic strength co-substrates, such as whey and slaughter house-paunch, achieved very high mass loading rates. The loading rate of these lowstrength co-substrates was ultimately constrained by the 12-Day HRT lower limit used in this model. Operation of the AD system at maximum AD loading necessarily leads to reductions in SMY compared to that of the maximum AD performance for all co-substrates (Fig. 3). With the exceptions of rapeseed oil, slaughter house-blood, and whey, these AD performance reductions were roughly proportional to the increases in mass loading rate. This was caused by increased hydraulic short-circuiting at a shortened HRT. AD performance was also influenced by the hydrolysis rate and soluble COD fraction (inset black diamonds in Fig. S1) of the co-substrate, albeit to a lesser extent. Whey, for example, is comprised mostly of soluble sugars (i.e., lactose) and carboxylic acids with a soluble COD fraction of 93% (Fig. S1, Table S1). With a very low particulate COD fraction, whey was less limited by hydrolysis at higher volumetric loading rates compared to those co-substrates with high particulate COD fractions. In addition, the hydrolysis rates for the. Fig. 3. The specific methane yield (primary axis) and mass loading rate (secondary axes) at the manure:co-substrate mixture ratio corresponding to maximum AD performance (blue bars) and maximum AD loading (orange bars). The values above the bars represent the percent change in SMY between the two conditions. (For interpretation of the references to color in this figure legend, the reader is referred to the web version of this article.). 33.
(7) Applied Energy 211 (2018) 28–40. J.G. Usack et al.. Fig. 4. ADM1 simulation of slaughter houseblood co-digestion with dairy manure slurry. Pane (A) shows the applied loading rate (primary axis) and sludge retention time (secondary axis). Pane (B) shows the SMY (primary axis) and COD removal efficiency (secondary axis). Pane (C) shows pH (primary axis) and the non-competitive pH inhibition to acetoclastic methanogenesis (secondary axis). The inhibition parameter is presented as unity minus the inhibition factor (I) (i.e., 1-I) shown as a percent. Pane (D) shows unionized ammonia concentration (NH3) (primary axis) and the non-competitive NH3 inhibition to acetoclastic methanogenesis (secondary axis). Pane (E) shows the total short-chain carboxylic acid (C2–C5) (primary axis) and acetic acid concentrations (C2) (secondary axis). Note: manure-only digestion is equivalent to a 0.0 mixture ratio.. digested with dairy manure slurry at high mixture ratios and mass loading rates (i.e., maximum mixture ratio = 5.95; maximum mass loading rate = 28.3 kg·m−3·Day−1) in relation to that of maximum COD removal efficiency (i.e., mixture ratio = 1.65; mass loading rate = 8.3 kg·m−3·Day−1) (purple line in Fig. 5A). Furthermore, we found that the point of lowest GWP occurred at a much lower mixture ratio (∼0.90) (Fig. 5A) compared to the mixture ratio leading to the highest NPV (∼5.95) (black inset bars in Fig. 5B). The lowest GWP was reached at a lower mixture ratio compared to that of the maximum AD performance because kitchen waste contains. 3.2. High co-digestion loading rates are more profitable but have environmental consequences We evaluated the effect of increasing co-digestion loading rates on AD performance, direct environmental emissions on the farm, and economic profitability using kitchen waste as an example co-substrate. Here, we summarize the results of this evaluation using these proxy metrics: (1) COD removal efficiency (AD performance); (2) global warming potential (GWP) (direct environmental emissions); and (3) NPV (economic profitability). We found that kitchen waste could be co-. 34.
(8) Applied Energy 211 (2018) 28–40. J.G. Usack et al.. Fig. 5. Direct, farm-level environmental emissions (A) and economic profitability (B), indicated by global warming potential (GWP, 500-yr horizon) and net present value (NPV), respectively, for the kitchen waste co-digestion scenario. AD performance indicated as chemical oxygen demand (COD) removal (Pane A, purple line, secondary axis). Note: manure-only digestion is equivalent to a 0.0 mixture ratio. Error bars represent 95% confidence interval of the modeled uncertainty distribution.. anaerobic digestion (green bar sections in Fig. 5A), and biogas utilization (blue bar sections in Fig. 5A) stages produced less GHG emissions compared to digestate storage and land application. Relative GHG emissions decreased at the pre-digestion processing stage (storage of manure and storage of co-substrate) with increasing co-digestion mixture ratios of kitchen waste. This was because the GHG emissions from the storage of kitchen waste were comparatively lower than for storage of manure. In contrast, at the digestate export stage, GHG emissions increased at higher mixture ratios because proportionally more digestate was exported off the farm (grey bar sections in Fig. 5A). From an economic viability perspective, co-digestion was markedly more feasible than manure-only digestion. This was indicated by an increasing total NPV with increasing loading rates of kitchen waste (Fig. 5B). The most important revenue stream was gate-fee revenue (red bar sections in Fig. 5B), followed distantly by electric power production (purple bar sections in Fig. 5B). Actually, electric power revenue per 1000 kg COD decreased with increasing mixture ratios, since a larger excess of CHP-generated electric power was granted the whole-sale rate ($0.03·kWh−1) rather than the premium rate ($0.15·kWh−1). Without. less N per COD than dairy manure slurry (Fig. S2), which reduced GWP in the processes dominated by N emissions (e.g., N2O, NH3) such as predigestion processing and land application. However, as the co-digestion mixture ratio increased, residual methane emissions from digestate storage also increased, and eventually outweighed the benefits of a lowered specific N load. Digestate storage emissions were the greatest contributor to GWP in all cases except for the lowest mixture ratio, where N emissions during land application emissions contributed the most to GWP (orange1 bar higher than yellow bar in Fig. 5A). This trend of increasing methane emissions during digestate storage has also been discussed in other studies [33,34]. Here, at the highest mixture ratio with kitchen waste (overloaded conditions), residual methane production in digestate storage accounted for 25% of the total methane potential of the co-digestion mixture (black line in Fig. S3), which corresponds closely with measured values in overloaded AD systems [35,36]. Pre-digestion processing (cyan bar sections in Fig. 5A),. 1 For interpretation of color in Figs. 5 and 7, the reader is referred to the web version of this article.. 35.
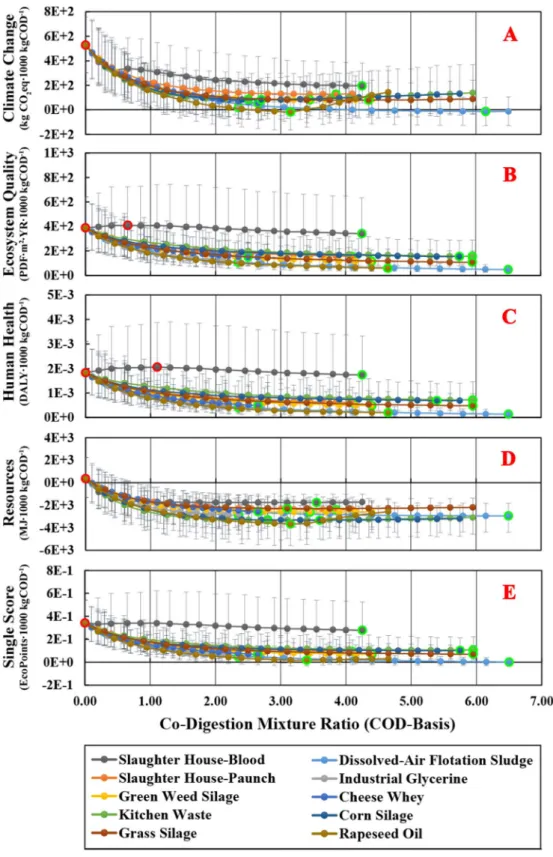
(9) Applied Energy 211 (2018) 28–40. J.G. Usack et al.. CHP was sized to match biogas production, and therefore the relative cost of biogas utilization decreased only slightly with scale (blue bar sections in Fig. 5B). Avoided land application cost (orange bar sections in Fig. 5B) was the second most important contributor to profitability. However, as the loading rates increased, the added nutrients brought in by kitchen waste increasingly exceeded crop demands, and thereby required more digestate export. However, the cost for digestate export remained relatively small compared to all the other costs even at higher loading rates (grey bar sections in Fig. 5B). These results indicate a clear trade-off between the environmental. gate-fees, CHP-generated electric power alone was incapable of recovering the capital and operating costs of the AD system. Bishop & Shumway (2009) arrived at similar results, and further demonstrated a shortfall even with the inclusion of additional co-product revenue streams (i.e., digestate solids bedding, fertilizer, and carbon credits) [37]. Co-digestion also conferred economic benefits in the form of avoided costs. The most important avoided cost was the cost in capital needed for the AD system, due to better use of digester volume and other process equipment during co-digestion (i.e., per COD). Here, the. Fig. 6. Total life-cycle environmental impacts (direct + indirect emissions) of co-digestion with each of the 10 co-substrates, modeled with Impact 2002 + for damage categories: climate change (A), ecosystem quality (B), human health (C), and resources (D); and as a combined single-score (E), based on applied co-digestion mixture ratio. The mixture ratio point corresponding with the highest environmental impact is outlined in red, while the point with the lowest environmental impact is outlined in green. The maximum codigestion mixture ratios ranged from 2.65 to 6.5, and were constrained by AD process limits unique to each co-digestion scenario (Table S3). Note: manure-only digestion is equivalent to a 0.0 mixture ratio. PDF: Potentially disappeared fraction of species. DALY: Daily Adjusted Life Years. Error bars represent 95% confidence interval of the modeled uncertainty distribution. (For interpretation of the references to color in this figure legend, the reader is referred to the web version of this article.). 36.
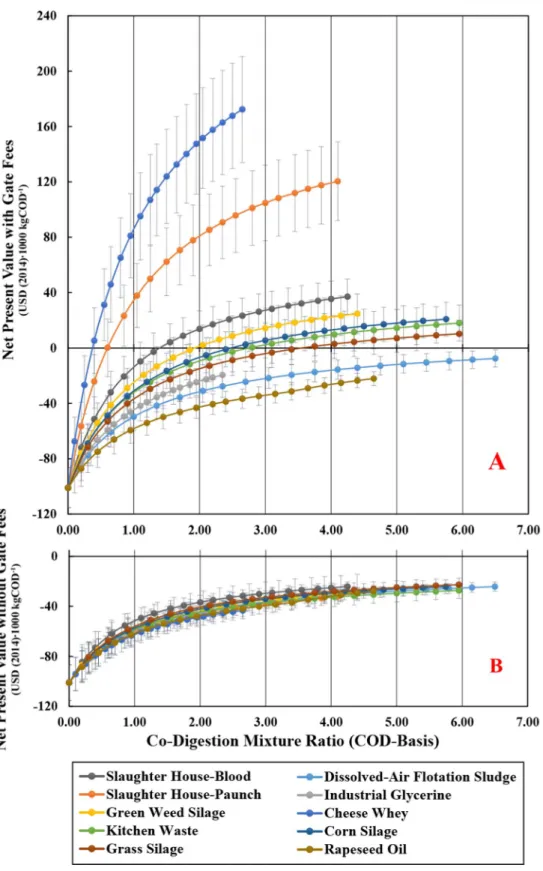
(10) Applied Energy 211 (2018) 28–40. J.G. Usack et al.. environmental emission reductions.. impacts and economic profitability of the AD system. With increasing co-digestion mixture ratios, improved profitability came at the expense of increased environmental impacts at the farm-level. Furthermore, due to the low value of electric power, economic profitability was effectively insensitive to AD performance. Low electric power prices also meant that relatively high loading rates were necessary to accrue sufficient gate-fee revenues to attain economic viability. Here, to achieve a positive NPV, kitchen waste needed to be loaded at twice the rate used for optimum AD performance and triple the rate used for maximal. 3.3. Indirect life-cycle environmental benefits compensate for increased emissions on the farm from an overloaded AD process Co-digestion of organic wastes led to proportionally greater environmental emissions on the farm when the AD process was overloaded. Despite this, total life-cycle emissions, which also include all the indirect emissions occurring outside the farm, were reduced Fig. 7. Overall life-cycle economic viability for each of the 10 co-digestion scenarios, both with (A) and without (B) gate-fee revenue, based on applied co-digestion mixture ratio. Economic viability is indicated by net present value (NPV). Note: manure-only digestion is equivalent to a 0.0 mixture ratio. Error bars represent 95% confidence interval of the modeled uncertainty distribution.. 37.
(11) Applied Energy 211 (2018) 28–40. J.G. Usack et al.. environmental and economic performance (i.e., environomic score) relative to manure-only digestion, a similar outcome was observed (Fig. S4). With gate fees, co-digestion improved system performance in all scenarios with an increasing mixture ratio (Fig. S4A), while without gate fees, each scenario performed almost the same (Fig. S4B). Slaughter house-blood co-digestion was the notable exception (dark grey line in Fig. S4). This co-substrate resulted in the lowest environomic score due to its considerably higher environmental impacts compared to the other co-substrates.. through co-digestion compared to manure-only digestion. This was mainly due to the over-riding environmental benefits gained from replacing NYS grid electric power and synthetic fertilizer with biogas and nutrients derived from the co-substrates. Of all the damage categories assessed, climate change impacts were reduced by the greatest margin through co-digestion (Fig. 6A). Resource impacts, which are driven by primary energy consumption [29], were similarly reduced (Fig. 6D). Moreover, these impact reductions occurred regardless of co-substrate properties or the applied loading rate. This demonstrates that co-digestion, even for the least favorable operating conditions, was still preferable to manure-only digestion without digestion of co-substrate (points outlined in red in Fig. 6A and D). In fact, for slaughter house-blood (dark grey line), industrial glycerine (light grey line), and DAF (cyan line), the points of minimal climate change and resource impacts approximately coincided with the maximum mixture ratios (also the maximum loading rates) for these cosubstrates (points outlined in green in Fig. 6A and D). More often, however, these minima occurred at some intermediate mixture ratio, which suggests these damage categories were still somewhat sensitive to AD performance. Climate change impacts were relatively more sensitive to AD performance compared to resource impacts, since climate change impacts are affected by both electric power production (related to SMY) and residual methane emissions (related to COD removal efficiency), whereas resource impacts are only influenced by electric power production. Ecosystem quality (Fig. 6B) and human health (Fig. 6C) impacts, on the other hand, are more sensitive to nutrient emissions than carbon emissions [29]. Consistent with other LCA studies, most of the nutrient emissions in our model occurred downstream of the AD process during digestate storage and land application [6,38]. Except for slaughter house-blood, dairy manure slurry had the highest N & P content (per COD) of all the substrates evaluated (Fig. S2). As a result, most codigestion scenarios reduced ecosystem quality and human health impacts compared to manure-only digestion. Furthermore, since these impact categories are less sensitive to residual methane emissions, the point of minimal impacts very often coincided with the maximum mixture ratio (points outlined in green in Fig. 6B and C). The singlescore value represents an average of the four impact categories following normalization, and thus predicted environmental optima at intermediate mixture ratios (Fig. 6E).. 4. Discussion 4.1. The implications of current farm-based co-digestion management practices In NYS, farm-based AD is promoted by federal and state agencies as a sustainable alternative to conventional manure management. Co-digestion is similarly endorsed as a more desirable disposal route for organic wastes compared to landfilling [39]. This is due to the perceived environmental services that are rendered by AD: energy production and waste stabilization. However, assuming the current economic and policy framework, to achieve the greatest economic profit from co-digestion, operators should maximize the loading rate of lowstrength, low-biodegradability co-substrates containing just enough nutrients to support biomass growth. Such co-substrates permit high volume loading rates with less chance of organic overload, and therefore accrue the most gate-fee revenue. Conversely, the co-substrates with high organic strength and biodegradability, which are ideally suited for energy production, perform the worst economically. Therefore, it is evident that energy production is not a highly valued service of farm-based co-digestion. In fact, we estimate it is more economical to flare excess biogas rather than investing in a larger CHP system, since whole-sale electric power prices (i.e., $0.03 kW h−1) cannot offset the marginal cost of increased electric power production capacity. Also, gate fees paid to AD operators should reflect the full cost of properly treating these organic wastes. In a way, gate fees are analogous to the charges levied by a landfill or municipal treatment facility for waste disposal. Yet, our analysis demonstrates that the economically optimum co-digestion loading rate greatly exceeds the loading rate leading to optimal COD removal efficiency. The resulting partially treated effluent is then delivered to open-lagoon storage, where it further degrades, releasing considerable environmental emissions. In this sense, farm-based co-digestion systems are undercutting the full cost of waste treatment and providing a less expensive disposal route compared to landfilling or conventional municipal treatment.. 3.4. Gate fees drive economic return but favor low-quality co-substrates The relative differences in economic return between the 10 co-digestion scenarios were markedly greater than the relative differences in environmental impacts. When gate fees are included, a large range of NPVs was observed depending on co-substrate selection and the applied mixture ratio (Fig. 7A), while without gate fees, the range of NPVs was much smaller (Fig. 7B). This demonstrates the over-riding influence of gate-fee revenue compared to all other revenues and costs associated with co-digestion. Yet, even without gate fees, NPV follows a positive trend with an increasing co-digestion mixture ratio (Fig. 7B). This indicates that the less important revenue streams generated via co-digestion (e.g., greater electric power production and fertilizer replacement), could compensate for the added costs (e.g., greater handling volume and excess nutrient export). However, none of the co-digestion scenarios achieved a positive NPV without gate fees. Also, dilute and low-energy co-substrates, such as whey (blue line), slaughter house-paunch (orange line), and slaughter house-blood (dark grey line), accrued considerably more gate-fee revenue compared to energy-rich co-substrates such as rapeseed oil (light brown line), DAF (cyan line), and industrial glycerine (light grey line) (Fig. 7A). In fact, these three energy-rich co-substrates never achieved a positive NPV even with gate fees. However, these energy-rich co-substrates performed the best environmentally (Fig. 6) and technically in terms of AD performance (Fig. 3). Finally, when considering the combined. 4.2. What should regulators and policy makers do with our information? 4.2.1. Financial compensation should be linked to AD performance Feed-in-tariffs, where premium electric power rates are guaranteed for a contracted period, would provide greater incentive toward energy production compared to net-metering. However, feed-in-tariffs do not necessarily guarantee efficient AD process management, since there is still the incentive to maximize gross methane production from the digester rather than specific methane yields from the substrate. A bonus system indexed to specific performance metrics, such as COD removal efficiency, could be used to additionally reward AD operators for efficient energy production. For example, a farm AD system with a 50% COD removal efficiency would earn an additional $0.02 kW h−1, while one with 60% COD removal efficiency would earn an additional $0.04 kW h−1. However, as our analysis makes clear, co-digestion substrate quality greatly affects AD performance, and thus co-digestion substrate quality should be included in the bonus allocation scheme, say, by assigning an expected treatability level for a given co-substrate. The ADM1 model, for example, could be used in place of experimental treatability studies, which are not practical for many farm-based AD 38.
(12) Applied Energy 211 (2018) 28–40. J.G. Usack et al.. operations. Tariff bonuses could be similarly granted for implementation of other environmentally advantageous management strategies or technologies such as digestate covered storage [22], solid-liquid separation [11], or waste heat utilization [40].. NH4+). Lastly, the nutrient load fed to dairy cattle may be reduced using precision feeding strategies. This would reduce the nutrient concentration in dairy manure, which in turn would lead to substantial environmental impact reductions at most stages of the system life-cycle.. 4.2.2. Gate fees and capital-cost sharing should be allocated using technically relevant metrics Our analysis demonstrated the environmental consequences of crediting co-digestion gate fees based on co-digestion substrate volume (or weight), which has little technical relevance to the AD process. A more reasonable approach would be to credit gate fees based on the composition and organic load of the co-substrate being treated. This is the standard approach used by existing wastewater treatment facilities to ensure proper waste stabilization, and therefore could be directly applied for farm-based AD systems. Linking gate fees to a technically relevant metric would help co-align the environmental and economic objectives of AD implementation rather than putting them in opposition. Also, providing capital-cost sharing with governmental subsidies for AD energy projects without quality assurance/control (QA/QC) should be reconsidered, because they do not commit the operator (or original AD system designer) to the long-term performance of the AD system. Some granting institutions require QA/QC compliance from AD systems before awarding net-metering benefits, however, these QA/QC plans typically target CHP run-time efficiency and/or emissions quality, and neglect AD process performance. Thus, they cannot redress the issue of organic overloading or environmental emissions occurring downstream of the CHP. The funds currently used for capital cost sharing would be better spent toward longer-term feed-in-tariff contracts or technologyspecific investments that promote higher efficiency or greater environmental impact reductions.. 5. Conclusions The increased implementation of anaerobic digestion for organic waste-to-energy conversion and waste treatment by the agriculture sector is expected to continue in the future, especially in the U.S., due to greater government support, increasing fossil energy prices, stricter environmental regulations, and greater public advocacy. Currently, new AD installations are often not evaluated very well, partly due to the absence of detailed tools. The extensive environmental life-cycle and economic assessment model that was developed in this study included a robust AD process model to predict the considerable environmental and economic consequences that may arise from changes in AD operating strategy and performance. Many of the life-cycle outcomes predicted by this model would not have been accurately captured if a more simplified AD modeling approach were used. Also, although the model estimates included considerable uncertainty, the general trends and lifecycle hot-spots could be easily identified as significant. Therefore, the model could serve as a tool to inform future policy decisions and direct efforts to improve the environmental benefits and economic profitability of planned anaerobic digestion projects. It could also be used by AD operators at existing AD facilities to gauge current performance and evaluate the consequences resulting from, for example, changes in feedstock and AD operating strategy, market conditions, and policy. Given the difficulty and impracticality of conducting field measurements and properly controlled experiments for agricultural processes, this or a similarly extensive model may be the best approach to evaluate farm-based AD systems.. 4.2.3. Low-cost and effective management practices should be implemented immediately to mitigate environmental emissions While the current economic model persists, immediate measures should be pursued to help offset environmental burdens imposed by poor co-digestion management. For example, our results indicate a clear opportunity to reduce environmental damage through the implementation of digestate storage covers to capture residual methane emissions. This residual methane could be flared or redirected to the CHP for additional energy production [6]. Unfortunately, very few AD systems in NYS use storage covers. The reason is undoubtedly economic as there is no immediate financial incentive for the AD operator to justify this expense. Yet, an economic analysis by Wightman and Woodbury [22] suggest that the cost of installing a floating storage cover is relatively low considering the environmental benefits (i.e., $0.010–0.013 per 1000 kg CO2-eq mitigated), which make digestate storage covers a cost-effective use of governmental subsidies. Another relatively inexpensive alternative to storage covers, albeit less effective, would be to perform solid separation of digestate prior to storage, because this would reduce the amount of residual carbon reaching storage [11]. The separated solids could then be used for cow bedding, or as Penriched fertilizer, since proportionately more P is retained with the solids than N [11]. This partial decoupling of N and P by solid-liquid separation would also allow farm operators to more precisely match fertilization requirements of crops, and thereby reduce land application emissions arising from over-fertilization. Finally, opportunities exist to improve the life-cycle environomic performance of the AD system merely by addressing dairy manure slurry quality. AD operators should minimize the amount of process water added to manure during collection to increase the organic strength and minimize handling volume. Effluent recycling could also be used in place of process water for dilution of both dairy manure and co-substrates. However, it should be noted, that the use of effluent recycling would induce higher solute concentrations, which may be problematic for co-substrates containing potential inhibitors (e.g.,. Acknowledgement We would like to acknowledge the New York State Energy Research and Development Authority for providing financial support through the Environmental Monitoring, Evaluation, and Protection Program: Climate Change Adaptation Research (#28264). We would also like to thank Cornell University’s Clinton-DeWitt and Ram Sagi Dairy Engineering Scholarship programs, the Academic Venture Fund of the Atkinson Center for Sustainable Future, Cornell Energy Institute, and the Chilean Fund for Science and Technology (FONDECYT #1161697) for partial financial support in completing this study. Appendix A. Supplementary material Supplementary data associated with this article can be found, in the online version, at http://dx.doi.org/10.1016/j.apenergy.2017.11.032. References [1] Daniel CR, Cross AJ, Koebnick C, Sinha R. Trends in meat consumption in the USA. Pub Health Nutr 2011;14:575–83. [2] Zaks DPM, Winchester N, Kucharik CJ, Barford CC, Paltsev S, Reilly JM. Contribution of anaerobic digesters to emissions mitigation and electricity generation under U.S. climate policy. Environ Sci Technol 2011;45:6735–42. [3] Huang W, Huang W, Yuan T, Zhao Z, Cai W, Zhang Z, et al. Volatile fatty acids (VFAs) production from swine manure through short-term dry anaerobic digestion and its separation from nitrogen and phosphorus resources in the digestate. Water Res 2016;90:344–53. [4] Vaneeckhaute C, Lebuf V, Michels E, Belia E, Vanrolleghem PA, Tack FMG, et al. Nutrient recovery from digestate: systematic technology review and product classification. Waste Biomass Valorization 2017;8:21–40. [5] Ebner JH, Labatut RA, Rankin MJ, Pronto JL, Gooch CA, Williamson AA, et al. Lifecycle greenhouse gas analysis of an anaerobic codigestion facility processing dairy manure and industrial food waste. Environ Sci Technol 2015;49:11199–208. [6] Croxatto Vega GC, ten Hoeve M, Birkved M, Sommer SG, Bruun S. Choosing cosubstrates to supplement biogas production from animal slurry – a life cycle assessment of the environmental consequences. Biores Technol 2014;171:410–20.. 39.
(13) Applied Energy 211 (2018) 28–40. J.G. Usack et al.. Department of Agriculture: National Agricultural Statistics Services; 2014. [25] Zhang Y, White MA, Colosi LM. Environmental and economic assessment of integrated systems for dairy manure treatment coupled with algae bioenergy production. Biores Technol 2013;130:486–94. [26] IPCC. emissions from livestock and manure management. Guidelines for National Greenhouse Gas Inventories. Geneva, Switzerland: International Panel on Climate Change; 2006 [chapter 10]. [27] Balussou D, Kleyböcker A, McKenna R, Möst D, Fichtner W. An economic analysis of three operational co-digestion biogas plants in Germany. Waste Biomass Valorization 2012;3:23–41. [28] Poeschl M, Ward S, Owende P. Environmental impacts of biogas deployment – part I: life cycle inventory for evaluation of production process emissions to air. J Cleaner Prod 2012;24:168–83. [29] Jolliet O, Margni M, Charles R, Humbert S, Payet J, Rebitzer G, Rosenbaum R. IMPACT 2002+: a new life cycle impact assessment methodology. The International Journal of Life Cycle Assessment. 2003;8:324–30. [30] Sills DL, Paramita V, Franke MJ, Johnson MC, Akabas TM, Greene CH, et al. Quantitative uncertainty analysis of life cycle assessment for algal biofuel production. Environ Sci Technol 2013;47:687–94. [31] Labatut RA, Angenent LT, Scott NR. Conventional mesophilic vs. thermophilic anaerobic digestion: a trade-off between performance and stability? Water Res 2014;53:249–58. [32] Usack JG, Angenent LT. Comparing the inhibitory thresholds of dairy manure codigesters after prolonged acclimation periods: part 1 – performance and operating limits. Water Res 2015;87:446–57. [33] Börjesson P, Berglund M. Environmental systems analysis of biogas systems—part I: fuel-cycle emissions. Biomass Bioenergy. 2006;30:469–85. [34] Clemens J, Trimborn M, Weiland P, Amon B. Mitigation of greenhouse gas emissions by anaerobic digestion of cattle slurry. Agr Ecosyst Environ 2006;112:171–7. [35] Angelidaki I, Heinfelt A, Ellegaard L. Enhanced biogas recovery by applying postdigestion in large-scale centralized biogas plants. Water Sci Technol 2006;54:237–44. [36] Kaparaju P, Rintala J. Effects of temperature on post-methanation of digested dairy cow manure in a farm-scale biogas production system. Environ Technol 2003;24:1315–21. [37] Bishop CP, Shumway CR. The economics of dairy anaerobic digestion with coproduct marketing. Rev Agric Econ 2009;31:394–410. [38] Aguirre-Villegas HA, Larson R, Reinemann DJ. Effects of management and co-digestion on life cycle emissions and energy from anaerobic digestion. Greenhouse Gases: Sci Technol 2015;5:603–21. [39] Zamanzadeh M, Hagen LH, Svensson K, Linjordet R, Horn SJ. Anaerobic digestion of food waste – effect of recirculation and temperature on performance and microbiology. Water Res 2016;96:246–54. [40] Poeschl M, Ward S, Owende P. Environmental impacts of biogas deployment – part II: life cycle assessment of multiple production and utilization pathways. J Clean Prod 2012;24:184–201.. [7] EPA. Municipal solid waste generation, recycling, and disposal in the United States: facts and figures for 2012. Washington DC; 2014. p. 14. [8] Chen T, Shen D, Jin Y, Li H, Yu Z, Feng H, et al. Comprehensive evaluation of environ-economic benefits of anaerobic digestion technology in an integrated food waste-based methane plant using a fuzzy mathematical model. Appl Energy 2017. http://dx.doi.org/10.1016/j.apenergy.2017.09.082. [9] Sanscartier D, MacLean HL, Saville B. Electricity production from anaerobic digestion of household organic waste in Ontario: techno-economic and GHG emission analyses. Environ Sci Technol 2011;46:1233–42. [10] De Vries JW, Vinken TMWJ, Hamelin L, De Boer IJM. Comparing environmental consequences of anaerobic mono- and co-digestion of pig manure to produce bioenergy – a life cycle perspective. Biores Technol 2012;125:239–48. [11] ten Hoeve M, Hutchings NJ, Peters GM, Svanström M, Jensen LS, Bruun S. Life cycle assessment of pig slurry treatment technologies for nutrient redistribution in Denmark. J Environ Manage 2014;132:60–70. [12] Bacenetti J, Sala C, Fusi A, Fiala M. Agricultural anaerobic digestion plants: what LCA studies pointed out and what can be done to make them more environmentally sustainable. Appl Energy 2016;179:669–86. [13] Batstone DJ, Keller J, Angelidaki I, Kalyuzhnyi SV, Pavlostathis SG, Rozzi A, et al. The IWA anaerobic digestion model no 1 (ADM1). Water Sci Technol 2002;45:65–73. [14] Jabłoński SJ, Biernacki P, Steinigeweg S, Łukaszewicz M. Continuous mesophilic anaerobic digestion of manure and rape oilcake – experimental and modelling study. Waste Manage 2015;35:105–10. [15] Hamelin L, Naroznova I, Wenzel H. Environmental consequences of different carbon alternatives for increased manure-based biogas. Appl Energy 2014;114:774–82. [16] Rotz CA. The integrated farm system model software for evaluating the performance, environmental impact and economics of farming systems. Washington, D.C: United States Department of Agriculture; 2012. [17] Jenkins BM. A comment on the optimal sizing of a biomass utilization facility under constant and variable cost scaling. Biomass Bioenergy. 1997;13:1–9. [18] Meyer-Aurich A, Schattauer A, Hellebrand HJ, Klauss H, Plöchl M, Berg W. Impact of uncertainties on greenhouse gas mitigation potential of biogas production from agricultural resources. Renew Energy 2012;37:277–84. [19] Thomassen M, Dalgaard R, Heijungs R, Boer I. Attributional and consequential LCA of milk production. Int J Life Cycle Assess 2008;13:339–49. [20] Upton J, Humphreys J, Koerkamp PWGG, French P, Dillon P, De Boer IJM. Energy demand on dairy farms in Ireland. J Dairy Sci 2013;96:6489–98. [21] Boulamanti AK, Donida-Maglio S, Giuntoli J, Agostini A. Influence of different practices on biogas sustainability. Biomass Bioenergy 2013;53:149–61. [22] Wightman JL, Woodbury PB. New York dairy manure management greenhouse gas emissions and mitigation costs (1992–2022). J Environ Qual 2016;45. [23] Hansen TL, Christensen TH, Schmidt S. Environmental modelling of use of treated organic waste on agricultural land: a comparison of existing models for life cycle assessment of waste systems. Waste Manage Res 2006;24:141–52. [24] NASS. Census of agriculture: New York State and County Data. United States. 40.
(14)
Figure

Documento similar