The Dense Molecular Gas and Nuclear Activity in the ULIRG /source
17
0
0
Texto completo
(2) The Astrophysical Journal, 835:213 (17pp), 2017 February 1. Privon et al.. characterizing the dense molecular gas in star-forming systems (i.e., determining the dense gas fraction and the physical conditions of the dense gas). Studies of AGN hosts have found evidence for enhanced HCN emission (relative to HCO+) in both galaxy-integrated and resolved observations (e.g., Kohno et al. 2001; Imanishi et al. 2006, 2007; Davies et al. 2012), which has been interpreted as evidence for the influence of X-ray dominated regions (XDRs) or mechanical heating (Izumi et al. 2016). More recent studies of galaxy-integrated emission have uncovered enhanced HCN emission in pure starburst and composite systems (Costagliola et al. 2011; Privon et al. 2015), but existing data were not sufficient to suggest a single preferred physical process for the enhancement. Other studies have found evidence for nonlinear relationships of HCN (1–0) with LFIR[40–400 μm] (García-Burillo et al. 2012), in contrast to the Gao & Solomon (2004a) picture. Recent interferometric observations of the (3–2) and (4–3) lines in systems with enhanced HCN emission have uncovered convincing evidence of infrared pumping, via the detection of v2=1f lines of HCN (e.g., Sakamoto et al. 2010; Costagliola et al. 2013; Imanishi & Nakanishi 2013; Aalto et al. 2015a, 2015b). The v2=1fHCN (4–3) line has a level energy of 1050 K, and is thus unlikely to be collisionally excited. Instead, it has been proposed that mid-infrared pumping, via absorption of 14 μm photons, excites this ro-vibrational branch (Ziurys & Turner 1986; Aalto et al. 1995). It is possible that the radiative pumping may enhance the v2=0 emission of lower-J transitions (e.g., Carroll & Goldsmith 1981), potentially explaining elevated HCN/HCO+ ratios, but this has not yet been confirmed observationally. Most of the extragalactic HCN v2=1f detections are in systems which appear to contain dense, high column, hot (Tdust>100 K) cores (Aalto et al. 2015a). These systems, dubbed “Compact Obscured Nuclei” (CONs), feature compact starbursts and perhaps also deeply buried (Compton-thick) AGN and appear to be optically thick in the mid-infrared. As a result, submillimeter lines may be the only way to probe the inner structure. Individual galactic star-forming regions have also been found to have elevated HCN/HCO+, particularly in the circumnuclear disk (CND) of the Galactic center where HCN/HCO+∼1.5–2 (Mills et al. 2013). Despite the presence of v2=1f emission in the Galaxy’s CND, enhanced HCN emission appears to not be driven by IR pumping or XDRs. Mills et al. (2013) state photodissociation region (PDR) models are consistent with the observed ratio, but would likely fail to explain the high gas temperatures seen in the CND (RequenaTorres et al. 2012), while mechanical heating can simultaneously explain both the HCN/HCO+ ratio and the gas temperature. Furthermore, mechanical heating from a jet or outflow has been invoked as the driver of high HCN/HCO+ ratios in AGN hosts (e.g., Izumi et al. 2013; García-Burillo et al. 2014; Izumi et al. 2015, 2016). These observational results point to a complex interplay of excitation effects and chemistry-driven abundance variations. The shocks and turbulence resulting from supernovae, as well as AGN- and starburst-driven winds, which can penetrate deep into molecular clouds, may result in elevated HCN/HCO+ abundance ratios and higher HCN/HCO+ luminosity ratios. Substantial variations in the relative abundances of these tracer molecules and their excitation would bias estimates of the. dense gas mass from HCN luminosities. Atacama Large Millimeter/submillimeter Array (ALMA) observations are needed to resolve the emission from these molecular tracers and link luminosity variations to the underlying nuclear star formation and AGN activity. 1.2. Water Emission Emission from H2O molecules appears to be common in extreme star-forming galaxies (Fischer et al. 1999; GonzálezAlfonso et al. 2004, 2008, 2012; Fischer et al. 2010). The submillimeter H2O lines appear to require pumping from the far-infrared continuum (González-Alfonso et al. 2014), making water emission a good probe of warm, dusty regions and the far-infrared radiation field in those regions. Based on modeling of the H2O lines and agreement with results from millimeter HCN observations, González-Alfonso et al. (2014) argue the water emission is co-spatial with HCN emission. Additionally they find broad characteristics of the H2O emission at submillimeter wavelengths in warm, star-forming galaxies can be explained with dust temperatures Tdust=55–75 K, a 100 μm optical depth τ100∼0.1, and a column density of NH2 O ~ (0.2–2) ´ 1017 cm−2, when the highest-lying submillimeter lines (at >400 K) are not detected. The coupling of H2O emission to the infrared radiation field and the co-spatial nature with the HCN suggests that modeling of the water emission can constrain the dust temperature in the dense molecular gas independently of the infrared SED. This provides vital constraints on the physical conditions in the molecular regions traced by HCN, aiding in the interpretation of the HCN emission, both for systems that are optically thin and optically thick at 100 μm (González-Alfonso et al. 2014). 1.3. Target: IRAS 13120–5453 IRAS 13120–5453 is a ULIRG with LIR[8–1000 μm]= 2.1×10¹² Le (Armus et al. 2009) at a distance DL = 144 Mpc (z=0.03112; angular scale: 0.656 kpc arcsec−1). Several multiwavelength studies have morphologically classified this system as a post-merger, single-nucleus system (Figure 1; Haan et al. 2011; Stierwalt et al. 2013). Kim et al. (2013) applied GALFIT modeling to HST images of the system and found a significant portion of the flux (∼35%) is in non-axisymmetric structures, consistent with a scenario in which the system has not fully relaxed. A visual inspection of the large-scale morphology shows a faint tidal tail stretching to the north, with multiple loops surrounding the main body of the Galaxy, suggesting the extended regions of the system are re-accreting material from the tidal tails. The system is optically classified as a Seyfert 2 (Véron-Cetty & Véron 2001), and the equivalent width of the 6.2 μm polycyclic aromatic hydrocarbon (=0.45 μm; Stierwalt et al. 2013) suggests the infrared luminosity arises due to a mix of reprocessed radiation from both a starburst and AGN. X-ray observations of IRAS 13120–5453 also find evidence for an AGN, with an estimated ∼18% contribution of the AGN to LIR (Iwasawa et al. 2011). Nuclear Spectroscopic Telescope Array (NuSTAR) hard X-ray observations of the system are consistent with the presence of a +2.23 24 cm−2; Teng Compton-thick AGN (NH = 3.151.29 ´ 10 43 et al. 2015) with LAGN,2 – 10 keV = 1.25 ´ 10 erg s−1 and a star formation rate of ∼170 Me yr−1 (the latter determined from the thermal emission and the emission associated with high-mass X-ray binaries). The high obscuration toward the X-ray emitting 2.
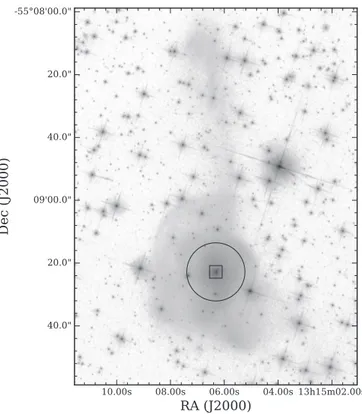
(3) The Astrophysical Journal, 835:213 (17pp), 2017 February 1. Privon et al. −1. −1. (H0 = 70 km s Mpc , Ωvacuum=0.72, Ωmatter=0.28; Hinshaw et al. 2009), with corrections for the three-attractor model of Mould et al. (2000). 2. Observations 2.1. Atacama Large Millimeter/submillimeter Array ALMA observations were carried out on 2014 May 18 in the C32-5 configuration, as part of project #2012.1.00817.S (PI: Aalto) with an on-source time of 19.1 minutes. These data have projected baseline lengths between 23 and 625 m. The observing setup consisted of four independent spectral windows: one each tuned to the redshifted frequencies of HCN (4–3), HCO+ (4–3) and two centered at frequencies of 331.9 GHz (covering CS (7–6)) and 333.7 GHz (Figure 2). All four spectral windows had bandwidths of 1.875 GHz. The weather conditions were good, with a precipitable amount of water vapor of 0.8 mm. The median on-source system temperature was 180 K. Observations were calibrated and imaged in a standard fashion using the Common Astronomy Software Applications (McMullin et al. 2007). The bandpass response of the array was calibrated using the quasar J10372934. The flux calibration was set by observations of Ganymede, using the Butler-JPL-Horizons 2012 model, as described in ALMA Memo 594.14 The absolute flux calibration is expected to be better than 10%. The gain calibration was done with the quasar J1329-5608. An iteration of phase selfcalibration was possible since the continuum of IRAS 131205453 is strong enough to allow us to derive gain solutions on a time interval of 20 s. The phase center is 13h15m06 316 −55d09m22 79 (J2000). The data were imaged using Briggs weighting (robust = 0.5; Briggs 1995) and the resulting resolution of the data cubes was 0 50 × 0 28 (∼325 × 180 pc) at a position angle of −75° with an rms sensitivity of 1.2 mJy beam−1 at 20 km s−1 spectral resolution. Continuumfree cubes were created by subtracting a linear baseline fit to the line-free channels in the image plane (CASA task imcontsub). We adopt a rest frequency of 354.526 GHz for HCN (4–3), 356.754 GHz for HCO+ (4–3), and 342.883 GHz for CS (7–6). The v2 = 1 HCN (4–3) doublet, included in the two higher frequency spectral windows, have rest frequencies of 354.460 GHz (v2 = 1e) and 356.256 GHz (v2 = 1f ); the former component is underneath the v2 = 0 line, while the latter is 420 km s−1 from the HCO+ (4–3) line (see Figure 2). When discussing the vibrational lines, we refer to them as HCN vibrational or explicitly denote the line as v2 = 1f. The v = 0 rotational lines will be referred to with their J-level transitions. All rest frequencies were obtained from the JPL Submillimeter, Millimeter, and Microwave Spectral Line Catalog (Pickett et al. 1998) through Splatalogue.. Figure 1. HST/ACS F814W image of IRAS 13120–5453 (A. S. Evans et al. 2016, in preparation), showing the single-nucleus, long tidal tail stretching to the north, and the loops from re-accreted tidal material. The black circle denotes the ALMA Band 7 primary beam. The detected line and continuum emission is concentrated on the nucleus and confined within the black square shown, which denotes the coverage of the panels in Figures 3 and 9.. region is consistent with the optical classification, where we only see the narrow lines. The optical depth of the 9.7 μm silicate absorption feature is τ9.7=2.52 (Stierwalt et al. 2014), corresponding to AV≈23 following the relationship found by Roche & Aitken (1985) for τ9.7 and AV for the galactic center. We note the obscuration giving rise to the silicate absorption likely occurs outside of the nucleus but within the host galaxy (e.g., GonzálezMartín et al. 2013; Roche et al. 2015) or from absorption within the starburst (Díaz-Santos et al. 2013). The [C II] emission is suppressed relative to the far-infrared ([C II]/LFIR= (6.3±0.1)×10−4; Díaz-Santos et al. 2013). Spitzer observations were used to place an upper limit on the mid-infrared size of the starburst of 2.68 kpc (Díaz-Santos et al. 2010), leading to a lower limit on the infrared luminosity surface density of 3.0×10¹¹ Le pc−2. Using the upper limit on the size, IRAS 13120–5453 lies below the compact starburst/[C II] suppression model of Díaz-Santos et al. (2013), though this may be due to the underestimation of the IR luminosity surface density. In this paper we present new ALMA Band 7 observations of the v2=0, 1 HCN (4–3), v2=0 HCO+ (4–3) and CS (7–6) lines (Section 2), then discuss the excitation of these dense gas tracers and a tentatively detected outflow (Section 3). Next we show results from modeling of the H2O lines observed with Herschel (Section 4), aimed at constraining the dust temperature of the dense ISM. We then explore the nuclear kinematics of the system (Section 5), and the ISM properties and starburst size inferred from our ALMA detection of the ∼333 GHz continuum emission (Section 6). We conclude by discussing the implications of the ISM properties for the fate of the starburst in IRAS 13120–5453 (Section 7). Where appropriate, values were computed assuming a WMAP-5 cosmology. 2.2. Herschel Space Observatory IRAS 13120–5453 was observed using the Photodetector Array Camera and Spectrometer (PACS; Poglitsch et al. 2010) and the Spectral and Photometric Imaging Receiver (SPIRE; Griffin et al. 2010) on the Herschel Space Observatory. The PACS observations were performed in high spectral sampling range spectroscopy mode on 2012 July 19 as part of the 14. https://science.nrao.edu/facilities/alma/aboutALMA/Technology/ ALMA_Memo_Series/alma594/abs594. 3.
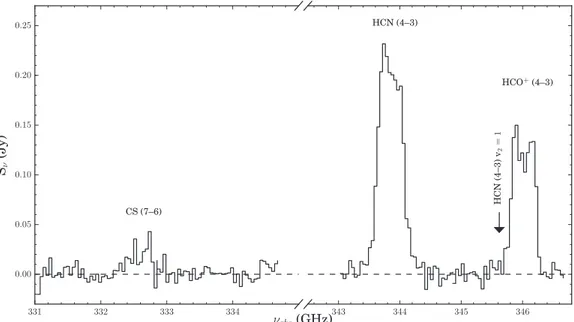
(4) The Astrophysical Journal, 835:213 (17pp), 2017 February 1. Privon et al.. Figure 2. Integrated spectra from the ALMA observations, continuum-subtracted and measured from a 3 arcsec diameter circular region centered on the nucleus. The locations of detected and expected lines are marked; their measured properties are given in Table 1. The arrow and label marks the location of the HCN (4–3) v2=1f line; emission is seen at those frequencies, but we attribute it to HCO+ (4–3) emission associated with a molecular outflow (Section 3.2.1).. Hermolirg OT2 project (PI: E. González-Alfonso; ObsIDs: 1342248346 & 1342248347). The SPIRE observation was performed on 2011 January 05 as part of the OT key program Hercules (PI: P.P. van der Werf; ObsID: 1342212342) with a single pointing centered on IRAS 13120-5453. The observation was conducted in high spectral resolution, sparse image sampling mode with a resolution of 1.2GHz in both observing bands (447–989 GHz and 958–1545 GHz). A total of 29 repetitions (58 FTS scans) were performed, resulting in a total on-source integration time of 3863s. The data reduction was done with the Herschel interactive processing environment (HIPE; Ott 2010) version 14.0.1. The PACS observations were reduced using the standard telescope normalization pipeline for chopped line scans and short range scans. Each spaxel in the PACS 5×5 spaxel array is a square with 9 4 to each side. At a distance of 144 Mpc this corresponds to ∼6 kpc, making the nuclear far-IR emission in IRAS 13120-5453 spatially unresolved in the central spaxel. As the point-spread function of the spectrometer is larger than the central spaxel, the central spectrum was extracted using the point source correction task available in HIPE 14.0.1. To compensate for small pointing offsets and jitter that might move flux out of the central spaxel, this extracted spectrum was scaled to the integrated flux level of the central 3×3 spaxels. The data reduction for the SPIRE observation was done with the standard single pointing pipeline. To extract the line fluxes of the SPIRE observation a bootstrap method was used. A total of 58 scans were drawn randomly, with replacement, from the original observation and then averaged together. For each detector, a polynomial baseline was then subtracted from the spectrum before simultaneously fitting the spectral lines using Gaussian profiles convolved with the instrumental response (a sinc function). This procedure was repeated 1000 times and a Gaussian was fitted to the resulting flux distribution of each line to obtain its mean line flux and standard deviation.. 3. The Dense Gas Tracers Emission from HCN (4–3), HCO+ (4–3) and CS (7–6) were detected at 215, 243, and 20σ, respectively (Figure 2). The emission from these species is compact (1 8, 1.2 kpc) and centrally concentrated (Figure 3). We did not see clear evidence for strong emission of the v2=1f HCN (4–3) vibrational transition, but see Section 3.2.1 for discussion. We also detect the 333 GHz continuum emission at 225σ (Table 1). Measured parameters are provided in Table 1. Properties of IRAS 13120–5453 derived from these observations are given in Table 2 and discussed in detail in later sections. 3.1. Comparison with Single-dish Measurements IRAS 13120–5453 was observed by Zhang et al. (2014) with the APEX 12 m telescope. Using a conversion of 41 Jy K−115, their HCN (4–3) and HCO+ (4–3) fluxes are 82 ± 12 Jy km s−1 and 66 ± 12 Jy km s−1, respectively. Our HCN flux agrees with theirs, suggesting we are recovering the total flux with these ALMA data. Our HCO+ flux is ∼25% lower than theirs, indicating we may be resolving out some extended flux on scales 8″ (the largest recoverable scale for this ALMA configuration and observing frequency) and 18″ (the beam size of APEX at these frequencies), though emission on scales 4″ will also be affected by filtering. The possible effects of this are further discussed in Section 3.2.2. Zhang et al. (2014) quote an upper limit of <36.6 Jy km s−1 for the CS (7–6) line; our measured line flux is nearly a factor of 10 below their upper limit, and thus consistent. Using our detections of several dense gas tracers we investigate the excitation of HCN and HCO+, as well as the spatial variations of the HCN/HCO+ ratio (Section 3.2). These ALMA data further reveal tentative evidence for outflowing dense molecular gas, through wings on the HCN and HCO+ lines (Section 3.3). 15. Obtained from the APEX website: telescope/efficiency/.. 4. http://www.apex-telescope.org/.
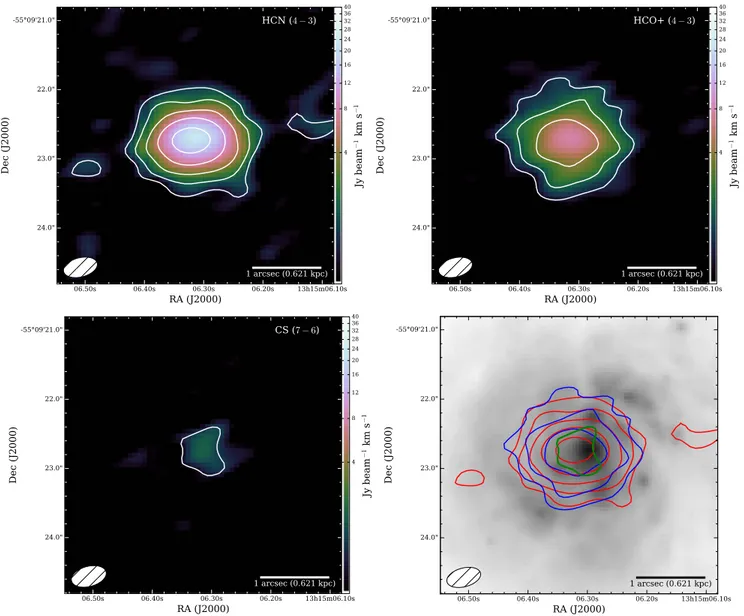
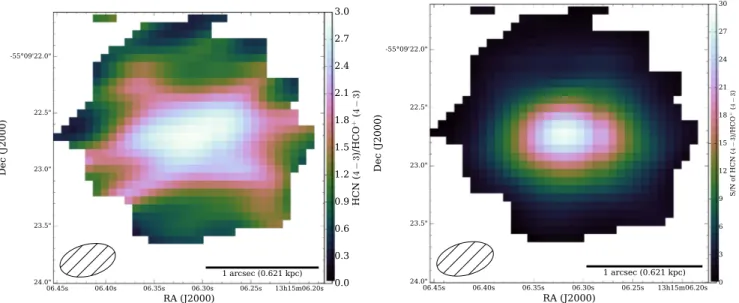
(5) The Astrophysical Journal, 835:213 (17pp), 2017 February 1. Privon et al.. Figure 3. Upper left: HCN (4–3) total intensity map. Upper right: HCO+ (4–3) total intensity map. Lower left: CS (7–6) total intensity map. Lower right: HST/ACS F814W image of the central ∼7 kpc of IRAS 13120–5453, with the total intensity of HCN (4–3), HCO+ (4–3), and CS (7–6) shown in red, blue, and green contours, respectively, to illustrate their relationship to each other and the underlying optical continuum emission. The three color scale figures all utilize the same brightness scaling to illustrate the relative intensity of the three molecular lines. In all figures, the size of the ALMA synthesized beam is shown in the lower-left. The emission from these tracers is confined to a molecular disk with an overall extent of ∼1.2 kpc. The contour levels in all four panels begin at 1 Jy beam−1 km s−1 and increase by factors of 2. The relative astrometry of the HST/ACS image is uncertain to roughly 1″, so the peak of the molecular emission may be consistent with the position of the optical nucleus.. 3.2. Excitation of HCN and HCO+. Table 1 Measured Molecular Line and Continuum Properties Integrated Flux. FWHMa (km s−1). HCN (4–3) HCN (4–3) v2=1f HCO+ (4–3) CS (7–6). 86.2±0.4 Jy km s−1 <0.27b Jy km s−1 48.6±0.2 Jy km s−1 4.2±0.2 Jy km s−1. 380 K 360 250. 333 GHz. 89.8±0.4 mJy. K. ¢ ( 4 – 3) In Figure 4 we show the spatially resolved L HCN ¢ L HCO+ (4 – 3) ratio and its S/N. The ratio map was created by dividing the total intensity map of HCN (4–3) by the total intensity map of HCO+ (4–3), masking out the regions where HCO+ (4–3) was not detected at 3σ. We find that the HCN/ HCO+ ratio peaks at ∼2.8 over the nucleus (in the central resolution element: 325×180 pc), and decreases to ∼1 off the nucleus. We measure a spatial- and velocity-integrated HCN (4–3)/HCO+ (4–3) ratio of 1.77±0.01. How do these ratios compare with the ratios expected for starburst galaxies? If we cross-correlate the single-dish HCN (4–3) and HCO+ (4–3) measurements of Zhang et al. (2014) with the 6.2 μm PAH EQW measurements of Stierwalt et al. (2013) and take the PAH EQW as a proxy for midinfrared AGN dominance (EQW<0.2 are dominated by. Notes. Col 1—Line identification or continuum frequency, Col 2—Integrated flux (for lines) or flux density (for continuum), Col 3—Measured full-width of the emission line at half of the observed peak value. a Width measured directly from the line profiles. b 1σ upper limit, assuming a boxcar line with a width of 200 km s−1, motivated by the width of detected v2=1f lines in other systems (Aalto et al. 2015a).. 5.
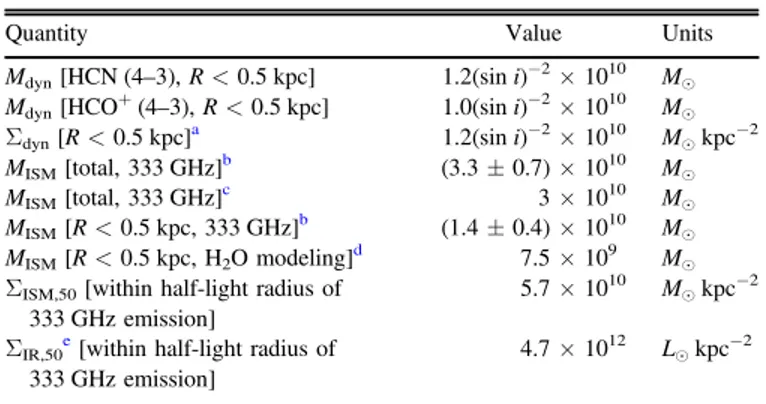
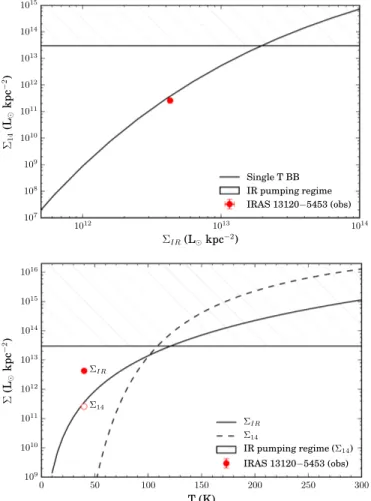
(6) The Astrophysical Journal, 835:213 (17pp), 2017 February 1. Privon et al.. system, not consistent with expectations for emission from a vib-rotational line, which should be centered on the nucleus (e.g., Aalto et al. 2015a). Thus, we conclude the line wing on HCO+ (4–3) is not the v2=1f HCN (4–3) line. Is the 14 μm luminosity surface density high enough to expect appreciable infrared pumping? Using Spitzer IRS spectroscopy, Díaz-Santos et al. (2010) found IRAS 13120–5453 to have an unresolved core with a size of 2.68 kpc (FWHM) at 13.2 μm. Approximately 80% of the mid-infrared emission arises in this core. Spitzer observations of IRAS 13120–5453 by Inami et al. (2013) show a 14 μm flux of F14=0.5 Jy. If we take the unresolved portion of the 14 μm emission and the area we infer from our ALMA observation of the 330 GHz continuum (FWHM of 0.56 kpc×0.49 kpc; Section 6), we estimate a 14 μm luminosity surface density of Σ14∼2.6×10¹¹ Le kpc−2. This is approximately two to three dex below the lower limit of the 14 μm surface brightness derived for sources with detected v2=1f HCN lines in (Aalto et al. 2015a). Applying an extinction correction to Σ14 for IRAS 13120–5453 would reduce the discrepancy, but we have no evidence to suggest the mid-infrared emission is being absorbed behind a significant screen of cooler dust. The significantly lower Σ14 in IRAS 13120–5453 suggests the 14 μm continuum may not be effective at radiatively pumping HCN. Several detections of the HCN v2=1f lines occur in systems where the HCN and HCO+ emission is strongly self-absorbed, consistent with a scenario in which the nuclear gas has high density and a high column (Aalto et al. 2015a). There is evidence for some self-absorption in IRAS 13120–5453, but it is not nearly as significant as seen in CONs with detected v2=1f emission. The integrated line profile (Figure 2) does show a dip in the center, which could be the result of some foreground absorption. We have performed some exploratory large velocity gradient (LVG) modeling of the HCN (4–3), HCO+ (4–3), and CS (7–6) lines using the Radex and DESPOTIC codes (van der Tak et al. 2007; Krumholz 2014). We ran grids of models covering a range of densities (log10 (n cm-3) = 2–7), column densities (log10 (NH2 /cm−2)=21–25), and relative HCN/HCO+ abundances (10−3–103). While the solutions are under-constrained and so we cannot propose “best” values for the system, solutions which matched the observed HCN (4–3)/ HCO+ (4–3) value of 2.8 over the nucleus required relative HCN/HCO+ abundances 10. This is similar to the result of Izumi et al. (2016), who find HCN/HCO+ abundance ratios of a few to 10 are needed to explain the observed HCN/HCO+ in AGN hosts, while HCN/HCO+ abundance ratios of ∼1 can explain the emission in starburst galaxies. As we will discuss in Section 7, this abundance enhancement is suggestive of mechanical heating from the nuclear starburst. Measurements of additional transitions of HCN and HCO+ are needed to perform more detailed LVG modeling to simultaneously constrain the H2 density and relative abundance of each species while also constraining the excitation of these tracer molecules.. Table 2 Derived Nuclear Properties Quantity. Value. Mdyn [HCN (4–3), R<0.5 kpc] Mdyn [HCO+ (4–3), R<0.5 kpc] Σdyn [R<0.5 kpc]a MISM [total, 333 GHz]b MISM [total, 333 GHz]c MISM [R<0.5 kpc, 333 GHz]b MISM [R<0.5 kpc, H2O modeling]d ΣISM,50 [within half-light radius of 333 GHz emission] ΣIR,50e [within half-light radius of 333 GHz emission]. Units. 1.2(sin i)−2×10¹⁰ 1.0(sin i)−2×10¹⁰ 1.2(sin i)−2×10¹⁰ (3.3±0.7)×1010 3×10¹⁰ (1.4±0.4)×1010 7.5×10⁹ 5.7×10¹⁰. Me Me Me kpc−2 Me Me Me Me Me kpc−2. 4.7×10¹². Le kpc−2. Notes. a Calculated using the mean Mdyn from HCN and HCO+. b Calculated using the empirical relation from Scoville et al. (2014). This calibration assumes the H I mass is equal to 50% of the molecular mass. The Scoville et al. (2016) relation removes the H I mass from the calibration, resulting in a 1/3 reduction in the inferred mass. c Estimated by computing a dust mass from the 333 GHz continuum emission with the temperature derived from the H2O modeling and assuming a gas-todust ratio of 100. d Calculated from the H2 column inferred from the modeling of H2O lines. e Calculated by taking the 80% of LIR estimated by Díaz-Santos et al. (2010) to originate within the nuclear starburst, and assuming the LIR follows the distribution of the submillimeter continuum emission.. AGN), the star-forming galaxies have HCN/HCO+ ratios of between 0.2 and 1.5. Thus, the extended emission in IRAS 13120–5453 has a ratio consistent with these starburstdominated systems. The high HCN/HCO+ ratio over the nucleus may point to different excitation conditions and/or HCN/HCO+ abundance ratios, co-spatial with the AGN and nuclear starburst. The line ratios for the nucleus are consistent with what is seen for other AGN hosts (Izumi et al. 2016). We now discuss the potential mechanisms that could plausibly result in an elevated HCN/HCO+ ratio. 3.2.1. Limits on Vibrational HCN Emission. Rotational–vibrational lines of HCN (v2=1f, J = 4 3 or 3 2) have now been detected in eight galaxies (Sakamoto et al. 2010; Imanishi & Nakanishi 2013; Aalto et al. 2015a, 2015b; S. Aalto et al. 2016, in preparation). The systems have compact nuclei and high implied infrared luminosity surface densities. Based on the high infrared luminosity and low [C II]/ LFIR ratio (which has been shown to be correlated with starburst luminosity density Díaz-Santos et al. 2013), IRAS 13120–5453 was viewed as a likely candidate for the vibrational HCN lines. However, we do not detect the v2=1fHCN (4–3) line in IRAS 13120–5453, with a 3σ upper limit of 0.81 Jy km s−1, assuming a linewidth of 200 km s−1. We find the v2=0/ v2=1fratio to be >100, in contrast to measured ratios of 4–10 when the v2=1f line is detected (Aalto et al. 2015a). The HCO+ (4–3) line has a small “shoulder” on the red side (Figure 5); we interpret this as outflowing dense molecular gas (see Section 3.3), but it could plausibly be attributed to the v2=1f line. If this feature is in fact the HCN (4–3) v2=1f line, we find a flux of 2 Jy km s−1, which is a factor of ∼40 fainter than the main HCN (4–3) line. However, as is evident from the PV diagram for HCO+ (4–3) (Figure 5), the highvelocity emission is not co-spatial with the center of the. 3.2.2. Missing Flux and the HCN/HCO+ Ratio. What effect does the missing flux in the HCO+ (4–3) line have on our interpretation of line ratios? Zhang et al. (2014) find a HCN/HCO+ ratio of 1.2±0.3, somewhat lower than what we find here. If we assume, as a worst-case scenario, that the 17 Jy km s−1 difference in HCO+ (4–3) flux between our 6.
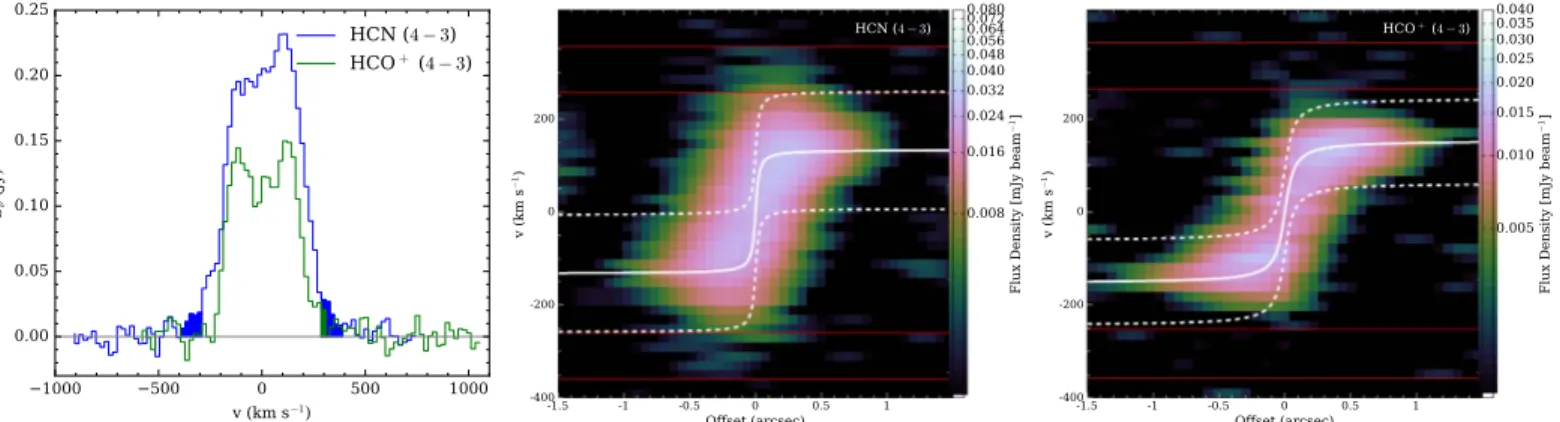
(7) The Astrophysical Journal, 835:213 (17pp), 2017 February 1. Privon et al.. Figure 4. Left: map of the HCN (4–3)/HCO+ (4–3) ratio. Right: signal-to-noise map for the HCN (4–3)/HCO+ (4–3) ratio. The HCN/HCO+ is high over the nucleus (central ∼300 pc) and shows a strong (factor of ∼3) decrease in the outer portion of the disk.. HCN (4–3) and HCO+ (4–3) lines differ somewhat; this may be due to differential optical depths for the two lines, but they provide consistent estimates for the observed rotation curve and the virial range. Thus, from Figure 5, we conclude the emission isolated as outflows is deviating from the rotation curve seen in the gas. Based on the velocity channels identified as outflows, approximately 4% of the detected HCN flux is associated with outflowing gas, while only 1% of the HCO+ flux is in outflows. The luminosity ¢ (4 - 3),outflow » 2 ´ 107 K km s−1 pc2 and in the outflow is L HCN ¢ +(4 - 3),outflow » 3 ´ 106 K km s−1 pc2. Despite the fact that L HCO we are missing 25% of the single-dish HCO+ flux, we are not likely to be missing outflowing gas, given the spatial filtering occurs on scales of of >4″ and due to the fact that the observed HCN outflow is confined to a region only a few synthesized beams across. The outflow velocities are modest, spanning 200–400 km s−1 in HCN, and 200–300 km s−1 in HCO+ (Figure 5). With the present data we cannot rule out the presence of dense outflows at the high velocities (∼1200 km s−1) seen in OH (Veilleux et al. 2013), though we do not see emission at intermediate velocities. Other HCO+ (4–3) observations (K. Sliwa 2016, in preparation) find blueshifted emission at a velocity of ∼1100 km s−1, but it is unclear if this is HCO+ associated with the OH outflow or emission from another molecular species.. measurements and those of Zhang et al. (2014) was uniformly resolved out in a 4″ region (the scale on which filtering may start to affect these observations), the contribution of this emission to the central resolution element is 0.15 Jy km s−1. This contribution would only increase the HCO+ (4–3) flux in the central resolution element by ∼3% and so would not substantially affect the ratio at the center of the emission. At larger radii, where the HCN and HCO+ emission is fainter, the potential contribution is more significant, but still amounts to 15%. Thus, we conclude that the missing HCO+ (4–3) flux does not significantly influence our spatially resolved determination of the HCN/HCO+ line ratio. 3.3. Dense Molecular Outflows We see wings (∼300 km s−1) on both the HCN (4–3) and HCO+ (4–3) lines (Figure 5). The HCN emission appears to have both blue and redshifted wings while, in contrast, HCO+ appears to only have a small amount of emission in the redshifted wing. The HC3N (39–38) line lies at an observed frequency of ∼344.1 GHz and can possibly contribute to emission on the blue side of HCN (4–3). However, the imaging of the line wings from the channel shows it is also spatially offset from the nucleus, while we could expect HC3N (39–38) to be centrally concentrated. Thus we conclude that the line wings are not being contaminated by HC3N (39–38). In Figure 5 we show position–velocity diagrams for both species, taken along the observed disk major axis (PA = 94°). The solid white lines denote the best-fit rotation curve obtained from modeling the data cubes with GalPak3D (Bouché et al. 2015).16 We also show the expected virial range for the gas (e.g., García-Burillo et al. 2015), defined as a combination of the circular motion, velocity dispersion, and a contribution from in-plane non-circular motion (taken as having a magnitude of 50% of the circular velocity). The velocities identified as outflows (denoted in Figure 5 by the red lines) lie outside the virial range predicted from the kinematic modeling, indicating they are not participating in quiescent motion within the molecular disk. The details of the kinematic fits to the 16. 3.3.1. Velocity-resolved HCN/HCO+ Ratio. In addition to positional variations, the HCN/HCO+ ratio varies as a function of velocity both for the entire source (Figure 6, middle) and the central resolution element (Figure 6, bottom). In particular, the ratio appears most elevated (HCN/ HCO+≈4) in the high-velocity component of the line, which we attribute to a molecular outflow in the center of the system (Section 3.3). The line ratio in the outflow is approximately the same as the velocity-integrated ratio in the central resolution element, however the line ratio in the central resolution element appears elevated (>2) at all velocities (Figure 6 bottom). This, in addition to the relatively small contribution of the outflow to the total line flux means the HCN enhancement in the center is not solely due to the presence of the outflow and its high HCN/. http://galpak.irap.omp.eu/. 7.
(8) The Astrophysical Journal, 835:213 (17pp), 2017 February 1. Privon et al.. Figure 5. Left: spatially integrated line profiles for HCN (4–3) (blue) and HCO+ (4–3) (green). Here, 0 km s−1 corresponds to a redshift z = 0.03112, based on the location of the HCN (4–3) line. The colored, shaded regions denote the channels associated with outflows. Approximately 4% of the HCN flux is in outflowing material, while only 1% of the HCO+ emission is associated with the outflow. The HCN emission appears to have both blue and redshifted wings, while the HCO+ emission only has a redshifted wing. Middle: Position–velocity diagram of HCN (4–3). Bottom: PV diagram for HCO+ (4–3). Both PV diagrams were measured with a cut along the major axis (PA = 94°) of the HCN total intensity map and the data are displayed in a logarithmic scaling. The emission from both species appears to be mainly confined to the solid-body portion of the rotation curve, though some evidence for flattening is seen at velocities ∼200, particularly in HCO+, where the emission extends over a slightly larger region. The solid white lines in the middle and right panels show the best-fit rotation curves from GalPak3D (Bouché et al. 2015) modeling. The dotted lines denote the virial range for the rotation curves. The red horizontal lines mark the velocity regions where emission is identified as outflows. This emission identified as winds lies clearly above the flattening of the rotation curve, suggesting it has a non-rotational component to its velocity.. HCO+ ratio. The emission from HCN is enhanced over that of HCO+ at all velocities within the central few hundred parsecs of IRAS 13120–5453.. be taken into account. We used Tgas=150 K and n H2 = 3 ´ 10 4 cm−3, which yields a thermal pressure similar to that inferred for the warm molecular gas component in Arp220 (Rangwala et al. 2011). These values are sufficient to produce emission in the H2O 111 000 but still low enough to leave the higher-lying lines relatively unaffected. We found that the best fit to the observations is achieved with a dust opacity of τ100=0.1–1, with τ100=0.5 being the preferred value. For these values of τ100 the relative fluxes of the high-lying lines can be well fitted with different combinations of dust temperatures between Tdust=40 and 60K, and H2O columns between NH2 O DV = 2 ´ 1014 and 5×1015 cm−2 (km s−1)−1. The best fit, which is also included in Figure 7, is achieved with τ100=0.5 Tdust=40 K, and NH2 O DV = 2.5 ´ 1015 cm−2 (km s−1)−1. The H2O lines are unresolved with Herschel, but it is likely the emission arises from a similar region to the HCN and HCO+ emission (González-Alfonso et al. 2014). Thus, we can use the observed velocity dispersion of those lines as proxy for ΔV of the H2O lines (which are unresolved with Herschel). Taking the mean dispersion of the HCN and HCO+ lines (Figure 8) of 140 km s−1 we find a column density of NH2 O = 3.5 ´ 1017 cm−2. The H2 column inferred from the best-fit τ100 and our assumed dust-to-gas ratio is ∼6.7×1023 cm−2. This implies an abundance of H2O relative to H2 of 5×10⁻⁷, somewhat lower than what is seen in more compact/obscured systems such as Mrk231 (GonzálezAlfonso et al. 2008). We can compare the H2 column derived from the H2O modeling with NH determined from modeling of NuSTAR −2 +2.23 24 observations. The NuSTAR NH = 3.151.29 ´ 10 cm probes the column between us and the hard x-ray emitting portion of the IRAS 13120–5453, while the Herschel-derived H2 column probes the entire line of sight through the nucleus (assuming the H2O emission traces the entire ISM). If the ISM is symmetrically distributed about the nucleus, approximately half of the ∼6.7×1023 cm−2 H2 is between us and the nucleus and the other half is on the far side of the Galaxy. Considering that the absorption cross-section of the hydrogen atoms is not significantly affected by being bound in molecules (Cruddace. 4. Water Emission in IRAS 13120–5453 Figure 7 shows show the Herschel PACS and SPIRE spectra, as well as the spectral line energy distribution of the H2O lines detected with SPIRE and PACS. The line fluxes are given in Table 3. Two of the ten H2O transitions targeted by the Hermolirg project were detected in absorption, both with lower level energies of 100K. We see no obvious contamination by other species in any of the lines. Five H2O transitions, with upper level energies of 300K, were detected in emission with SPIRE. We have used the spherically symmetric radiative transfer code described by González-Alfonso & Cernicharo (1997, 1999) to model the observed H2O lines and constrain the dust temperature and opacity of the dense ISM. The code includes collisional excitation as well as excitation by the farinfrared field emitted by warm dust. Dust is modeled as a mixture of silicates and amorphous carbon, with an adopted mass absorption coefficient as a function of wavelength which is shown in González-Alfonso et al. (2014). The models are characterized by the following parameters: the dust opacity at 100 μm (τ100), the dust temperature (Tdust), the gas temperature (Tgas), the H2 density (n H2 ), and the column density of H2O per unit velocity dispersion (NH2 O DV ). Collisional rates with H2 are taken from Dubernet et al. (2009) and Daniel et al. (2011) for H2O. We have adopted a gas-to-dust ratio of 100 by mass, guided by the average value in LIRGs reported by Wilson et al. (2008). Our general approach to the modeling was to compare the observed ratios of various H2O lines to a grid of models with varying Tdust, NH2 O DV , τ100, n H2 , and Tgas. We found that the H2O line ratios in IRAS 13120-5453 cannot be reproduced with collisional excitation alone. In fact, the excitation is found to be dominated by absorption of photons emitted by warm dust, with collisions mainly affecting the lowest-lying H2O levels. The fact that the H2O 111 000 line is detected in emission suggests that some collisional excitation should 8.
(9) The Astrophysical Journal, 835:213 (17pp), 2017 February 1. Privon et al.. Figure 7. Top: Herschel SPIRE spectrum of IRAS 13120–5453, with the locations of [N II], CO, and H2O lines marked. Presentation of the CO and [N II] lines can be found in Kamenetzky et al. (2016) and N. Lu etal. (2016, in preparation). Middle: HerschelPACS spectrum, with the locations of H2O lines marked. See Table 3 for measured fluxes of the H2O lines and Figure 7 for the H2O SLED. Bottom: spectral line energy distribution of the H2O lines detected with SPIRE and PACS. The black squares present the data, normalized to the flux of the H2O 2 02 111 line. The best fit model is shown as a dashed blue line.. Figure 6. Top: the HCN (4–3) and HCO+ (4–3) line profiles in the central resolution element. Middle: the HCN/HCO+ ratio as a function of velocity, for the central resolution element (black line). Bottom: the HCN/HCO+ ratio as a function of velocity, integrated over the entire source (black line). In the lower two panels, the shaded region marks the 1σ statistical uncertainty in the velocity-resolved ratio. For comparison we show the velocity-integrated line ratio for the entire source (1.77; blue dashed line) and for the central resolution element (2.85; red dotted–dashed line). The ratio is further enhanced in the channels associated with outflowing gas (Section 3.3). The line ratios near the systemic velocity may be affected by selfabsorption, which appears to impact HCO+ (4–3) more strongly than HCN (4–3).. column. The molecular ISM may be a significant contributor to the Compton-thick screen between us and the AGN in IRAS 13120–5453. We note the dust temperature derived from modeling of the H2O lines does not provide constraints on the possibility of infrared pumping of HCN as it reflects the dust temperature of the overall nuclear ISM, rather than any compact (10s of pc). et al. 1974; Morrison & McCammon 1983), the offsetting factors of two imply the molecular ISM could contribute NH,mol ~ 6.7 ´ 10 23 cm−2, or ∼20% of the AGN’s obscuring 9.
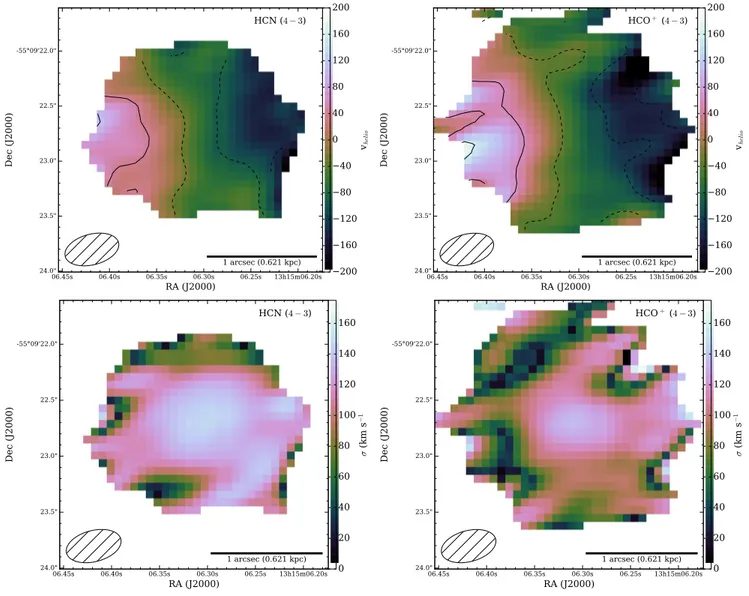
(10) The Astrophysical Journal, 835:213 (17pp), 2017 February 1. Privon et al.. mass surface density of 2.0×10 central kpc.. Table 3 H2O Lines Detected with Herschel νrest (GHz). Eupper (K). Cont.a (Jy). H2O 111 0 00 H2O 2 02 111 H2O 211 2 02 H2O 2 20 211 H2O 312 303 H2O 321 312 H2O 4 22 413 H2O 523 514. 1113.34 987.93 752.03 1228.79 1097.36 1162.91 916.17 1410.62. 53 101 137 196 249 305 454 642. 9.6 6.8 2.9 12.6 9.2 10.8 12.0 18.0. H2O 321 212 H2O 2 21 110. 3977.05 2773.98. 114 61. 56.7 57.1. Line. 10. Me kpc. −2. within the. Flux (Jy km s−1). 6. Nuclear Continuum Emission. 314.2±81.0 1337.5±244.3 888.1±86.2 1061.3±113.9 720.8±98.2 1271.1±113.3 <236.3 <177.8. We detect 333 GHz continuum emission with a total flux of 89.8±0.4 mJy. For this flux, and Tdust=40 K derived from the H2O modeling, and a mass absorption coefficient of the dust at 333 GHz of κ(333 GHz)=0.28 cm2 g−1 (consistent with Milky Way dust properties; Bianchi 2013); this implies a dust mass of 2.9×10⁸ Me. If we assume a gas-to-dust ratio of 100 (Wilson et al. 2008), the ISM mass is then ∼3×10¹⁰ Me. Alternately, using the empirical L 850 m m –MISM relation derived from low-z galaxies (Scoville et al. 2014), the continuum emission implies a similar total ISM mass of (3.2±0.7)× 1010 Me.17 The detected continuum emission is contained within an ellipse with axes of 2 5×1 9 (1.6 kpc×1.2 kpc; Figure 9). The distribution of the emission is well represented by a 2D Gaussian with a beam-deconvolved size (FWHM) of 0 86×0 75 (0.56 kpc×0.49 kpc) at a PA of 60°, and is marginally resolved. This is the best measurement for the size of the nuclear starburst in IRAS 13120–5453, improving the constraints on the area of the starburst by a factor of ∼25. Díaz-Santos et al. (2010) estimated that ∼80% of LIR originates in the compact starburst. If we assume LIR is distributed in the same way as the submillimeter continuum emission, we can estimate the IR luminosity surface density within the half-light radius as SIR,50 = LIR,50 A50 , where LIR,50 is the luminosity contained within the half-light radius of the nuclear starburst (0.4LIR, considering only the unresolved portion) and A50 = pasb bsb is the half-light area with semimajor and semiminor axes of asb and bsb. We find SIR,50 = 4.7 ´ 1012 Le kpc−2. This is ∼10× larger than the ΣIR inferred by Díaz-Santos et al. (2010) based on Spitzer data. Compared to the [C II] deficit relation for starbursts from Díaz-Santos et al. (2014), our ΣIR,50 places IRAS 13120–5453 on the correlation of the [C II] deficit and starburst luminosity surface density, suggesting the [C II] deficit in IRAS 13120–5453 can be mostly explained by the compact starburst and does not require significant AGN contribution to LFIR. Using the same size, we find an ISM surface density of SISM,50 = 5.7 ´ 1010 Me kpc−2 within the half-light radius. Within a 1 kpc diameter, the 333 GHz continuum emission is consistent with an ISM mass of (1.4±0.4)×1010 Me and a corresponding mass surface density of SISM,1 kpc = (1.7 0.5) ´ 1010 Me kpc−2. This is comparable to the dynamical mass estimated from the HCN and HCO+ kinematics (Section 5.1) and implies MISM/Mdyn≈0.9 within the central kpc. It is possible the ISM mass estimate from these ALMA data, which use the empirical calibration of Scoville et al. (2014), are biased high, relative to the galaxies used to calibrate it if the mass-weighted dust dust temperature is higher in IRAS 13120–5453. The empirical calibration was arrived at ¢ and MH2—if using a galactic conversion factor between L CO the conversion factor varies from this value in the galaxies used. −1400.7±237 −1240.3±156. Note. a Value of the fitted baseline at the line center.. hot nuclear core (though such a core appears unlikely to be present, based on the lack of detectable IR pumping and the low Σ14; Section 3.2.1). 5. Nuclear Kinematics In Figure 8 we show the intensity-weighted velocity field (moment 1; top row) and velocity dispersion (moment 2; bottom row) for HCN (4–3) (left) and HCO+ (4–3) (right). The emission from both species appears broadly consistent with a rotating disk, with centrally peaked velocity dispersion. Correspondingly, the PV diagrams taken along the observed major axis of the emission (Figure 5) show clear signatures of rotation. The (4–3) emission from both species appears to be mainly concentrated in the solid-body rotation portion of the potential, though the HCO+ (4–3) velocity begins to flatten out beyond ∼0 75 (0.48 kpc). The emission tentatively identified as the outflow lies above the apparent turnover in the rotation curve and outside the estimated virial range, consistent with a scenario in which the gas motion is not solely due to the gravitational potential. We adopt z = 0.03112 as the systemic redshift, based on the moment 1 value at the center of the detected ALMA continuum emission (13h15m06 32, −55d09m22 78). This is somewhat higher than the optical redshift found on NED (z=0.030761) as measured by Strauss et al. (1992). The optical redshift was determined using Hα, and so could be somewhat offset from the true systemic by obscuration. 5.1. Nuclear Dynamical Mass Using both the HCN (4–3) and HCO+ (4–3) emission, we 2 R G . Within a can estimate the dynamical mass as M ~ Vcirc + 1 kpc diameter region, HCN and HCO have FWHMs of 385 km s−1 and 375 km s−1, respectively and we compute the circular velocity as Vcirc = FWHM (2 ln 2 ). This corresponds to estimated dynamical masses of 1.2 (sin i )-2 ´ 1010 Me and 1.0 (sin i )-2 ´ 1010 Me. Adopting the mean value of 1.1 (sin i )-2 ´ 1010 Me, and the area (0.78 kpc−2), we find a total mean mass surface density of 1.4 (sin i )-2 ´ 1010 Me kpc−2. Assuming the disk is intrinsically circular, the observed axis ratios suggest i≈55°, leading to an inferred dynamical mass of 1.6×10¹⁰ Me and a mean. 17 We note the Scoville et al. (2014) calibration includes the H I mass and assumes this mass of this atomic ISM component is equal to 50% of the molecular mass. The Scoville et al. (2016) calibration does not consider the H I mass, so the empirical normalization is reduced by 1/3. Thus, to obtain only the molecular ISM mass (equivalent to the Scoville et al. 2016) calibration, ISM mass derived directly from the continuum flux should be multiplied by 0.67.. 10.
(11) The Astrophysical Journal, 835:213 (17pp), 2017 February 1. Privon et al.. Figure 8. Top row: intensity-weighted velocity map for HCN (4–3) (left) and HCO+ (4–3) (right). Contours are spaced every 50 km s−1. Bottom row: intensityweighted velocity dispersion map (moment 2) for HCN (4–3) (left) and HCO+ (4–3) (right). The extent of each map was determined by masking the datacube at the 3σ level in the corresponding total intensity (moment 0) map. The velocity fields of both molecules are consistent with ordered rotation, in a ∼1 kpc central molecular disk. Both species show centrally peaked velocity dispersions, though the HCO+ peaks at a slightly lower value.. range of Wilson et al. (2008), but on the lower end. Finally, the ISM mass estimate derived from the dust mass is sensitive to the choice of κ. An elevated value of κ would reduce the calculated dust mass and the inferred ISM mass. We can make an additional estimate of the ISM mass from the H2 column density, NH, inferred from the H2O modeling (Section 4) as MISM = m (4 3) pR2mH NH , where μ=1.4 accounts for the mass in helium, R is the radius, mH is the mass of hydrogen. For R=500 pc, we calculate MISM= 7.5×10⁹ and an implied MISM/Mdyn=0.47. This ISM mass estimate is sensitive to the best-fit dust temperature and τ100 inferred from the H2O modeling. Higher temperatures and lower τ100 values would further reduce the estimate ISM mass. Using the starburst size, inferred ΣIR,50, and gas fraction of fg≈0.3 (as observed in sources with similar LIR), we can compare with the Thompson et al. (2005) model for a radiation pressure-limited starburst. We find that IRAS 13120–5453 is near to but slightly below the maximal starburst line for these values (for σ≈200 km s−1). For the measured peak flux density of 12.6 mJy beam−1 the brightness temperature at 333 GHz is 2.7 K, suggesting the dust. to calibrate the relation, the resulting empirical relationship would overestimate the ISM mass. Alternately, the gas-to-dust ratio may be different in IRAS 13120–5453, compared to the calibration sources in Scoville et al. (2014). Wilson et al. (2008) found a mean gas-to-dust ratio of 120 for IR-luminous galaxies, but there is an order of magnitude range in the gas-to-dust ratio for the systems in that study ((29±8)–(725±286)). If the gas-to-dust ratio in IRAS 13120–5453 is on the lower end of the range, the actual ISM mass would be correspondingly lower and in less tension with the dynamical mass. Furthermore, our ISM mass estimate calibration includes an assumed H I component; if we instead adopt the calibration of Scoville et al. (2016) for only the molecular ISM, we would find a value reduced by 1/3. For comparison, the nuclear gas fraction in systems such as Arp220 and NGC6240 are ∼1/3 (Scoville et al. 1997; Solomon et al. 1997; Sakamoto et al. 1999; Downes & Eckart 2007; Scoville et al. 2015), showing that MISM is a substantial fraction of Mdyn in ULIRGs. If we assume IRAS 13120–5453 has a similar gas fraction, the implied gas-to-dust ratio would be on the order of 30 or 40, consistent with the 11.
(12) The Astrophysical Journal, 835:213 (17pp), 2017 February 1. Privon et al.. Figure 9. Map of the 333 GHz continuum emission (white contours), superimposed on an HST/ACS F814W image of IRAS 13120–5453. The contour levels are 1, 2, 4, and 8 mJy beam−1. The relative astrometry of the HST/ACS image is uncertain to roughly 1″, so the 0.8 mm continuum peak is consistent with the position of the optical nucleus.. emission on the scale of our beam is optically thin. If we take the 40 K dust temperature from modeling of the H2O lines as the true dust temperature, we estimate τ=0.071. 6.1. Comparison to Planck Limit and Herschel Extrapolation. Figure 10. Herschel PACS and SPIRE spectral energy distribution of IRAS 13120–5453 (fluxes from J. Chu et al. 2016, in preparation), fit with two different models. Top: single-component modified blackbody fit with a best-fit temperature of 34 K. Bottom: two-component modified blackbody fit. One component was fixed in temperature to 40 K, as derived from our H2O modeling and the amplitude fixed to that of the ALMA 333 GHz flux measurement. The temperature and amplitude of the second component was left free and the sum was fit to the Herschel measurements. The best-fit temperature for the second component is 26 K. For all modified blackbodies we fix the dust emissivity to β=1.8. Both fits to the Herschel photometry predict a similar 333 GHz flux density, 190 mJy from the single-component and 210 mJy for the two-component model. Both predictions are broadly consistent with the Planck upper limit (Planck Collaboration et al. 2014) and would suggest that these ALMA observations are resolving out approximately half the flux, which would be extended on scales >4″.. Our ALMA detection is consistent with the Planck 357 GHz non-detection, which reported an upper limit of ∼200 mJy (Planck Collaboration et al. 2014). For an additional estimate of the total 333 GHz continuum emission we fit the Herschel PACS and SPIRE photometry (J. Chu et al. 2016, in preparation) with a single-component modified blackbody. We fix the dust emissivity to β=1.8 (e.g., Planck Collaboration et al. 2011). and derive a best-fit temperature, TBB= 33±0.5 K.18 Using this modified blackbody fit we predict a 333 GHz flux of ∼190 mJy (Figure 10, top). If this extrapolation is correct, it suggests were are resolving out up to ∼50% of the 333 GHz flux with our ALMA observations. This missing flux should be extended on scales >4″ (>2.6 kpc; the scale on which our observations will be affected by spatial filtering) and <36 2 (<23.7 kpc; the SPIRE beam at 500 μm), since we are using galaxy-integrated values.19 This deficit of flux corresponds to an additional MISM≈3.2×10¹⁰ Me (following the Scoville et al. 2014 empirical relation). Taking 4″ as a lower-limit on the scale for all of the missing flux, this implies the ΣISM of any missing, extended component must be <109 Me kpc−2. This is at least a factor of 10 lower than the mass determined for the inner kpc, so our estimate of SISM,1 kpc is unlikely to be strongly biased by missing continuum flux, and uncertainties our estimates of the ISM mass surface density are likely dominated by the scatter in the MISM –L 850 m m relation.. Using the Herschel-derived temperature and the extrapolated flux, the dust mass would be Mdust,extrapolated = 8.2 ´ 108 Me. Assuming a gas-to-dust ratio of 100 implies an ISM mass of MISM,extrapolated = 8 ´ 1010 Me, a factor of 2.6 higher than inferred from our ALMA observations. The dust temperature inferred from the Herschel photometry (34 K) is lower than that obtained from the modeling of H2O lines (40 K). This is likely due to the fact that the H2O lines are tracing the denser molecular gas while the Herschel continuum measurements with a larger beam and fewer spatial filtering issues likely include emission from cooler, diffuse dust. To further explore this, we also fit the Herschel measurements with a two-component model, consisting of a 40 K modified blackbody normalized to our measured ALMA flux and a second modified blackbody with the temperature and normalization left as free parameters. For both components, we left β fixed to 1.8. This two-component model predicts a. 18. Errors obtained using MCMC exploration with the emcee package (Foreman-Mackey et al. 2013) and represent the 1σ range. 19 We note that IRAS 13120–5453 is unresolved in all the Herschel PACS and SPIRE bands, including the 70 μm band, which has a resolution of 5 6 (3.7 kpc).. 12.
(13) The Astrophysical Journal, 835:213 (17pp), 2017 February 1. Privon et al.. 333 GHz flux of ∼210 mJy (Figure 10, bottom), similar to that of the single-component model and roughly consistent with the Planck upper limit. The best-fit temperature of the second blackbody component is 26 K. This is consistent with dust temperatures for normal galaxies (e.g., Skibba et al. 2011). Because the 40 K blackbody was normalized to the integrated ALMA flux, the excess flux from the 26 K blackbody, if present and resolved out by our ALMA observations, should be extended on scales >4″. This two-component model is thus consistent with a scenario in which (U)LIRGs have concentrated nuclear starbursts which are surrounded by less intense star formation that more closely resembles normal galaxies. This is consistent with the results of Díaz-Santos et al. (2014), who found the extended [C II] emission of IR-selected galaxies to be similar to normal starforming galaxies, even if the nuclear starbursts show pronounced [C II] deficits. In the Díaz-Santos et al. (2014) sample, this extended star formation was detected on scales of 1–12.6 kpc, and thus the scale of this diffuse star formation is comparable to the physical scale of any flux resolved out by our ALMA observations (2.6 kpc). We note that the 40 K blackbody, anchored to the ALMA data-point, falls below the observed 14 μm flux (Inami et al. 2013), meaning an additional higher-temperature component would be needed to fit the mid-infrared portion of the SED, though the same is true for the single-component T=34 K fit to the Herschel data. We prefer the two-component fit to the Herschel bands over the single-component fit owing to its more realistic representation of the likely physical origin of the thermal dust emission in IRAS 13120–5453. The 40 K component dominates the IR luminosity of the system (Figure 10, bottom), thus we conclude the 333 GHz emission is a reasonable proxy for the distribution of the nuclear starburst containing ∼80% of LIR and that the size offers a reliable way to estimate ΣIR. Continuum observations at ∼333 GHz with a single-dish telescope or ALMA in a compact configuration would provide a reliable measurement of the total flux at this frequency and a definitive statement on how much flux is resolved out with our observations. In addition, ALMA observations would afford a measure of distribution of any flux missing in these observations.. enhancements (Privon et al. 2015). While we cannot model the conditions of the dense molecular gas in IRAS 13120–5453 with the limited set of lines presented here, exploratory LVG modeling has suggested enhanced HCN abundances may be required to explain the observed HCN/HCO+ ratio over the nucleus. Several recent studies have proposed mechanical heating can explain HCN enhancements (Loenen et al. 2008; Kazandjian et al. 2012; Izumi et al. 2016); can mechanical heating explain this abundance enhancement in IRAS 13120–5453? We can use the measured star formation properties to estimate the supernova rate and the associated mechanical heating rate in the starburst of IRAS 13120–5453. The star formation rate of 170 Me yr−1 implies a supernova rate of approximately 1.2 yr−1 (for a Salpeter IMF; Mattila & Meikle 2001), and an associated injection of mechanical energy via shocks. This star formation rate is mostly contained within the region of elevated HCN/HCO+. We similarly expect the supernovae to be concentrated within this region and so associated with the elevated HCN emission. Using 40% of the supernova rate estimated above (to match the fraction of LIR expected to be contained within the starburst FWHM) and the size of the starburst from the millimeter continuum emission (dSB=500 pc; Section 6), and Equation (1) from Kazandjian et al. (2012), we estimate the mechanical energy injection from supernovae to be Γmech>8×10⁻²¹ erg s−1 cm−3, for a PDR volume filling factor of 0.1. At this level of Γmech and above, the Kazandjian et al. (2012) models of mechanical heating in molecular clouds show substantial abundance enhancements of HCN relative to HCO+ (3–300×) and are sufficient to explain the ratios we see here, and are consistent with our exploratory LVG modeling. Significant non-gravitational motion of the gas would also serve to increase the turbulence in the dense gas disk, which has σ100 km s−1 (Figure 8). We also note that the observed outflow/wind, can also result in mechanical heating (e.g., Izumi et al. 2016), so the molecular wind seen here and by Veilleux et al. (2013) may further increase the mechanical heating rate above that from the supernovae. The majority of systems with substantial [C II] deficits observed by González-Alfonso et al. (2015) show evidence for strong OH 65 μm absorption; IRAS 13120–5453 is an outlier in this respect, with a significant [C II] deficit but no observed OH 65 μm absorption. González-Alfonso et al. (2015) argue this OH 65 μm absorption requires warm dust (T>50 K) and high column densities (NH6×1023 cm−2). Thus, the lack of OH 65 μm absorption suggests the dust is cooler and/or the column densities are somewhat low, consistent with the nondetection of H2O lines above 400 K, the modeling results for the H2O lines (Section 4), and the non-detection of the v2=1f HCN (4–3) line. The dust temperature of 40 K obtained from modeling of the H2O lines is consistent with the non-detection of OH 65 μm absorption. The general role of infrared pumping in enhancing v2=0 lines is still uncertain, but our non-detection of the v2=1f HCN (4–3) line and the non-detection of OH65 suggest that the starburst in IRAS 13120–5453 is too cool and/or has insufficient column density for HCN to absorb significant numbers of IR photons. Though not conclusive, this suggests that radiative pumping is not a significant contributor to the enhanced HCN emission.. 7. The Dense Molecular Gas and the Nuclear Activity in IRAS 13120–5453 The submillimeter continuum emission tracing the starburst has a diameter of ∼500 pc (FWHM from the Gaussian fit). This area of the starburst is associated with an elevated HCN (4–3)/ HCO+ (4–3) ratio, and there is tentative evidence for a dense molecular wind. What do these observations imply about the molecular gas properties and the nuclear activity in IRAS 13120–5453? 7.1. The Excitation of the Dense Molecular Gas Of the physical processes discussed in Section 1.1 that could plausibly lead to enhanced HCN/HCO+ emission, radiative pumping seems unlikely due to the lack of detectable HCN v2=1f emission. Previous studies of global HCN/HCO+ ratios in IR galaxies have found limited evidence to support XDRs as the driver of enhanced HCN emission (Costagliola et al. 2011; Privon et al. 2015), and source compactness (traced by [C II]/LFIR) is only weakly correlated with HCN 13.
(14) The Astrophysical Journal, 835:213 (17pp), 2017 February 1. Privon et al. +. These observations and associated studies of IRAS 13120–5453 are consistent with a scenario in which the molecular gas is primarily experiencing collisional excitation with the enhanced HCN emission originating from an elevated abundance caused by mechanical heating from the ongoing starburst. Confirmation of the abundance enhancement in the nucleus of IRAS 13120–5453 will require new multi-transition HCN and HCO+ maps to facilitate more detailed LVG modeling. In contrast to the nuclear regions, the extended regions (300 pc) of the molecular emission have HCN/HCO+≈1. Thus, it appears that the more extended molecular emission is consistent with typical PDR environments in star-forming galaxies.. Mrk231, where the HCN, HCO , and HNC species do not appear to be co-spatial, but instead reflect an outflow with significant abundance variations in the wind (Lindberg et al. 2016), suggesting significant chemical effects which need to be considered for the appropriate interpretation of these molecules in outflows. Within the substantial uncertainties in our mass outflow rate and the important consideration that we are only diagnosing the dense component of the outflow, the observations are broadly consistent with either an AGN or starburst-driven wind. CO observations (K. Sliwa 2016, in preparation) will be needed to both confirm the molecular outflow, estimate the total molecular outflow rate, and the dense fraction. The outflow kinematics relative to the disk may shed some light on the origin of the outflow. A starburst-driven outflow would be expected to exit perpendicular to the disk (e.g., García-Burillo et al. 2001; Walter et al. 2002; Bolatto et al. 2013a), as the path of least resistance. In this case, there should be a ∼90° shift in the PA of the disk, compared to the PA of the outflow. The HCN line wings in IRAS 13120–5453 have a similar PA to that of the disk (Figure 5) suggesting the wind is not exiting perpendicular to the disk. However, AGN outflows may be more collimated by the small-scale accretion disk and/ or torus. This small-scale collimation may have a random orientation with respect to the kpc-scale disk, so an AGNdriven outflow may be a more natural explanation for the wind identified here. IRAS 13120–5453 was detected in OH 119 μm absorption using Herschel observations (Veilleux et al. 2013), with maximum outflow velocities of up to 1200 km s−1. The OH outflow extends to significantly higher velocities than seen in the ALMA data. It is unclear if the outflow in this system is similar to the multi-phase outflow seen in Mrk231 (Aalto et al. 2015b), where the HCN outflow corresponds to the lowervelocity OH outflow component, while the higher-velocity OH outflow does not have a corresponding HCN outflow. The velocity difference between OH and HCN outflow is broadly consistent with a fast, diffuse outflow (seen in OH) that is entraining dense clouds at lower velocity. HCN (4–3) emission associated with the lower-velocity portion of a CO-detected molecular outflow has been detected in Mrk231 (Aalto et al. 2012a, 2015b), NGC1068 (GarcíaBurillo et al. 2014), and M51 (Matsushita et al. 2015). The outflows are thought to be jet-driven (M51) or AGN-driven (Mrk 231, NGC 1068) based on the energetics or the inferred mass outflow rates. In these cases and in IRAS 13120–5453, the material identified as outflowing has a high HCN/HCO+ ratio and is consistent with expectations from mechanical heating (e.g., Matsushita et al. 2015; Lindberg et al. 2016).. 7.2. The Origin and Fate of the Dense Molecular Wind Will this dense outflow escape the Galaxy or is it doomed to return to the nucleus? Using the dynamical mass obtained in Section 5 for the inner kpc, the escape velocity at 1 kpc is (GM/R)0.5∼600 km s−1. The outflow velocities we see in the dense molecular gas reach a maximum of ∼300 km s−1 (Figure 5). Thus, it appears that these winds will be unable to escape the nucleus unless the outflow axis is highly inclined along the line of sight (θ35°), reducing the projected radial velocity component. This observed wind, or at least its dense molecular component, appears destined to stall and remain bound to the system. Dense gas conversion factors have been determined for “normal” galaxies, under the assumption that the emission is coming from an ensemble of distinct clouds (Gao & Solomon 2004b). Estimating the mass outflow rate of dense material in IRAS 13120–5453 is problematic given the uncertain excitation and abundance of these dense gas tracers, as discussed above. Additionally, the ensemble of clouds assumption may not be appropriate for the nuclear ISM in ULIRGs, where the molecular gas may have a more smooth distribution (e.g., Solomon et al. 1997; Scoville et al. 2014). However, we can provide an upper limit to the dense mass outflow rate, by using the ensemble of clouds approximation. If we assume the emission is optically thick and thermalized up to the 4–3 line, the equivalent 1–0 luminosity of the outflow will equal that of ¢ (1 – 0) = L HCN ¢ (4 – 3) = 2 ´ 107 K km s−1 pc2. the 4–3 line: L HCN This would correspond to a dense molecular mass of 2×10⁸ Me in the outflow. Taking this upper limit on the outflowing dense gas mass we can compute the mass outflow rate, following Equation(1) of Cicone et al. (2014) and using the measured outflow extent of r=0.2 kpc and outflow velocity of 250 km s−1. We obtain an upper limit on the mass of outflowing dense molecular gas of M˙ dense < 770 Me yr−1, significantly in excess of the 170 Me yr−1 SFR. Because the outflow appears to follow the rotation pattern (but lie above the flattening of the rotation curve), the velocity of the material identified as outflowing may have an important rotational component to its velocity, which would reduce the inferred Ṁ . We emphasize here that the above calculations merely represent an upper limit to the mass of dense gas detected here and the actual mass could be at least order of magnitude lower (e.g., Aalto et al. 2015b). That the outflowing gas shows a high HCN/HCO+ ratio (>3) is strong evidence that the excitation and/or abundance is non-standard and that galactic conversion factors are unlikely to be accurate. An example of this is. 7.3. The Relationship between ΣIR and Σ14 Based on the sizes measured from the submillimeter continuum, we have inferred a high ΣIR, indicating the presence of a fairly extreme starburst. In contrast, computing Σ14 using the same size, we find a somewhat unremarkable luminosity surface density, relative to sources which feature IR pumping of HCN. Some insight into the apparent discrepancy can be gained by examining the ΣIR and Σ14 for an idealized singlecomponent blackbody. In particular, both quantities have different dependence on the temperature: ΣIR∝T4, and S14 µ (e h (21.4 THz) (kb T ) - 1)-1. In Figure 11 we show the 14.
Figure
+7


Documento similar