Towards the bridging of molecular genetics data across Xenopus species
10
0
0
Texto completo
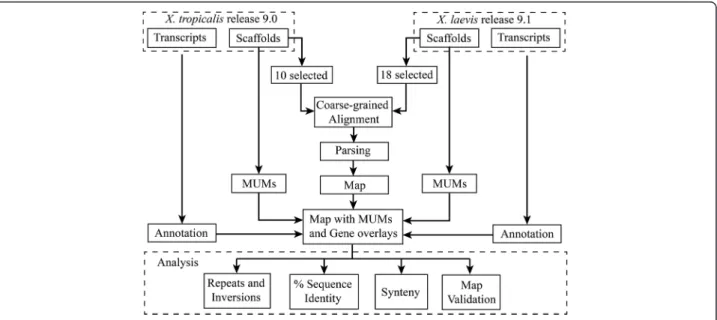
(2) Riadi et al. BMC Genomics (2016) 17:161. closely related diploid frog X. tropicalis has attempted to address this limitation [9]. X. tropicalis (also called Silurana tropicalis) is a diploid organism with 20 chromosomes and a 1.7Gbp long haploid genome. Currently, 84.81 % of the genome has been sequenced, consisting of 6,823 scaffolds in Xenbase release 9.0 (XTR9.0). The first and longest 10 scaffolds correspond to 74.88 % of contiguous sequences of the 10 haploid chromosomes in the X. tropicalis genome. This organism has 26,550 transcript sequences (XTR9.0). The easy molecular tractability of genomic features of X. tropicalis [9] has allowed integration of some genetic, biochemical, phenotypic and evolutionary data [10–14] in these two species. However, correspondence is not always expected between genomic data in X. tropicalis and the duplicated and divergent genome of X. laevis [15]. In the case there is correspondence, establishing it at a genome level is required. This cannot be done without a physical map between both genomes. No comprehensive comparative analyses using genomic sequencing mapping have been conducted for X. laevis and X. tropicalis [16]. Aiming at facilitating such analysis, we have set out to build a comparative coarse-grained physical map between these two species. To this end, we aligned the 18 chromosomes from X. laevis assembly XLA9.1 to the 10 chromosomes from X. tropicalis assembly XTR9.0 and estimated percentage of sequence identity, repetitions, inversions and synteny of mapped genes between the two species. Finally, we validated the map theoretically through the synteny of Maximal Unique Matches (MUMs). As a whole, our results convey the suitability of this newly assembled map for comparative studies between these two species, bridging a long-standing gap for the integration of biochemical, genetic and genomics data in Xenopus.. Page 2 of 10. Results In this work we have performed a comparative analysis between the two frog genomes after mapping by a coarsegrain alignment method the chromosome sequences of X. laevis on the chromosome sequences from X. tropicalis and semi automatic annotation of their transcripts (Fig. 1) to complement the map information. The analyses include a validation of the map, estimations of percentage of sequence identity, repetitions, inversions and synteny between the two genomes. The map. As X. laevis genome is around 1.8 times the length of X. tropicalis genome, 1.8 is also the expected rate of added lengths of the blocks aligned between the two species. This rate depends on the alignment drop-off score, X, chosen. A resulting rate larger than 1.8 suggests a loose alignment. On the other hand, a resulting rate smaller than 1.8 suggests a strict alignment. The drop-off score X = 35,000 rendered an average alignment length rate of 1.77, which is close to the expected rate (Table 1). However, the rate between the lengths of the chromosomes from X. laevis respect to X. tropicalis is 2.15, larger than expected. A coarse-grained dotplot alignment between X. laevis scaffolds and each X. tropicalis chromosome scaffold shows graphically part of the information in Table 1 (Fig. 2). Although the alignments seem to be contiguous, overall 27.1 % of X. tropicalis chromosomes did not align to X. laevis chromosomes. In supplement to this figure, the proportion of X. tropicalis chromosomes covered by X. laevis was 72.9 % (Table 1). This proportion, combined with the completion of 84.81 % of the X. tropicalis genome (Additional file 1), results that 61.8 % of X. tropicalis whole genome is actually aligned by X. laevis blocks. A. Fig. 1 A chart summarizing the workflow from the two Xenopus assemblies to the map and the analyses.
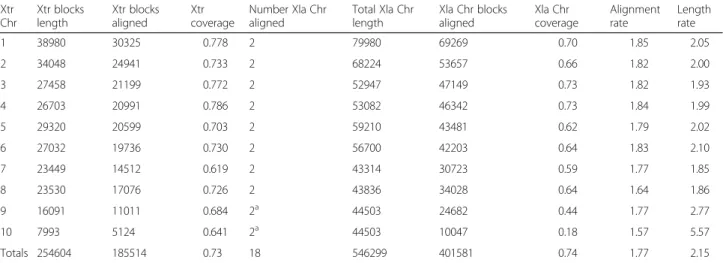
(3) Riadi et al. BMC Genomics (2016) 17:161. Page 3 of 10. Table 1 Summary of the coarse-grained map between 18 XLA9.1 chromosomes (L and S) on 10 XTR9.0 chromosomes. The length units are in blocks. Each block corresponds to a sequence of length 5 Kbp. Xtr (X. tropicalis); Xla (X. laevis); Chr (Chromosome) Xtr Chr. Xtr blocks length. Xtr blocks aligned. 1. 38980. 30325. 2. 34048. 24941. 3. 27458. 4. 26703. 5 6. Xtr coverage. Number Xla Chr aligned. Total Xla Chr length. Xla Chr blocks aligned. Xla Chr coverage. Alignment rate. Length rate. 0.778. 2. 79980. 69269. 0.70. 1.85. 2.05. 0.733. 2. 68224. 53657. 0.66. 1.82. 2.00. 21199. 0.772. 2. 52947. 47149. 0.73. 1.82. 1.93. 20991. 0.786. 2. 53082. 46342. 0.73. 1.84. 1.99. 29320. 20599. 0.703. 2. 59210. 43481. 0.62. 1.79. 2.02. 27032. 19736. 0.730. 2. 56700. 42203. 0.64. 1.83. 2.10. 7. 23449. 14512. 0.619. 2. 43314. 30723. 0.59. 1.77. 1.85. 8. 23530. 17076. 0.726. 2. 43836. 34028. 0.64. 1.64. 1.86. a. 9. 16091. 11011. 0.684. 2. 44503. 24682. 0.44. 1.77. 2.77. 10. 7993. 5124. 0.641. 2a. 44503. 10047. 0.18. 1.57. 5.57. 185514. 0.73. 18. 546299. 401581. 0.74. 1.77. 2.15. Totals 254604. In X. laevis, chromosomes 9 and 10 from X. tropicalis become fused and duplicated. They were named Chr9_10L and Chr9_10S chromosomes in XLA9.1. The same set was aligned to X. tropicalis chromosome 9 and chromosome 10. a. similar coverage of 65.5 % was obtained for X. laevis chromosomes (Table 1). Conservation between X. tropicalis and X. laevis. As the resulting alignment depends on the drop-off value used, we aligned all X. laevis scaffolds against all X. tropicalis chromosomes at 24 increasing drop-off score values (35,000-150,000 with a pace of 5,000) (Fig. 3). The block positions that appear with no conservation are either not aligned or have a score lower than 35,000, in which case cannot be distinguished from chance. The maximum drop-off score at which a pair of blocks can be aligned correlates directly with percentage of sequence identity between aligned sequences. However, as the variance of the percentage of sequence identity per drop-off score value is significant, the percentage of sequence identity cannot be reliably predicted from the drop-off score. In. spite of this, the maximum drop-off score at which a pair of blocks is aligned can be used as a measure of conservation. From each chromosome, a histogram of maximum drop-off scores or conservation scores was generated and the coverage of alignment for each drop-off was calculated. The average maximum Cgaln drop-off score between the aligning zones of the genomes is 67,703.32 (Fig. 3). Possibly, the histogram of maximum drop-off scores shows a larger than expected proportion of conserved blocks with score of 150,000, as that bin accumulates all blocks with drop-off score 150,000 or higher. Chromosome 10 is the shortest chromosome, and the one that has the lowest average conservation (Fig. 3) and lowest alignment coverage (Table 1). In order, from highest to lowest average conservation we have X. tropicalis chromosomes: 4, 3, 1, 8, 6, 2, 9, 7 and 10 (averaging through all the chromosome sequence, including the non aligned. Fig. 2 Dotplot alignments of each XLA9.1 L and S chromosomes (y axis) to each XTR9.0 chromosome (x axis). A red dot represents a block alignment between X. laevis and X. tropicalis chromosomes. The alignments are not at the same scale.
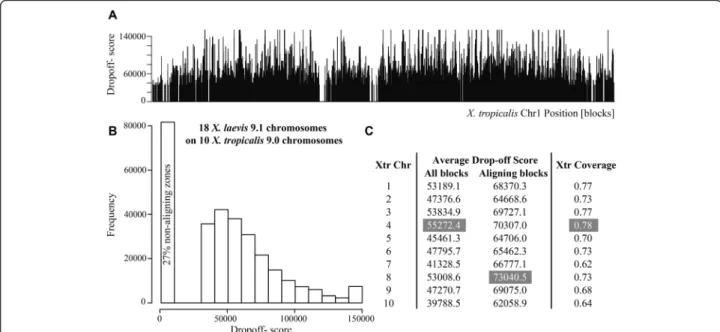
(4) Riadi et al. BMC Genomics (2016) 17:161. Page 4 of 10. Fig. 3 Maximum drop-off scores chart of X. laevis blocks on X. tropicalis. a bar-plot of the maximum drop-off score, X, per block position for chromosome 1. b Histogram of drop-off scores. c Table with the average maximum drop-off scores per chromosome calculated using all blocks, only the aligning blocks, and the coverage of the aligning blocks on X. tropicalis. The cells in grey show the most conserved chromosomes according each column. regions). This chromosome conservation order changes to 8, 4, 3, 9, 1, 7, 6, 5 and 10 if the averaging only takes into account the aligning blocks.. Inversions represent 7 % and 3 % of the aligned portion of X. tropicalis or X. laevis genomes, respectively (Table 2). Validation of the map. Repetitions and inversions. As X. laevis genome is the result of whole genome duplication event, it is expected that 1.8 X. laevis blocks will align each X. tropicalis block. Therefore, a block of nucleotides cannot simply be regarded as a block that happens more than once in a genome. Three particular cases have to be taken in account: a block from X. tropicalis that aligns to X. laevis is considered a repeat when (i) it is an additional block to an already-aligned first block at one particular scaffold; (ii) it belongs to a third scaffold in addition to two previous aligned scaffolds or; (iii) it is a combination of the former two cases. In this map, a total of 11.8Mbp from X. tropicalis are repeated in 26.6Mbp in the X. laevis aligned genome (Additional file 2). Inversions are identified only for colonies, i.e., with at least two consecutive aligning blocks [24]. For colonies, a previous check on the scaffold frame is made, as in Cgaln only the best out of the 6 reading frames of each X. laevis scaffold is aligned. An inversion is identified when Cgaln takes the plus frame of the X. laevis chromosome and a colony is aligned in reverse respect to the X. tropicalis chromosome. Because only colonies in reverse can be identified, the inversions counted are an underestimation of the total number of existing inversions. Taking into account this limitation, we estimated at least 64.6Mbp to be inverted between the two genomes.. In order to validate the map between X. laevis and X. tropicalis, we computed a set of common theoretical probes called Maximal Unique Matches (MUMs, see Methods) between the two genomes and compared their correlative order in the map. The MUMs generated were identical between species and 250 nt or longer. The distribution of distances between the corresponding positions in the map for the MUMs gives a measure of how well the correspondence between the genomes was achieved. The generated list of MUMs has 1,140 sequences. From those, 1,092 were mapped on the ten X. tropicalis chromosomes and 695 were mapped on the X. laevis scaffolds; 673 MUMs, representing 59.0 % of the total, are common and mapped to both species. This number is less than expected as it is lower than the proportion of the X. laevis genome mapped. Additionally, 661, or 98.2 % of the mapped MUMs on X. laevis are at a distance of ≤5Kbp from the corresponding MUM in X. tropicalis. One block, or 5Kbp, is the resolution of the map. Therefore, we estimate that the correspondence between the two sets of scaffolds was achieved in 98.2 % of the map. Application of the map: Conserved synteny and gene rearrangements. To calculate conserved synteny, a set of orthologous genes between two species is required. 7,910 orthologous.
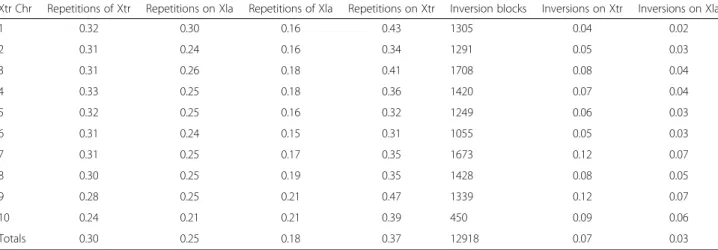
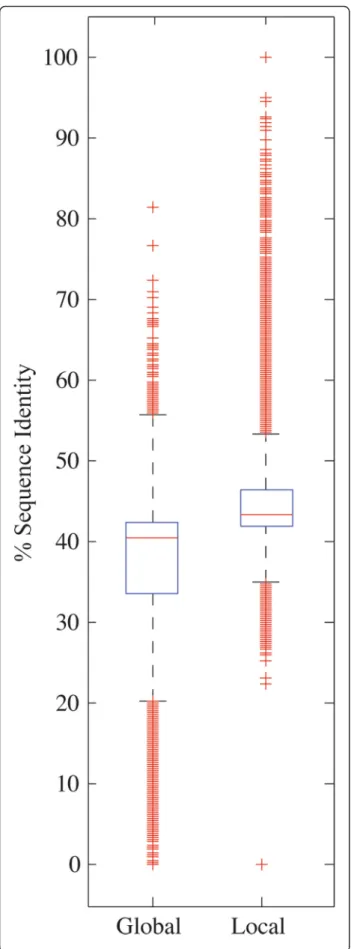
(5) Riadi et al. BMC Genomics (2016) 17:161. Page 5 of 10. Table 2 Summary of repetitions (repeated blocks) and inversions in the coarse-grained map between 18 XLA9.1 chromosomes on 10 XTR9.0 chromosomes. Columns 2 to 5 are sub estimates of the number of repeated blocks from each genome that align on the other genome. Columns 6 to 8 are sub estimates of inversions between the genomes Xtr Chr. Repetitions of Xtr. Repetitions on Xla. Repetitions of Xla. Repetitions on Xtr. Inversions on Xtr. Inversions on Xla. 1. 0.32. 0.30. 0.16. 0.43. 1305. 0.04. 0.02. 2. 0.31. 0.24. 0.16. 0.34. 1291. 0.05. 0.03. 3. 0.31. 0.26. 0.18. 0.41. 1708. 0.08. 0.04. 4. 0.33. 0.25. 0.18. 0.36. 1420. 0.07. 0.04. 5. 0.32. 0.25. 0.16. 0.32. 1249. 0.06. 0.03. 6. 0.31. 0.24. 0.15. 0.31. 1055. 0.05. 0.03. 7. 0.31. 0.25. 0.17. 0.35. 1673. 0.12. 0.07. 8. 0.30. 0.25. 0.19. 0.35. 1428. 0.08. 0.05. 9. 0.28. 0.25. 0.21. 0.47. 1339. 0.12. 0.07. 10. 0.24. 0.21. 0.21. 0.39. 450. 0.09. 0.06. Totals. 0.30. 0.25. 0.18. 0.37. 12918. 0.07. 0.03. genes were found through bidirectional-best-hit using blastn. A subset of these, 7,218 genes, map on the X. tropicalis 10 chromosomes. Out of all X. laevis transcripts, only 9,269 map on X. tropicalis chromosomes (Table 3). From these, 2,112 are orthologous genes and present in at least pairs of consecutive orthologous genes mapped in the same X. laevis chromosome. This set was our orthologous genes sample for synteny estimation. We found that 2,105 orthologous genes, or 99.6 % of the sample, are syntenic between the two species. Because the intergenic distance is one of the main determinants of order conservation [17], three distances were measured between pairs of orthologous genes (Fig. 4): 1) Distance between two consecutive genes in X. laevis; 2) distance between two consecutive genes in X. tropicalis and; 3) distance between X. laevis start block position projected on X. tropicalis and its orthologous gene start block. The relative error of the distance between two consecutive genes in X. laevis respect to X. tropicalis was calculated with the first two distances. The mean relative Table 3 Distribution of XLA9.1 transcripts according to its mapping on XTR9.0 chromosomes assembly. A transcript is considered partially aligned if only one of the blocks, either the one including the start or the stop position, is aligned. A transcript does not align on X. tropicalis if neither of the blocks that include start or stop positions, is aligned Category. Number of transcripts. Mapped on Xtr. 9,269. Inversion blocks. error was 4.5 %. This means that regardless the absolute distance between two consecutive orthologous genes in X. tropicalis, the corresponding consecutive genes in X. laevis are, in average, ± 4.5 % of that distance apart. 71.1 % of the orthologous pairs of genes are in the corresponding block position according to the map. In the case of the distribution for the third measured distance, it was found that orthologous genes are mapped, in average 9Kbp, and that 95 % of the orthologous genes are at most 55Kbp apart. For comparison, the confidence interval of lengths, at 95 %, of Xenopus genes are between 5 and 15Kbp. Percentage sequence identity between the two species. Based on the calculated mapping between the two species, and to assess more precisely the sequence conservation, a random sample containing 100Mbp of matching blocks were aligned by using the global Needleman-Wunsch and local Smith-Waterman dynamic programming algorithms. The aim was to estimate, respectively, upper and lower references of the sequence identity between the two Xenopus species. For the two types of alignments, median percentage sequence identities are similar, both per chromosome and in total (Table 4). The distributions for global and local alignment overlap (Fig. 5). The medians are 40.9 and 43 %, respectively. In average, the percentage sequence identity shared by the two species ranges between 37.44, for global, and 44.08 %, for local alignments.. Percentage [%] 20.5. Not in mapped Xla chrs. 4,493. 10.0. Partially align on Xtr. 6,567. 14.5. Do not align on Xtr. 24,770. 55.0. Total. 45,099. 100.0. Discussion In this work we have used X. tropicalis first 10 scaffolds (XTR9.0) as reference for the coarse-grained mapping of the 18 largest X. laevis scaffolds (XLA9.1). Using this strategy, we were not only able to map the genes and calculate the conserved synteny of orthologs between.
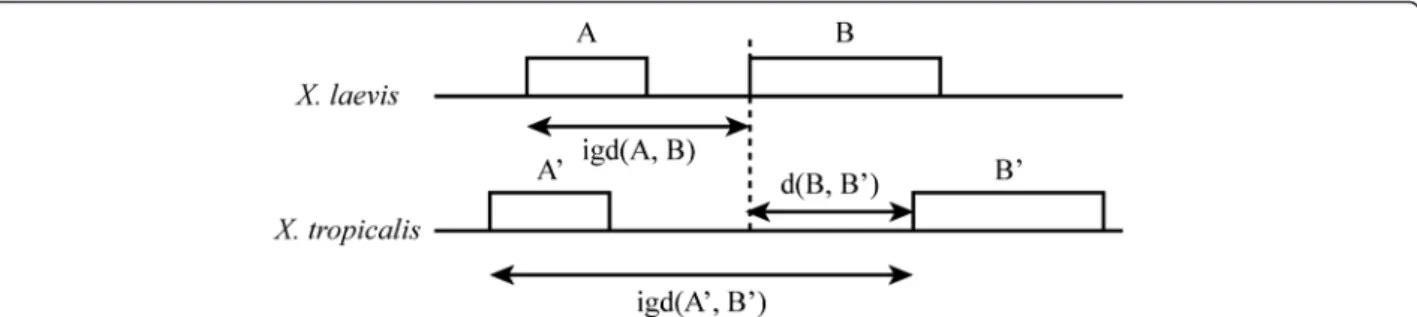
(6) Riadi et al. BMC Genomics (2016) 17:161. Page 6 of 10. Fig. 4 Three distances measured between the consecutive genes in X. laevis (XLA9.1), A and B as intergenic-distance, igd(A, B); between two consecutive genes in X. tropicalis (XTR9.0), A’ and B’ as igd(A’, B’) and; the distance between orthologous genes in both genomes d(B, B’). these two species but also estimate the percentage of global identity, inversions and repetitions. Taken together, this newly assembled map represents a useful tool for the integration between biochemical, physiological, genetic and genomics data between X. laevis and X. tropicalis. The map. The expected alignment rate is around 1.8 considering the rate of genome length between the two species. Our data show a similar alignment rate of 1.77. It was also expected the length rate between X. laevis respect to X. tropicalis, i.e., the rate between the length of the scaffolds that align, to be 1.8 but rather we calculated a length rate of 2.15. It is possible that this difference either reflects evolutionary features such as genome rearrangements, translocations, deletions and fusions [18], or are associated with assembly artifacts. The gaps in Xenopus genomes impinge on mapping and gene identification [19]. About 89.2 % of X. tropicalis and 84.8 % of X. laevis genomes were used for the Table 4 Statistics of sequence identity between XLA9.1 and XTR9.0 genome assemblies. The sampling size of couples of aligned blocks between X. tropicalis and X. laevis was 20,000 (or 100Mbp) for all chromosomes XtrChr. Average [%]. Median [%]. St.Dev [%]. Global. Local. Global. Local. Global. Local. 1. 36.83. 45.06. 40.10. 43.70. 9.58. 7.68. 2. 37.24. 45.56. 40.40. 44.00. 9.37. 7.55. 3. 37.48. 45.42. 40.40. 43.70. 8.94. 6.99. 4. 36.79. 44.92. 40.60. 43.40. 9.63. 7.45. 5. 37.58. 43.76. 41.00. 43.10. 8.90. 7.00. 6. 37.95. 43.71. 41.53. 43.10. 8.48. 6.01. 7. 37.53. 44.52. 40.90. 43.20. 8.87. 7.31. 8. 37.00. 44.88. 40.60. 43.50. 9.69. 8.23. 9. 38.24. 42.30. 41.40. 42.50. 8.30. 5.66. 10. 37.76. 40.69. 41.00. 41.90. 8.45. 6.22. All. 37.44. 44.08. 40.90. 43.00. 9.04. 7.20. mapping. If we assume that the two genomes are two random sequences of the same size, it is expected that 0.892 x 0.848 = 75.6 % of X. tropicalis genome actually aligns. The alignment coverages in X. tropicalis and X. laevis genomes is 61.8 and 65.5 %, respectively, lower than expected. The non-aligned blocks, or misalignments, may be due to recombination, deletion or insertion of sequences in both species [20]. Whole genome duplication is known to cause recombination and pseudogenization among other adaptive processes [21]. The rearrangements that happened in segments either smaller than 5Kbp in one single block or ≥5Kbp and ≤10Kbp combined in two consecutive blocks might not align with a score over the drop-off score in Cgaln. Repetitions and inversions. The meaning of the repetition figures is that 11.8Mbp from X. tropicalis, are aligned with 11.8Mbp in X. laevis, and blocks of 5Kbp in that sequences are repeated at least once in additional 26.6Mbp in the X. laevis. Regarding inversions, 64.6Mbp is the estimated length between the two species. However, this is an underestimate as the inversion identification relies on the colonies aligned, and these only represent a subset of the inversions. Inversions represent 7 % of the aligned portion of X. tropicalis genome and 3 % of the aligned portion of X. laevis genome. These figures depend on the assembly quality; therefore will probably change in the next releases of Xenopus assemblies (see Previous assembly releases, below). Inversions and repetitions are associated with evolutionary rearrangement events [22]. Each chromosome alignment (Fig. 2), assuming a correct assembly, reveals a few large rearrangements. In a few cases, for example in chromosome 6, chromosomes L and S show the same general pattern, which suggests that these rearrangements took place before the genome duplication event in the common ancestor between Xenopus species. In other cases, the differences between L and S chromosomes, for example chromosome 8, indicate a rearrangement after the genome duplication event. The alignments of L and S.
(7) Riadi et al. BMC Genomics (2016) 17:161. Page 7 of 10. Fig. 5 Boxplot of the global and local alignment sequence identities of the 20,000 samples of pairs of blocks from all chromosomes. The box in the boxplot concentrates 50 % of the data. The whiskers are 1.5x the length of the box. The red crosses represent outliers. chromosomes against X. tropicalis chromosomes 9 and 10 show the fusion point in X. laevis. The patterns suggest that the chromosomes fusion event took place before the genome duplication event. Often, the border regions of large rearrangements contain long repetitions in the order of 105 to 106 bp. Additional analysis of the border regions of these hypothetical rearrangements may confirm them, further validating the assembly.. Previous assembly releases. Assembly releases XTR8.0 and XLA7.1, available in 2014, were coarse-aligned and analyzed using the same methodology described in this work. The sequences aligned included the largest 3,169 from XLA7.1 and the largest 10 scaffolds from XTR8.0, which constitute around 80 % of each genome. The map had an overall coverage of about 50 % of both genome sequences (compare to 62–65.5 % of genome sequence coverage in this work). This suggests that new assembly releases may change alignment coverage significantly. The estimation of inversions was 58 %, largely due to the lack of contiguity of XLA7.1 assembly. Other map features, like alignment rate, repetitions, percentage of sequence identity and gene synteny estimated between the genomes, as expected, confirm the results drawn with releases XTR9.0 and XLA9.1, used in this work. Additional map validation was performed using FISH results from [16]. As the updated versions XLA9.1 and XTR9.0 were already refined by fluorescence in situ hybridization (FISH) experiments [6], such validation was not needed in this study.. Conclusions Overall, our results indicate that the final map aligns between 62 and 65.5 % of X. tropicalis and X. laevis total genome length despite the fact that the two species are close to be completely sequenced. The current map allowed an estimation of genome sequence identity between these species (37-44 %); the location of 9,269 genes of X. laevis and 20,323 genes in X. tropicalis, (7,218 orthologous), the automatic annotation of the transcripts of both species, and the calculation of the conserved synteny between the two frog species verifying the correspondent positions of 2,105 pairs of orthologous genes (99.6 %), making this a useful source for future comparative studies between X. laevis and X. tropicalis..
(8) Riadi et al. BMC Genomics (2016) 17:161. Methods Scaffold sets used and selected for alignment. Both Xenopus species scaffolds sets were downloaded from Xenbase FTP site [6, 23]. After downloading the sequenced data sets (X. laevis 9.1 and X. tropicalis 9.0), we charted a superior accumulative distribution ordered by length for each organism (Additional file 1). Coarsegrained alignment is able to align a pair of large sequences, saving computational resources, by dividing the sequences into blocks of nucleotides [24]. We chose the alignment block size to be 5Kbp, because this figure represented a good compromise between the diminishing number of X. laevis scaffolds and the increasing of loss of information in terms of base pairs (Additional file 1). 5Kbp is also, approximately, a lower boundary for the average size of a Xenopus gene. Based on this block size definition, the longest 18 and 10 scaffolds, were selected, making up 80,93 % and 74.88 % of the haploid genomes of X. laevis and X. tropicalis, respectively (Additional file 1). Parameters for coarse-grained alignment. Cgaln was chosen for coarse-grained alignment [24]. In a Cgaln charted output alignment, a dot represents an alignment between two blocks of nucleotides, and is generated if the alignment score is above a given dropoff threshold, determined as X in Cgaln parameters. The minimum drop-off score X was chosen to assure that single dots were not generated by chance. This critical X value was found by generating a large number of random pairs of nucleotide sequences of 5Kbp with different known % G + C content. Each pair was then aligned at increasing drop-off score (5,000-150,000 with a pace of 5,000), to find the minimum score over which the single dot from a random alignment is not generated. The minimum drop-off score was found to be X = 35,000. This strict criterion assures that single dots generated by Cgaln have in average 43 % of global sequence identity for 5Kbp block sequences (data not shown). Coarse-grained mapping of Xenopus laevis scaffolds over Xenopus tropicalis reference chromosomes. Cgaln starts by dividing the sequences in blocks of user defined size. We used blocks of 5Kbp. The steps of the alignment are similar to other programs and are three: Finding High-Scoring-Pairs (HSPs), Extension and Chaining HSPs. Just as two letters have a similarity score between them, for a pair of blocks a similarity score is calculated probabilistically using the number of common k-mers found. After a first identification of similar “block seeds”, the alignment is chained and extended. As the alignment extends, the gapped blocks penalize the total score. The alignment stops the extension when the score falls below a. Page 8 of 10. user defined drop-off score. The default drop-off score, X, is 5000. The output of an alignment is a file with a list of coordinate pairs, (x; y) of a dotplot, each one representing the alignment between two blocks of 5Kbp from the two species. In our case, the x-axis is the block position of the reference, X. tropicalis, and the y-axis is the block position of X. laevis scaffold. A continuous set of aligned blocks, at least two in sequence, is called colony. An alignment between two sequences may contain several colonies. Perl scripts were written to parse the output of Cgaln and identify by chromosome position blocks of X. laevis scaffolds aligned in X. tropicalis. The scripts also identify and count repetitions and inversions. Validation of the map. The map was validated through the determination of the set of identical and unique subsequences of maximal length between the two sets of scaffolds: Maximal Unique Matches or MUMs. The assumption is that the corresponding MUMs in the two species genomes should align or be located at a short distance in the map. MUMs can be used to test theoretically the overall synteny between the two genomes and can be recalculated in the upcoming releases of the assemblies, to be used in map validation. The list of MUMs was generated through Vmatch (http://www.vmatch.de/). First mkvtree, part of Vmatch, was used to generate an indexed database of X. tropicalis scaffolds sequences with options: −v dna -allout. Then, we used vmatch command on X. laevis scaffold sequences, using X. tropicalis database, to find the MUMs over 250 nt, between the two species. For that, we used with options –mum and –l 250. Finally, we merged the MUM positions with the rest of the map using a Perl script. Percentage of sequence identity estimation between the two species. The percentage of sequence identity between the two species was estimated by randomly sampling 20,000 pairs of blocks of 5Kbp, 2,000 per chromosome, derived from the alignment. Global and local alignments of the pairs were carried out with EMBOSS’ Needleman & Wunsh and Smith & Waterman algorithms implementations through the command lines needle and water [25], respectively. Determination of a strict orthologous gene subset. X. tropicalis has 26,550 annotated transcripts in release XTR9.0. X. laevis has 45,099 annotated transcripts in release XLA9.1. In order to determine a strict orthologous subset, a bidirectional-best-hit using blastn [26] was applied to the two species sets of all transcripts. The filtering criteria were >50 % of query sequence length coverage and >60 % sequence identity in the alignment..
(9) Riadi et al. BMC Genomics (2016) 17:161. Conserved synteny. There are several definitions [27] and methodologies described to calculate synteny [28]. In this work we used the conservation of similar gene orders in multiple genomic regions [29]. We estimated quantitatively the conserved synteny as the proportion of orthologous genes mapped on both species that are in the same order. The order was verified taking consecutive pairs of orthologous genes between the two species. The distance between the start blocks of the orthologous genes were recorded and, if the order was conserved in both species, it was counted as a syntenic pair. The sample size used was 2,112 because from the 7,910 orthologous genes, this was the number of genes that were accompanied by at least a second orthologous gene mapped in the same X. laevis chromosome. Annotation of transcripts. A semi automatic pipeline was used to annotate the transcripts from the two species in order to complement map information. The nucleotide sequences were translated into their 6 reading frames, and used as query in locally run BLAST against several sequence and domain databases such as TnpPred [30], CDD [31], COG [32], KOG [33], PDB [34], Pfam [35], PRK [36], SMART [37], TIGRFAMs [38], UniProt/Swiss-Prot [39]. The BLAST parameters configured include the use of low complexity sequence filtering (SEG) and discarded hits that had an e-value higher than 10−5 or less than 20 % of hit coverage. In the next step, the pipeline algorithm chose the best hit found for each mRNA from all the hits obtained from all the databases results. The algorithm considered the best BLAST values (e-value, score, sequence identity), but also assigned more weight to hits from better curated databases (e.g. TIGRFAMs hits weight more than UniRef90 hits), and assigned priority to informative gene product descriptions (e.g. a “glutamate decarboxylase” hit is preferred over a “hypothetical protein” hit). Finally, a table was printed with the relevant information of the annotation predictions (Additional file 3).. Additional files Additional file 1: Tables with accumulative superior distribution of scaffold lengths of X. tropicalis release XTR9.0 and X. laevis release XLA9.1 assemblies for comparison. (PPTX 763 kb) Additional file 2: Map of X. laevis, XLA9.1, 18 chromosomes on X. tropicalis, XTR9.0, 10 chromosomes. (XLSX 22301 kb) Additional file 3: Annotation of biological function of transcripts of XLA9.1 and XTR9.0. (ZIP 29029 kb). Abbreviations Cgaln: Coarse-grain alignment; FISH: Fluorescence In Situ Hybridization; Gbp: 109 base pairs; HSP: High Scoring Pairs; L: Long (chromosome from X. laevis); Mbp: 106 base pairs; MUM: Maximal Unique Match; S: Short (chromosome from X. laevis); X: Drop-off score; XLA#.#: Xenopus laevis genome assembly release #.#; XTR#.#: Xenopus tropicalis genome assembly release #.#.. Page 9 of 10. Competing interests We declare that none of the authors have conflicts of interest. Authors’ contributions GR conceived the study, acquired the data, devised and carried out the data processing, data analysis, participated in the interpretation and draft of the manuscript. FO programmed and run the semi-automatic pipeline for the annotation of transcripts of the two Xenopus species. JL contributed to data interpretation, critical revision of the manuscript and final approval of the manuscript. FM contributed to the design of experiments, data interpretation, drafting the manuscript and final approval of the manuscript. All authors have read and approved this manuscript. Acknowledgements This work was funded by FONDECYT grants #11140869, #3130441 and #3140005. We would also like to thank Dr. Janine H. Santos (National Institute of Environmental Health Sciences, Durham, NC, USA) and the reviewers for their useful comments and suggestions for the improvement of our work and the manuscript. Author details 1 Departamento de Genética Molecular y Microbiología, Facultad de Ciencias Biológicas, Pontificia Universidad Católica de Chile, Santiago, Chile. 2Centro de Bioinformática y Simulación Molecular, Facultad de Ingeniería, Universidad de Talca, Talca, Chile. 3Fundación Ciencia y Vida, Universidad Andrés Bello, Santiago, Chile. 4Center for Aging and Regeneration and Millennium Nucleus in Regenerative Biology, Santiago, Chile. Received: 25 August 2015 Accepted: 5 February 2016. References 1. Hellsten U, Harland RM, Gilchrist MJ, Hendrix D, Jurka J, Kapitonov V, Ovcharenko I, Putnam NH, Shu S, Taher L, Blitz IL, Blumberg B, Dichmann DS, Dubchak I, Amaya E, Detter JC, Fletcher R, Gerhard DS, Goodstein D, Graves T, Grigoriev IV, Grimwood J, Kawashima T, Lindquist E, Lucas SM, Mead PE, Mitros T, Ogino H, Ohta Y, Poliakov AV, et al. The genome of the Western clawed frog Xenopus tropicalis. Science. 2010;328:633–6. 2. Harland RM, Grainger RM. Xenopus research: metamorphosed by genetics and genomics. Trends Genet TIG. 2011;27:507–15. 3. Slack JMW, Lin G, Chen Y. The Xenopus tadpole: a new model for regeneration research. Cell Mol Life Sci CMLS. 2008;65:54–63. 4. Lee-Liu D, Edwards-Faret G, Tapia VS, Larraín J. Spinal cord regeneration: lessons for mammals from non-mammalian vertebrates. Genes. 2013;51:529–44. 5. Beck CW, Izpisúa Belmonte JC, Christen B. Beyond early development: Xenopus as an emerging model for the study of regenerative mechanisms. Dev Dyn Off Publ Am Assoc Anat. 2009;238:1226–48. 6. Karpinka JB, Fortriede JD, Burns KA, James-Zorn C, Ponferrada VG, Lee J, et al. Xenbase, the Xenopus model organism database; new virtualized system, data types and genomes. Nucleic Acids Res. 2015;43(Database issue):D756– 763. 7. Matsuda Y, Uno Y, Kondo M, Gilchrist MJ, Zorn AM, Rokhsar DS, et al. A new nomenclature of Xenopus laevis chromosomes based on the phylogenetic relationship to Silurana/Xenopus tropicalis. Cytogenet Genome Res. 2015;145:187–91. 8. Kwon T. Benchmarking transcriptome quantification methods for duplicated genes in Xenopus laevis. Cytogenet Genome Res. 2015;145:253–64. 9. Carruthers S, Stemple DL. Genetic and genomic prospects for Xenopus tropicalis research. Semin Cell Dev Biol. 2006;17:146–53. 10. Faunes F, Sanchez N, Moreno M, Olivares GH, Lee-Liu D, Almonacid L, Slater AW, Norambuena T, Taft RJ, Mattick JS, Melo F, Larrain J. Expression of transposable elements in neural tissues during Xenopus development. PloS One. 2011;6:e22569. 11. Yanai I, Peshkin L, Jorgensen P, Kirschner MW. Mapping gene expression in two Xenopus species: evolutionary constraints and developmental flexibility. Dev Cell. 2011;20:483–96. 12. Faunes F, Sanchez N, Castellanos J, Vergara IA, Melo F, Larrain J. Identification of novel transcripts with differential dorso-ventral expression in Xenopus gastrula using serial analysis of gene expression. Genome Biol. 2009;10:R15..
(10) Riadi et al. BMC Genomics (2016) 17:161. 13. Pollet N, Mazabraud A. Insights from Xenopus genomes. Genome Dyn. 2006;2:138–53. 14. Kashiwagi K, Kashiwagi A, Kurabayashi A, Hanada H, Nakajima K, Okada M, Takase M, Yaoita Y. Xenopus tropicalis: an ideal experimental animal in amphibia. Exp Anim Jpn Assoc Lab Anim Sci. 2010;59:395–405. 15. Krylov V, Kubickova S, Rubes J, Macha J, Tlapakova T, Seifertova E, Sebkova N. Preparation of Xenopus tropicalis whole chromosome painting probes using laser microdissection and reconstruction of X. laevis tetraploid karyotype by Zoo-FISH. Chromosome Res Int J Mol Supramol Evol Asp Chromosome Biol. 2010;18:431–9. 16. Uno Y, Nishida C, Takagi C, Ueno N, Matsuda Y. Homoeologous chromosomes of Xenopus laevis are highly conserved after whole-genome duplication. Heredity. 2013;111:430–6. 17. Poyatos JF, Hurst LD. The determinants of gene order conservation in yeasts. Genome Biol. 2007;8:R233. 18. Wells DE, Gutierrez L, Xu Z, Krylov V, Macha J, Blankenburg KP, Hitchens M, Bellot LJ, Spivey M, Stemple DL, Kowis A, Ye Y, Pasternak S, Owen J, Tran T, Slavikova R, Tumova L, Tlapakova T, Seifertova E, Scherer SE, Sater AK. A genetic map of Xenopus tropicalis. Dev Biol. 2011;354:1–8. 19. Gilchrist MJ. From expression cloning to gene modeling: The development of Xenopus gene sequence resources. Genes. 2012;50:143–54. 20. Mouse Genome Sequencing Consortium, Waterston RH, Lindblad-Toh K, Birney E, Rogers J, Abril JF, et al. Initial sequencing and comparative analysis of the mouse genome. Nature. 2002;420:520–62. 21. Evans BJ. Genome evolution and speciation genetics of clawed frogs (Xenopus and Silurana). Front Biosci J Virtual Libr. 2008;13:4687–706. 22. Carver EA, Stubbs L. Zooming in on the human–mouse comparative map: genome conservation re-examined on a high-resolution scale. Genome Res. 1997;7:1123–37. 23. James-Zorn C, Ponferrada VG, Jarabek CJ, Burns KA, Segerdell EJ, Lee J, Snyder K, Bhattacharyya B, Karpinka JB, Fortriede J, Bowes JB, Zorn AM, Vize PD. Xenbase: expansion and updates of the Xenopus model organism database. Nucleic Acids Res. 2013;41(Database issue):D865–870. 24. Nakato R, Gotoh O. Cgaln: fast and space-efficient whole-genome alignment. BMC Bioinformatics. 2010;11:224. 25. Rice P, Longden I, Bleasby A. EMBOSS: the European Molecular Biology Open Software Suite. Trends Genet TIG. 2000;16:276–7. 26. Altschul SF, Madden TL, Schaffer AA, Zhang J, Zhang Z, Miller W, Lipman DJ. Gapped BLAST and PSI-BLAST: a new generation of protein database search programs. Nucleic Acids Res. 1997;25:3389–402. 27. Passarge E, Horsthemke B, Farber RA. Incorrect use of the term synteny. Nat Genet. 1999;23:387. 28. Housworth EA, Postlethwait J. Measures of synteny conservation between species pairs. Genetics. 2002;162:441–8. 29. Kuraku S, Meyer A. Detection and phylogenetic assessment of conserved synteny derived from whole genome duplications. Methods Mol Biol Clifton NJ. 2012;855:385–95. 30. Riadi G, Medina-Moenne C, Holmes DS. TnpPred: a web service for the robust prediction of prokaryotic transposases. Comp Funct Genomics. 2012; 2012:678761. 31. Marchler-Bauer A, Lu S, Anderson JB, Chitsaz F, Derbyshire MK, DeWeese-Scott C, et al. CDD: a Conserved Domain Database for the functional annotation of proteins. Nucleic Acids Res. 2011;39(Database issue):D225–229. 32. Tatusov RL, Fedorova ND, Jackson JD, Jacobs AR, Kiryutin B, Koonin EV, Krylov DM, Mazumder R, Mekhedov SL, Nikolskaya AN, Rao BS, Smirnov S, Sverdlov AV, Vasudevan S, Wolf YI, Yin JJ, Natale DA. The COG database: an updated version includes eukaryotes. BMC Bioinformatics. 2003;4:41. 33. Galperin MY, Makarova KS, Wolf YI, Koonin EV. Expanded microbial genome coverage and improved protein family annotation in the COG database. Nucleic Acids Res. 2015;43(Database issue):D261–269. 34. Gutmanas A, Alhroub Y, Battle GM, Berrisford JM, Bochet E, Conroy MJ, Dana JM, Fernandez Montecelo MA, van Ginkel G, Gore SP, Haslam P, Hatherley R, Hendrickx PMS, Hirshberg M, Lagerstedt I, Mir S, Mukhopadhyay A, Oldfield TJ, Patwardhan A, Rinaldi L, Sahni G, Sanz-García E, Sen S, Slowley RA, Velankar S, Wainwright ME, Kleywegt GJ. PDBe: Protein Data Bank in Europe. Nucleic Acids Res. 2014;42(Database issue):D285–291. 35. Finn RD, Bateman A, Clements J, Coggill P, Eberhardt RY, Eddy SR, Heger A, Hetherington K, Holm L, Mistry J, Sonnhammer ELL, Tate J, Punta M. Pfam:. Page 10 of 10. 36.. 37.. 38.. 39.. the protein families database. Nucleic Acids Res. 2014;42(Database issue): D222–230. Klimke W, Agarwala R, Badretdin A, Chetvernin S, Ciufo S, Fedorov B, Kiryutin B, O’Neill K, Resch W, Resenchuk S, Schafer S, Tolstoy I, Tatusova T. The national center for biotechnology information’s protein clusters database. Nucleic Acids Res. 2009;37(Database issue):D216–223. Letunic I, Copley RR, Pils B, Pinkert S, Schultz J, Bork P. SMART 5: domains in the context of genomes and networks. Nucleic Acids Res. 2006;34(Database issue):D257–260. Haft DH, Selengut JD, Richter RA, Harkins D, Basu MK, Beck E. TIGRFAMs and Genome Properties in 2013. Nucleic Acids Res. 2013;41(Database issue): D387–395. UniProt Consortium. UniProt: a hub for protein information. Nucleic Acids Res. 2015;43(Database issue):D204–212.. Submit your next manuscript to BioMed Central and we will help you at every step: • We accept pre-submission inquiries • Our selector tool helps you to find the most relevant journal • We provide round the clock customer support • Convenient online submission • Thorough peer review • Inclusion in PubMed and all major indexing services • Maximum visibility for your research Submit your manuscript at www.biomedcentral.com/submit.
(11)
Figure
+3
Documento similar