Assessment of external and internal quality of blueberries using images
174
0
0
Texto completo
(2) PONTIFICIA UNIVERSIDAD CATOLICA DE CHILE ESCUELA DE INGENIERIA. ASSESSMENT OF INTERNAL AND EXTERNAL QUALITY OF BLUEBERRIES USING IMAGES. GABRIEL A. LEIVA VALENZUELA Members of the Committee: JOSÉ M. AGUILERA FRANCO PEDRESCHI. DOMINGO MERY. ROBERTO QUEVEDO RENFU LU CRISTIAN VIAL CRISTIAN VIAL. Thesis submitted to the Office of Research and Graduate Studies in partial fulfillment of the requirements for the Degree of Doctor in Engineering Sciences. CRI. i.
(3) Para Marcela, mis padres y para mis hermanos, con amor les dedico las siguientes páginas que representan un montón de rabias, esfuerzo y enormes alegrías. ii.
(4) ACKNOWLEDGEMENTS A Dios por hacerme ser quien soy, permitirme hacer lo que he hecho, estar donde he estado y conocido a quienes he conocido. En la tierra, quiero agradecer a quienes han luchado conmigo durante años: a mi amada y admirada Señora Marcela quién ha sufrido y gozado en carne propia cada uno de mis caídas y mis logros, de igual manera, agradezco a mis honrados y amados padres Alicia y Néxtor, por entregarme su amor, valores, confianza y no menos importante sus preciados genes. A mis hermanos (Camila, Jorge, Néstor y Varinia), quienes junto a sus hijos (Dea, Simón, Jany, Vary, Gaby, Josué y David) desde su diversidad, siempre me han apoyado para ser mejor en todo sentido. También a mi nueva familia política (Doña María Inés, Fabrizzio, Don Osvaldo, Doña Rosa y Don Miguel), quienes han reforzado en mí lo valioso del sacrificio y de la unión. No menores en este proceso, han sido mis grandes y variados amigos con sus familias Felipe, Carolina y Julián, Paulo y Edith, Oso, Vale y Emilia, Kristel, Carlo y Catalina, Natalia e Israel, Ingrid, Rodrigo, Renata y Rafaela, Fabiola, Mauricio, Rui y Rocío, G. Salvo, Carol y Rodrigo, Paola y David. Inside Universities, in each laboratory or offices there are invaluable people, not only in their knowledge, but also in human quality. To all of them, I would like to thank: Dr. José Miguel Aguilera, my supervisor, who always has the correct weekly statement to reinforce our work. Dr. Renfu Lu, because despite the distance, always has been close to support, correct and guide my work. In similar ways, my committee members deserve a huge acknowledgement: Dr. Mery, Dr. Pedreschi, Dr. Quevedo and Dr. Vial always present in this process and always willing to share their knowledge and ideas. Also all my. gratitude. for. my. contemporary. or. former. laboratory. /. department. mates/teachers/friends: Loreto, Rommy, Javiera R, María Paz, Ely T, Ross, Marcela Q, Cata V, Cata C, Lisette, Wence,. Guillermo, Salomé, Mane, Debbie, Germán M,. Cristobal A, Sra. Hilda, Karina, and Gladys. Ops!!!!! And I would like to thanks the always present Profe Abel Arrieta, who encouraged me to study and study and study. Finally, very far in distance (USDA-MSU): but very close in estimation Fernando, Irwin, Ahmed, Stacy, Miranda, Hallie, Lyo, Javi O, Sebastian and Yira. iii.
(5) Finally I would like to thank my Country and The National Commission for Science and Technology (CONICYT) of Chile for providing several fellowships which allowed me to carry out the research in Chile and in the USDA/ARS postharvest engineering laboratory at Michigan State University in USA and for attendance congresses. -Beca para Estudios de Doctorado en Chile Año Académico 2009. -Becas Apoyo a la Realización de Tesis Doctoral – Convocatoria 2011. -Becas de Pasantías Doctorales en el Extranjero – BECAS CHILE – Convocatoria 2011. -Beca Asistencia a Eventos y Cursos Cortos para Estudiantes de Doctorado – Convocatoria 2012.. iv.
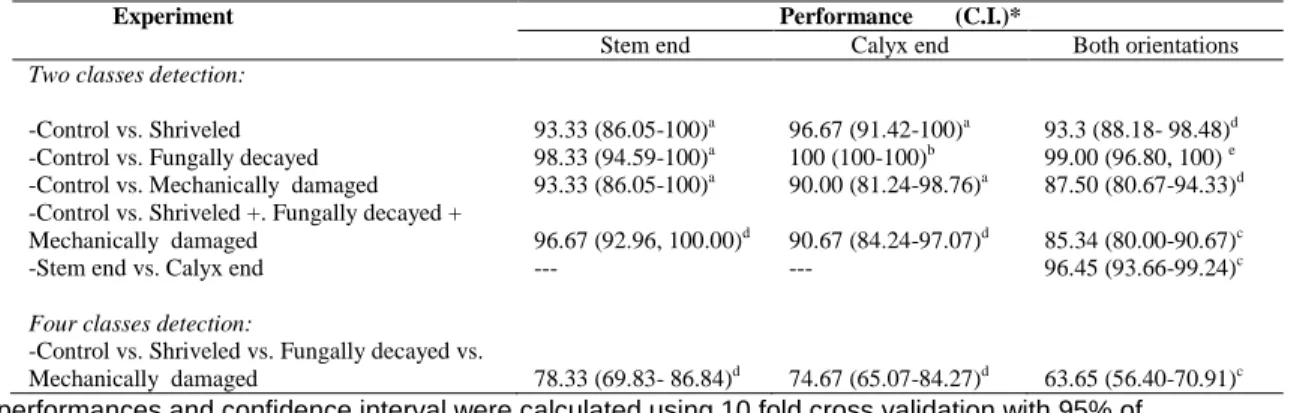
(6) PONTIFICIA UNIVERSIDAD CATOLICA DE CHILE ESCUELA DE INGENIERIA. ASSESSMENT OF EXTERNAL AND INTERNAL QUALITY OF BLUEBERRIES USING IMAGES Thesis submitted to the Office of Research and Graduate Studies in partial fulfillment of the requirements for the Degree of Doctor in Engineering Sciences by GABRIEL A. LEIVA VALENZUELA. ABSTRACT During storage and shipping of blueberries visible and internal fruit damages can lead to rejection at the destination. High maturity variability of blueberry, make it valuable to study non-destructive methodologies for their internal and external assessment during the postharvest. This would improve the quality of blueberries shipped overseas. This thesis has two principal themes: the external quality evaluation of blueberries using pattern recognition techniques with visible images and, the assessment of internal quality using hyperspectral images. For external quality evaluation, the automatic detection of distinctive blueberry orientations (Stem end and Calyx end) and defective fruit - fungally decayed, shriveled and mechanically damaged by impacts or compressed-, were achieved with statistical pattern recognition methods. First, the four-classes (including control berries without damage) of harvested blueberries were imaged to extract color and geometrical features. Features were then selected using sequential forward selection for use by classifiers. Finally, results were validated with external 10-fold cross validation. Using linear discriminant analysis, support vector machine and a probabilistic neural network was able to distinguish the blueberries‘ orientation in 96.5 % of the cases. The classifiers achieved average performances of 98.3 %, 96.7 %, and 93.3 % for fungally decayed, shriveled, and mechanically damaged blueberries.. v.
(7) Two sensing modes (i.e. reflectance and transmittance) of hyperspectral imaging technique were studied for assessing the internal quality of postharvest blueberries (i.e. soluble solids content and softening). This technique combines image processing and spectroscopic analysis to build predictive models. For reflectance, better firmness correlation coefficient for prediction (Rp = 0.87) were obtained with a push broom system, compared to soluble solids content (SSC) predictions (Rp = 0.79). When a higher resolution hyperspectral imaging system was employed, better SSC predictions (above Rp=0.90) were obtained in comparison with those from firmness (Rp=0.78). Transmittance predictions showed lower correlations than reflectance in most cases. Fruit orientation was also evaluated, and it was found that slightly better predictions for stem end in comparison with equator and calyx. Finally, when wavelengths selection was performed, the prediction errors, on average, increased by only 5% when the number of wavelengths was reduced from 478 and 295 for reflectance and transmittance ,respectively, to 90 wavelengths of 10 intervals and 9 wavelengths each. This research has demonstrated the feasibility of implementing inspection systems for automatic sorting of blueberries for external quality using visible color imaging and for internal quality attributes using hyperspectral imaging to enhance product quality and marketability. Members of the Doctoral Thesis Committe: José Miguel Aguilera Franco Pedreschi Domingo Mery Roberto Quevedo Renfu Lu Cristian Vial Santiago, August 7th, 2013. vi.
(8) PONTIFICIA UNIVERSIDAD CATOLICA DE CHILE ESCUELA DE INGENIERIA. EVALUACIÓN DE LA CALIDAD EXTERNA E INTERNA DE ARANDANOS CON IMAGENES Tesis enviada a la Dirección de Investigación y Postgrado en cumplimiento parcial de los requisitos para el grado de Doctor en Ciencias de la Ingeniería. GABRIEL A LEIVA VALENZUELA. Resumen Durante el almacenamiento y el transporte de los arándanos, algunos defectos de la fruta pueden provocar rechazos en algún momento de su comercialización haciendo valiosos los estudios sobre metodologías no destructivas para su evaluación externa e interna durante su poscosecha. De este modo, al ser implementadas, la calidad podría mejorar. La presente tesis tuvo dos ejes principales: la evaluación externa de la calidad de arándanos poscosecha con técnicas de reconocimiento de patrones de imágenes a color, y la evaluación de su calidad interna utilizando imágenes híper espectrales para la construcción de modelos predictivos. Para la evaluación externa de la calidad en arándanos, se implementó un reconocimiento estadístico de patrones para detectar automáticamente las dos principales orientaciones (pedicelo y cáliz) y tres de los defectos más comunes: arándanos con desarrollo de hongos, encogimiento por deshidratación y arándanos con impactos mecánicos o comprimidos. En primer lugar, se adquirieron imágenes de grupos de arándanos clasificados en las dos orientaciones y en las cuatro clases de defectos de arándanos poscosecha (incluida la clase control). Luego de la adquisición, se extrajeron características cromáticas y geométricas para posteriormente seleccionarlas utilizando el algoritmo de ―búsqueda secuencial hacia adelante‖. Estas características seleccionadas fueron utilizadas para entrenar distintos tipos de clasificadores y determinar cuál de ellos entregaba la mejor clasificación. El entrenamiento y prueba del reconocimiento de vii.
(9) patrones fue realizado con 10-validación cruzada lo que permitió su validación estadística. Como resultado se encontró que los clasificadores que arrojaron mejores desempeños fueron el discriminante de análisis lineal, la máquina de soporte vectorial y una red neuronal probabilística. Estos clasificadores posibilitaron la distinción de la orientación de los arándanos en un 96.8% de los casos. El reconocimiento automático de daños fue de un 98,3 %, 96,7 %, and 93,3 % para arándanos con desarrollo de hongos, arándanos con encogimiento por deshidratación y arándanos con daño mecánico respectivamente en el mejor de los casos. Para evaluar la calidad interna de los arándanos (contenido de sólidos solubles y ablandamiento), se construyeron modelos predictivos a partir de la información espectral de imágenes híper espectrales en dos modos de detección (reflectancia y la transmitancia) y tres orientaciones de frutas (pedicelo, cáliz y ecuador). Esta técnica se basa en una combinación de procesamiento de imágenes y de análisis espectroscópico. De este modo, se obtienen múltiples imágenes con información espectral adecuada para construir los modelos. Para las imágenes adquiridas en reflectancia mediante un equipo de barrido, se obtuvieron mejores predicciones que firmeza (RP = 0,87) en comparación con SSC (RP = 0,79). En otro estudio realizado, cuando se aumentó la resolución de la imagen en un sistema estático, se obtuvo una mejor predicción de SSC (por encima de Rp = 0,90) de firmeza (Rp = 0,78). Las predicciones obtenidas con imágenes de transmitancia muestran una correlación inferior a las obtenidas por reflectancia en la mayoría de los casos. Adicionalmente, se evaluó el efecto de la orientación de los arándanos, encontrando una mejor, pero muy leve, predicción para las imágenes de pedicelo en comparación con las obtenidas para ecuador y cáliz. Finalmente, se implementó una selección de longitudes de onda desde las 478 originales para las imágenes en reflectancia y desde 295 para transmitancia hasta sólo 90 imágenes distribuidas en 10 intervalos de grupos de 9 longitudes de onda cada uno para ambos tipos de imágenes. De esta manera, los errores de predicción en promedio aumentaron sólo el 5%.. viii.
(10) Esta investigación ha demostrado la factibilidad del uso de imágenes tanto la clasificación automática de calidad externa usando visión por computador así como la evaluación de la calidad interna mediante imágenes híper espectrales para mejorar la calidad del producto y su comercialización. Miembros del comité de tesis doctoral:. José Miguel Aguilera Franco Pedreschi Domingo Mery Roberto Quevedo Renfu Lu Cristian Vial. Santiago, 7 de agosto de 2013. ix.
(11) LIST OF CONTENT. LIST OF PAPERS .................................................................................................. xiii ISI Papers ......................................................................................................... xiii Proceedings ...................................................................................................... xiii 1.. INTRODUCTION ............................................................................................ 1 1.1. Why blueberries? ....................................................................................... 1 1.2. Automation technology to enhance the quality of blueberries ................... 2 1.3. Hypothesis and objectives .......................................................................... 4 1.4. Outline ........................................................................................................ 5. 2.. NON-DESTRUCTIVE TESTING TO IMPROVE THE QUALITY OF SMALL FRUIT ................................................................................................. 9 2.1. Introduction.................................................................................................. 9 2.2. Small fruit................................................................................................. 10 2.3. Computer vision systems ........................................................................ 13 2.3.1. Image acquisition ........................................................................ 13 2.3.2. Preprocessing and segmentation ................................................. 14 2.3.3. Statistical pattern recognition ...................................................... 15 2.3.4. Applications ................................................................................ 23 2.4. Near infrared spectroscopy and hyperspectral imaging.......................... 25 2.4.1. Hyperspectral imaging equipment ................................................. 26 2.4.2. Sensing modes ............................................................................. 28 2.4.3. Hypercube acquisition and spectral image processing................ 28 2.4.5. Applications ................................................................................ 33 2.5. Other techniques....................................................................................... 38 2.5.1. Mechanical methods ...................................................................... 38 2.5.2. Methods based in aroma detection ........................................ 39 2.5.3. Magnetic resonance imaging ......................................................... 40 2.6. Conclusion................................................................................................ 43. x.
(12) 3.. AUTOMATIC DETECTION OF ORIENTATION AND DISEASES IN BLUEBERRIES USING IMAGE ANALYSIS TO IMPROVE THEIR POSTHARVEST STORAGE QUALITY .................................................... 59 3.1. Introduction .............................................................................................. 59 3.2. Materials and methods ............................................................................. 61 3.2.1. Samples .......................................................................................... 61 3.2.2. Image acquisition, segmentation and color transformation ........... 63 3.2.3. Feature extraction and selection .................................................. 63 3.2.4. Classification ................................................................................. 64 3.2.5. Experimentation ............................................................................. 65 3.2.6. Validation ...................................................................................... 65 3.3 Results and discussion .............................................................................. 66 3.3.1 Extracting and selecting the best features ...................................... 66 3.3.2. Selecting the classifier ................................................................... 70 3.3.3. Detecting defects and orientations of blueberries .......................... 70 3.4 Conclusion................................................................................................ 73 3.5 Abbreviations ........................................................................................... 74. 4.. PREDICTION OF FIRMNESS AND SOLUBLE SOLIDS CONTENT OF BLUEBERRIES USING HYPERSPECTRAL REFLECTANCE IMAGING ....................................................................................................... 78 4.1. Introduction .............................................................................................. 78 4.2. Materials and methods ............................................................................. 81 4.2.1. Samples .......................................................................................... 81 4.2.2. Hyperspectral image acquisition.................................................... 82 4.2.3. Reference Measurements ............................................................... 84 4.2.4. Image processing ......................................................................... 85 4.2.5. Prediction models for fruit orientation evaluation ......................... 86 4.3. Results and discussion ............................................................................. 89 4.3.1. Image and spectral features of blueberries .................................... 89 4.3.2. Correlation between the color and quality of blueberries .............. 92 4.3.3. Prediction of firmness and SSC for fruit orientations ................... 92 4.5. Conclusion................................................................................................ 95. xi.
(13) 5.. ASSESSMENT OF INTERNAL QUALITY OF BLUEBERRIES USING HYPERSPECTRAL TRANSMITTANCE AND REFLECTANCE IMAGES WITH WHOLE SPECTRA OR SELECTED WAVELENGTHS .................................................................... 99 5.1. Introduction ............................................................................................ 100 5.2. Materials and methods ........................................................................... 103 5.2.1. Samples ........................................................................................ 103 5.2.2. Hyperspectral image acquisition.................................................. 103 5.2.3. Blueberry quality measurements ......................................... 106 5.2.4. Image processing ......................................................................... 106 5.2.5. Prediction models for soluble solids content and firmness ........ 108 5.2.6. Wavelengths selection ................................................................. 110 5.3. Results and discussion ........................................................................ 110 5.3.1. Spectral characters of blueberries ............................................... 111 5.3.2. Prediction of soluble solids content and firmness ....................... 113 5.3.3 Spectral dimension reduction ..................................................... 119 5.3. 4. Discussion .................................................................................... 123 5.5. Conclusion.............................................................................................. 124. 6.. GENERAL CONCLUSION AND FUTURE PROSPECTS ..................... 142 6.1 Conclusion.............................................................................................. 142 6.2 Future prospects ..................................................................................... 144. 7.. GENERAL BIBLIOGRAFY ....................................................................... 145. xii.
(14) LIST OF PAPERS ISI Papers This thesis is based on the following manuscripts: Chapter 3:. Leiva-Valenzuela, G.A., Aguilera, J.M., 2013. Automatic detection of. orientation and diseases in blueberries using image analysis to improve their postharvest storage quality. Food Control 33, 166-173. Chapter 4: Leiva-Valenzuela, G.A., Lu, R., Aguilera, J.M., 2013. Prediction of firmness and soluble solids content of blueberries using hyperspectral reflectance imaging. Journal of Food Engineering 115, 91-98. Chapter 5:. Leiva-Valenzuela, G.A., Lu, R., Aguilera, J.M., 2013. Assessment of. internal quality of blueberries using hyperspectral transmittance and reflectance images with whole spectra or selected wavelengths. Submitted to Food and Bioprocess Technology. Proceedings Parts of this work have also been presented at international congresses: Leiva-Valenzuela GA, Lu, R., Aguilera J. 2013. Assessment of internal quality of blueberries using hyperspectral images with selected wavelenghts. Proceedings of InsideFood Symposium, 9-12 April 2013, Leuven, Belgium. Leiva G, Mondragón G, Mery D., Aguilera J. 2011. The automatic sorting using image processing improves postharvest blueberries storage quality. Proceedings of 11th International Congress on Engineering and Food. Athens, Greece. Leiva-Valenzuela G, Lu, R., Aguilera J. 2012. Assessment of internal quality of blueberry using hyperspectral imaging. Proceedings of 2012 ASABE Annual Meeting Paper, Dallas, USA, July, 2012. xiii.
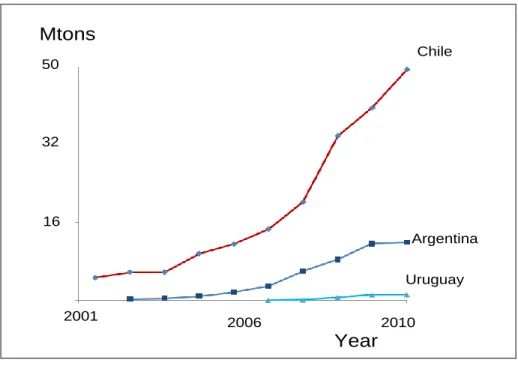
(15) Chapter 1. 1. 1.1.. INTRODUCTION. Why blueberries?. Blueberry is an important fruit worldwide whose consumption has increased in recent years due to its good flavor and high antioxidant capacity, which is good for anti-aging. The United States of America is the leading blueberry exporter, followed by Canada (Faoestat 2009). In recent years, countries in the southern hemisphere (e.g., Argentina, Chile, New Zealand and South Africa) have increased fruit export to the northern hemisphere by taking advantage of seasonal differences in production. But long-distance transoceanic shipment requires delivering higher quality and more consistent fresh blueberries at the origin country in order to meet the quality standards upon arrival at the destination.. Mtons Chile 50. 32. 16 Argentina Uruguay 2001. 2006. 2010. Year Figure 1.1 Evolution of blueberry exportation for the principal producing countries in South America (Kong 2009) Fruit south hemisphere overall export has been fruit have doubled in recent years. In Chile, for example, fruit exportations grew from USD $ 1.4 million in 1999, to USD 2,7 million in 2010 (Figure, 1.1). Moreover, the blueberry exports lead this improvement; between 2001 and 2010, it has increased almost 10 times (Kong 2009). 1.
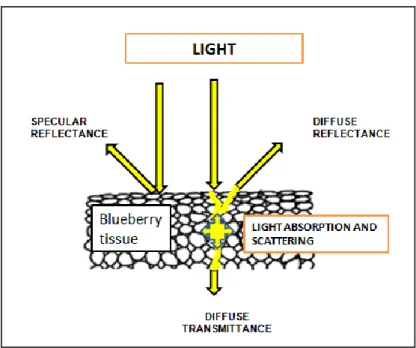
(16) Chapter 1. 1.2.. Automation technology to enhance the quality of blueberries. When fruits are exposed to light, a small part of the light is reflected at the surface causing specular reflectance or gloss, while most of the light energy penetrates into the fruit tissue for only a very short distance and then exits from the fruit. The remaining part of the light penetrates deeper into the tissue, which is then partially absorbed by fruit tissue or passes a section of the fruit before exiting, generating diffuse reflectance and/or body reflectance or interactance. Finally, a minimal portion of the light passes the whole fruit, producing so called diffuse transmittance or body transmittance (Abbott 1999). Transmittance measurement is thus strongly affected by the optical properties size and shape of fruit, and it requires a high intensity light source (Figure 1.2). Those fruit optical properties can be measured by computer vision or hyperspectral sensors and in the most of cases is the basis of determination of fruit quality.. Figure 1.2 The optical properties of fruit tissue can help to improve technology using image techniques to acquire reflected or transmitted light. Accurate determination of blueberry quality is challenging because individual fruits are small, dark in color, and vary greatly in external and internal quality characteristics. Traditional manual inspection is still widely used; it is slow, unreliable and dependent 2.
(17) Chapter 1. on workers availability. For these reasons, it is increasingly important to study the quality improvement of blueberries in the agricultural production and marketing chain using automation technologies. Previous studies have shown that applications of computer vision in quality control in food are more accurate, safe and quicker than human sight (Aguilera and Briones 2005). Computing vision technology which is based on image processing, as an alternative to visual inspection, is now being used in various foods and agricultural commodities sorting systems; it is objective, consistent, rapid, and economical (Brosnan and Sun 2002; Kumar-Patel et al. 2012). Images have been effectively used to classify or recognize quality in agricultural and food commodities including apple (Malus domestica) (Paulus and Schrevens 1999), strawberry (Fragaria spp.) (Bato et al. 2000), pistachio (Pistacia vera) (Pearson and Toyofuku 2000), fungal decayed chestnut (Donis-González et al. 2013; Wang et al. 2011b),. potato chip. (Pedreschi et al. 2006), tortilla (Mery et al. 2010a), pizza (Sun and Brosnan 2003b, a), chocolate chip biscuits (Davidson et al. 2001), cheese (Wang and Sun 2002a, b, 2001), pork meat (Lu et al. 2000; Faucitano et al. 2005), between others. Currently, commercial sorting systems are available. For high-speed sorting of agricultural products (up of 2 tons h-1) and are able to reject up to 95% of out-of-range blueberries. However, these sorters sort blueberries based on the detection of surface color, and they are limited or not are able to recognize specific defects such as fungal decay and shriveling. Beside color, shape and texture, there are other quality parameters that define the blueberries internal quality. Two of the most important ones are softness or firmness and sweetness. Considerable research has been reported on the development of automatic sorting and grading techniques for firmness, a measurement of softening, for blueberries. Currently, several commercial sorting systems are available, which are based on detection of the impact response of blueberries when they hit a pressure sensor. While commercial systems allow high speed sorting, they are only able to reject up to 80% of soft fruit. Soluble solids content (SSC), an accepted measure of sweetness, is another important. 3.
(18) Chapter 1. quality attribute for blueberries. It is usually determined from the juice extracted from fruit flesh using the refractometric method (Noh and Lu 2007). Over the past decade, hyperspectral imaging has emerged as a powerful inspection technique for food and agricultural products. The technique allows acquisition of both spectral and spatial information about an object simultaneously (ElMasry and Sun 2010). Since each hyperspectral image is represented by a 3-D spectral data cube or hypercube (Geladi et al. 2004; Nicolaï et al. 2006), it is thus advantageous over conventional imaging or spectroscopy technique in quality and safety inspection of food and agricultural products (Noh and Lu 2007). The technique was applied to small fruits like strawberry, a fruit relatively close to blueberry, for detection of bruises (Tallada et al. 2006) and prediction of dry matter, SSC, acidity or firmness (ElMasry et al. 2007; Nagata et al. 2005). These studies have shown the feasibility of hyperspectral imaging for measuring the appearance through image processing and physicochemical properties using spectral information. The purpose of this thesis is to evaluate the suitability of non-destructive measurement of blueberries using image techniques. Computer vision and hyperspectral imaging both are image-based techniques suitable to assess the quality of agricultural commodities. While computer vision is commonly used to evaluate the external fruit appearance, hyperspectral imaging allows evaluation of both internal and external characteristics. 1.3.. Hypothesis and objectives. The hypothesis of this thesis is that computer vision and hyperspectral imaging techniques are reliable technologies to assess automatically the external and internal quality of blueberries. They can thus be used for simultaneous inspection of multiple quality aspects of blueberries, such as external defects, soluble solids content, firmness, color, size, presence of insects, bruise, mold, and shriveling. Therefore, the general objective of this thesis is to evaluate the two important image techniques for improvement of the postharvest blueberries quality.. 4.
(19) Chapter 1. This general objective is achieved with the following specific objectives: . Develop automatic color image processing algorithms for detection of fruit orientation to facilitate fruit defect detection.. . Create segregations plans by detection of visible fruit diseases.. . Evaluate the feasibility of hyperspectral imaging techniques utilization to assess the internal quality of blueberries.. . Improve the prediction of internal quality attributes by studying and combining different sensing modes and fruit orientation Effect.. . Enhance image processing efficiency by selection of appropriate wavelengths in hyperspectral imaging techniques.. 1.4.. Outline. This thesis consists of one review chapter, three experimental chapters and a conclusion. Chapter 2 (review) explains why non-destructive evaluation of berries is valuable considering market and consumer requirements and how image-based non-destructive technologies afforded in this thesis work. It finally reviews the major scientific advances in this field of knowledge. In Chapter 3, the external quality of blueberries was evaluated using statistical pattern recognition with color images. Algorithms were implemented for identification of three classes of defects caused by diseases commonly found in blueberries during postharvest storage. Additionally, algorithms were implemented for whether the fruit orientation detection. Chapter 4 positively answer the question of whether hyperspectral reflectance imaging technique is suitable to predict soluble solids content and softening in blueberries, two parameters that are most of important o internal quality.. 5.
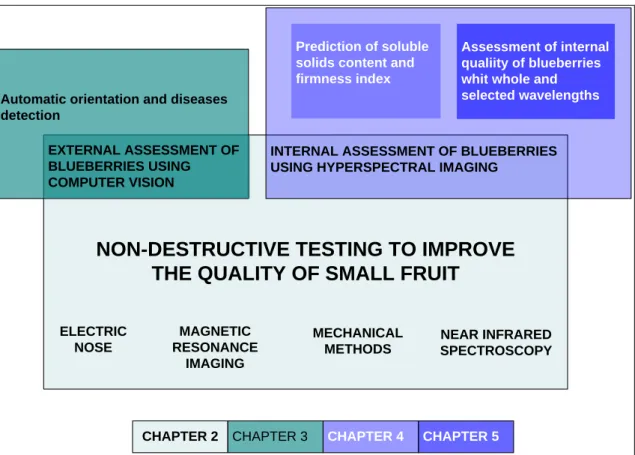
(20) Chapter 1. Chapter 5 reached an important improvement in the assessment of internal quality of blueberries using two sensing modes (transmittance and reflectance) in a high resolution hyperspectral imaging system. Moreover, the effect of orientations was further evaluated by inclusion of a third orientation (equator). Finally, a methodology to select the most appropriate wavelengths was proposed, since the speed of image acquisition and processing by a hyperspectral imaging system is not enough to meet the requirement for sorting lines in the packinghouse. Chapter 6 concludes this thesis. A thesis overview can be found in Figure 1.3. Prediction of soluble solids content and firmness index Automatic orientation and diseases detection EXTERNAL ASSESSMENT OF BLUEBERRIES USING COMPUTER VISION. Assessment of internal qualiity of blueberries whit whole and selected wavelengths. INTERNAL ASSESSMENT OF BLUEBERRIES USING HYPERSPECTRAL IMAGING. NON-DESTRUCTIVE TESTING TO IMPROVE THE QUALITY OF SMALL FRUIT ELECTRIC NOSE. MAGNETIC RESONANCE IMAGING. CHAPTER 2. CHAPTER 3. MECHANICAL METHODS. CHAPTER 4. NEAR INFRARED SPECTROSCOPY. CHAPTER 5. Figure 1.3 Overview of the studies comprising this thesis.. 6.
(21) Chapter 1. References Aguilera JM & Briones V. 2005. Computer vision and food quality. Food Australia 57(3):79-87. Bato PM, Nagata M, Cao QX, Hiyoshi K & Kitahara T. 2000. Study of sorting system for strawberry using machine vision (part 2): development of sorting system with direction and judgment functions for strawberry (Akihime variety). J. of the Japanese Society of Agr. Machinery 62(2):101-110. Brosnan T & Sun D-W. 2002. Inspection and grading of agricultural and food products by computer vison systems - a review. Computers and Electronics in Agriculture 36:193-213. Davidson VJ, Ryks J & Chu T. 2001. Fuzzy models to predict consumer ratings for biscuit based on digital features. IEEE Transactions of Fuzzy Systems. p. 62-67. Donis-González IR, Guyer DE, Leiva-Valenzuela GA & Burns J. 2013. Assessment of chestnut (Castanea spp.) slice quality using color images. Journal of Food Engineering 115(3):407-414. ElMasry G & Sun D-W. 2010. Principles of Hyperspectral Imaging Technology. In: Sun, D.-W., editor). Hyperspectral Imaging for food quality analysis and control. London, UK: Elsevier Inc. p. 477. ElMasry G, Wang N, ElSayed A & Ngadi M. 2007. Hyperspectral imaging for nondestructive determination of some quality attributes for strawberry. Journal of Food Engineering 81(1):98-107. Faoestat. 2009. Food and agricultural commodities production. Countries by commodity Food and Agriculture Organization of United Nations. Faucitano L, Huff P, Teuscher F, Gariepy C & Wegner J. 2005. Application of computer image analysis to measure pork marbling characteristics. Meat Science 69(3):537-543. Geladi P, Burger J & Lestander T. 2004. Hyperspectral imaging: calibration problems and solutions. Chemometrics and Intelligent Laboratory Systems 72(2):209-217. Kong J. 2009. Análisis económico del rubro Berries. Raihuén Chile: Consorcio Tecnológico de la Fruta. Kumar-Patel K, Kar A, Jha SN & Khan MA. 2012. Machine vision system: a tool for quality inspection of food and agricultural products. J. of Food Sci. and Tech. 49(2):123141. Lu J, Tan J, Shatadal P & Gerrard DE. 2000. Evaluation of pork color by using computer vision. Meat Sci. 56:57-60. 7.
(22) Chapter 1. Mery D, Chanona-Perez JJ, Soto A, Aguilera JM, Cipriano A, Velez-Rivera N, ArzateVazquez I & Gutierrez-Lopez GF. 2010. Quality classification of corn tortillaz using computer vision. Journal of Food Engingeering 101:357-364. Nagata M, Tallada J, G. , Kobayashi T & Toyoda H. 2005. NIR Hyperspectral Imaging for Measurement of Internal Quality in Strawberries. 2005 ASAE Annual International Meeting Paper No. 053131:2-10. Nicolaï BM, Lötze E, Peirs A, Scheerlinck N & Theron KI. 2006. Non-destructive measurement of bitter pit in apple fruit using NIR hyperspectral imaging. Postharvest Biology and Technology 40(1):1-6. Noh HK & Lu R. 2007. Hyperspectral laser-induced fluorescence imaging for assessing apple fruit quality. Postharvest Biology and Technology 43(2):193-201. Paulus I & Schrevens E. 1999. Shape characterisation of new apple cultivars by Furier expansion of digital images. J. of Agr. Eng. Res. 68:341-353. Pearson T & Toyofuku N. 2000. Automated sorting of pistachio nuts with closed shells. Appl. Eng. in Agr. 16(1):91-94. Pedreschi F, León J, Mery D & Moyano P. 2006. Development of a computer vision system to measure the color of potato chips. Food Research International 39(10):10921098. Sun D-W & Brosnan T. 2003a. Pizza quality evaluation using computer vision--part 1: Pizza base and sauce spread. Journal of Food Engineering 57(1):81-89. Sun D-W & Brosnan T. 2003b. Pizza quality evaluation using computer vision--Part 2: Pizza topping analysis. Journal of Food Engineering 57(1):91-95. Tallada J, G., Nagata M & Kobayashi T. 2006. Detection of Bruises in Strawberies By Hyperspectral Imaging. ASABE Annual International Meeting Paper No. 063014:1-12. Wang C, Li X, Wang W, Feng Y, Zhou Z & Zhan H. 2011. Recognition of worm-eaten chestnuts based on machine vision. Mathematical and Computer Modelling 54(3‚Äì4):888-894. Wang H-H & Sun D-W. 2001. Evaluation of the functional properties of cheddar cheese using a computer vision method. J. of Food Eng. 49(1):47-51. Wang H-H & Sun D-W. 2002a. Correlation between cheese meltability determined with a computer vision method and with Arnott and Schreiber. J. of Food Eng. 67(2):745749. Wang H-H & Sun D-W. 2002b. Melting characteristics of cheese: analysis of effects of cooking conditions using computer vision techniques. J. of Food Eng. 52(3):279-284. 8.
(23) Chapter 2. 2.. NON-DESTRUCTIVE TESTING TO IMPROVE THE QUALITY OF SMALL FRUIT. Abstract Small fruit such as berries, grapes and cherries are susceptible to postharvest damages which need to be assessed at the time of packing. Despite being a common practice, quality selection by hand is slow and unreliable, and its cost has increased over time. Therefore, the development of quick and reliable new technologies to assess the quality of small fruit on-line and without direct intervention is now necessary in compliance with more demanding markets. The most important visible quality attributes during postharvest include color, shape, and homogeneity, absence of defect fruit such as shriveling, fungal decay, and mechanical damage. Internal quality descriptors include sweetness, firmness and absence of insects. This chapter reviews the principal non-destructive techniques applied to small fruits including, impact and vibration, computer vision, hyperspectral imaging, near infrared spectroscopy, electric nose, and magnetic resonance. 2.1. Introduction Small fruit is a non-botanical group of fruits, commonly including berries, grape, cherry, cherry tomato and others, which are small in size and have elastic properties. These fruits command high prices because consumers now associate their consumption with beneficial health effects associated to anti-aging properties. Commercially, grape, strawberry, blueberry and raspberry are the most important small fruits around the world, whose quality depends on physiological and environmental factors (FAO 2011). Fresh market requirements exert a pressure to improve sorting practices by assessing the quality of individual fruits, which normally is carried out by hand; the increment in labor costs has led to the implementation of non-destructive, mechanical sorting systems to improve the classification of fruits by firmness.. 9.
(24) Chapter 2. Automated systems replace the tasks that used to be performed by skillful operators with eyes and hands (Aguilera and Briones 2005). Image processing is intended to evaluate the external fruit quality in replacement of human vision which is the basis of nondestructive computer vision technology (Brosnan and Sun 2004; Bull 1993; Moreda et al. 2009; Rocha et al. 2010). Image analysis of a real scene by computer allows studying attributes of large number of products and forming the base of scaled-up processes (Zitová and Flusser 2003; Rosenfeld 1988; Golnabi and Asadpour 2007; Finlayson et al. 2001). Near infrared spectroscopy and multi or hyperspectral imaging techniques offer the capability of internal quality assessment by measuring internal quality attributes (i.e. sugars, firmness, acidity etc.). These techniques are non-destructive technique and require little or no sample preparation. Although automatic sorters based on these technologies are being used for major large fruits such as apple, oranges and pears, their implementation for small fruits has been limited up to now. 2.2.. Small fruit. Small fruit is a non-botanical group of fruits, commonly including berries, grape, cherry, cherry tomato and others which are small in size and have elastic properties for texture measurement. Their consumption has increased in recent years because of good flavor and high antioxidant capacity, which is supposedly good as a anti-aging therapy and has positive protective effects against several pathological conditions (i.e. cancer, stroke, heart attack and Alzheimer‘s disease (Piljac-Zegarac and Samec 2011). Grape production is led by China (9,174,280 MT), Italy (7,115,500 MT) and United States of America (6,692,950 MT). Strawberry production is important in United States of America (1,782,053 MT), Spain (514,027 MT) and Turkey (302,416 MT); Turkey is the main cherry producer (438,550 MT) followed by United States of America and Iran with 303,363 MT and 241,117 MT respectively. For blueberry, the trade is commanded. 10.
(25) Chapter 2. by United States of America (196,905 MT), Canada (112,363 MT) and Poland (8,595 MT). Others small fruits of importance are raspberry,. cranberry, blackberry,. boysenberry, gooseberry, currants and elderberry (FAO 2011). Quality of small fruits is determined by physiological and environmental factors such as variety, nutriments and humidity of soil, presence and control of pathogens and cultivation practice. The principal negative vectors during fruit development and maturity are gray mold, causing fungal decay, anthracnose, alternaria, rhizopus and other caused by environmental factors (Table 2.1). Postharvest storage of these fruits is often restricted to only a few weeks even under optimal temperature and humidity conditions. Moreover, they suffer color change, softening, pitting, peduncle browning and dehydration during retail operations (Linke et al. 2010). Quality standards of commercial fresh berry fruits are defined by the law of supply and demand. However, the Agricultural Marketing Service from the United States Department of Agriculture defines standards for grading fresh fruit. These standards are based on ―measurable attributes such as color, caliber and defects absence that describe the value and utility of the products‖. In general, the best grade quality standard (U.S. No.1) for berries, cherry and grape includes the following factors: similar varietal characteristic, mature, cleanness, well colored, not overripe, absence of crushes, split or leaking, free from attached stems, molds, decay, insect or evidence, mummified berries, clusters. Moreover, the classification in grades implies the fulfillment of size requirements (AMS-USDA 2011). Since most of those attributes are visible, the implementation of sensing automatic technologies based on computer vision is quite adequate and reliable. Accurate determination of quality of small fruit is challenging because individual fruits are small and vary greatly in external and internal quality characteristics. In packing operations small fruit such blueberry, is often graded manually which is slow and unreliable and depends on workers‘ availability. For these reasons there is currently major interest in automation technology in order to improve fruit quality determination. 11.
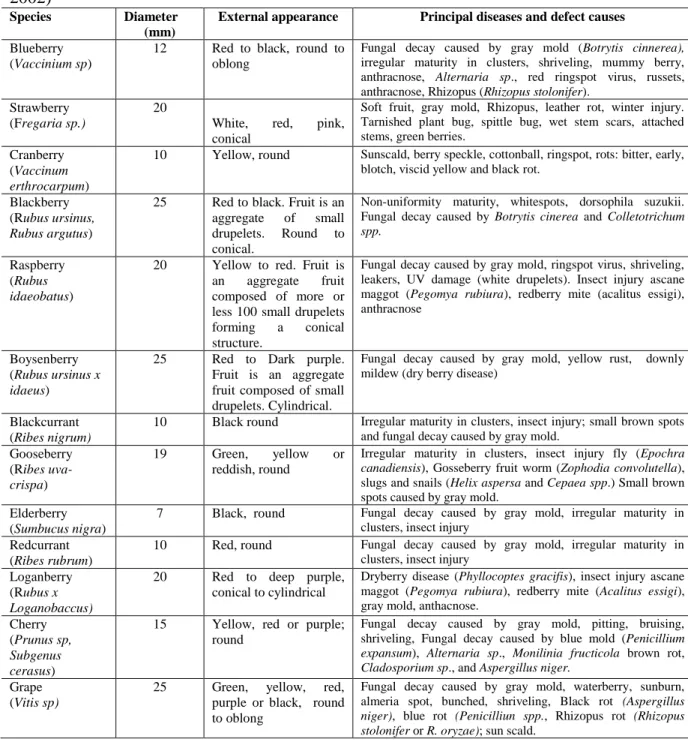
(26) Chapter 2. during packaging operations. This chapter reviews several optic technologies in nondestructive assessment of internal and external quality of small fruits. Table 2.1. Appearance attributes and defects and diseases of principal small fruits (Gross 2004); (Antonelli et al. 2004); (Walter et al. 1997); (J.P. Kidd 2003); (Perry et al. 2002) Species Blueberry (Vaccinium sp). Diameter (mm) 12. External appearance. Principal diseases and defect causes. Red to black, round to oblong. Fungal decay caused by gray mold (Botrytis cinnerea), irregular maturity in clusters, shriveling, mummy berry, anthracnose, Alternaria sp., red ringspot virus, russets, anthracnose, Rhizopus (Rhizopus stolonifer). Soft fruit, gray mold, Rhizopus, leather rot, winter injury. Tarnished plant bug, spittle bug, wet stem scars, attached stems, green berries. Sunscald, berry speckle, cottonball, ringspot, rots: bitter, early, blotch, viscid yellow and black rot.. Strawberry (Fregaria sp.). 20. Cranberry (Vaccinum erthrocarpum) Blackberry (Rubus ursinus, Rubus argutus). 10. Raspberry (Rubus idaeobatus). 20. Boysenberry (Rubus ursinus x idaeus). 25. Blackcurrant (Ribes nigrum) Gooseberry (Ribes uvacrispa). 10 19. Green, yellow reddish, round. Elderberry (Sumbucus nigra) Redcurrant (Ribes rubrum) Loganberry (Rubus x Loganobaccus) Cherry (Prunus sp, Subgenus cerasus) Grape (Vitis sp). 7. Black, round. 10. Red, round. 20. Red to deep purple, conical to cylindrical. 15. Yellow, red or purple; round. 25. Green, yellow, red, purple or black, round to oblong. 25. White, red, conical Yellow, round. pink,. Red to black. Fruit is an aggregate of small drupelets. Round to conical. Yellow to red. Fruit is an aggregate fruit composed of more or less 100 small drupelets forming a conical structure. Red to Dark purple. Fruit is an aggregate fruit composed of small drupelets. Cylindrical. Black round or. Non-uniformity maturity, whitespots, dorsophila suzukii. Fungal decay caused by Botrytis cinerea and Colletotrichum spp. Fungal decay caused by gray mold, ringspot virus, shriveling, leakers, UV damage (white drupelets). Insect injury ascane maggot (Pegomya rubiura), redberry mite (acalitus essigi), anthracnose. Fungal decay caused by gray mold, yellow rust, mildew (dry berry disease). downly. Irregular maturity in clusters, insect injury; small brown spots and fungal decay caused by gray mold. Irregular maturity in clusters, insect injury fly (Epochra canadiensis), Gosseberry fruit worm (Zophodia convolutella), slugs and snails (Helix aspersa and Cepaea spp.) Small brown spots caused by gray mold. Fungal decay caused by gray mold, irregular maturity in clusters, insect injury Fungal decay caused by gray mold, irregular maturity in clusters, insect injury Dryberry disease (Phyllocoptes gracifis), insect injury ascane maggot (Pegomya rubiura), redberry mite (Acalitus essigi), gray mold, anthacnose. Fungal decay caused by gray mold, pitting, bruising, shriveling, Fungal decay caused by blue mold (Penicillium expansum), Alternaria sp., Monilinia fructicola brown rot, Cladosporium sp., and Aspergillus niger. Fungal decay caused by gray mold, waterberry, sunburn, almeria spot, bunched, shriveling, Black rot (Aspergillus niger), blue rot (Penicilliun spp., Rhizopus rot (Rhizopus stolonifer or R. oryzae); sun scald.. 12.
(27) Chapter 2. 2.3.. Computer vision systems. Computer vision is one of the most useful technologies to evaluate external fruit quality. It is objective, consistent, rapid, and economical. The technology offers an automated alternative to manual inspection and is currently being used in various food and agricultural sorting systems. While computer vision may be applied using different acquisition techniques such as color, magnetic resonance (MRI) and X-ray, visible imaging is the most widespread in evaluate food and agriculture products. 2.3.1.. Image acquisition. An image is formed when waves from electromagnetic radiation are partially reflected, transferred or emitted by an object from a real scene and these waves are captured by sensors and transduced in electrical signals as a 2-dimensional array of numbers called a matrix. The matrix consists of columns (M) and rows (N) that define small square regions called picture elements or pixels (Seeram and Seeram 2008). In other words, a digital image is the interpretation of one or more numerical matrix, where the object of interest has numeric affinities that represent colors or gray intensity zones inside the image. Thus, computational techniques operated with algebraic principles can detect specific fruit features (Leiva-Valenzuela and Aguilera 2013). In computer vision, images of external attributes of samples are acquired with chargecoupled device (CCD) or Complementary metal–oxide–semiconductor (CMOS) cameras that capture wavelengths of the visible spectrum (Du and Sun 2004). The extracted information depends on both the scene illumination and external elements such as the optic system, sensors and signal processing. In a typical image acquisition system, highquality illumination is designed to acquire homogeneous information about the sample under testing. Choosing a right illuminant source often is a difficult problem because the sample reflectance may induce specular reflectance and saturations forcing adjustment to ensure an appropriate processing (Valous et al. 2009). Therefore, the characteristics of the sample surface may increase levels of reflectance producing distortion that. 13.
(28) Chapter 2. changes correct fruit measurements. The object to be measured should maintain an appropriate distance to the image device. Moreover, occlusion and shadows should be avoided in order to allow correct segmentation and measurement. Depending on the application, computer vision configurations vary from in-room to outdoor systems. In most in-room applications, image acquisition, light, distance and angle of acquisition have to be standardized and a laboratory colorimeter is needed. Laboratory colorimeters are extensively used in science to understand color, shape and texture changes induced by reactions, time, or chemical treatments of samples, allowing the first approach to design a classification process. Commercial vision-based sorters are add product value by physically segregation of food and agricultural products into quality grades . They require faster sensors and image processing systems able to reduce image blur and classify products in real time. Generally, outdoor system implementation requires light and geometric correction. Outdoor systems are generally referred to those used in precision agriculture. 2.3.2.. Preprocessing and segmentation. The role of preprocessing is to segment the pattern of interest from the background, remove noise, normalize the pattern, and perform any other operations which will contribute in defining a compact representation of patterns (Jain et al. 2000). Specifically after acquisition, images are transformed with algebraic operations to improve signal to noise ratio; this stage, known as image pre-processing, includes filtering, histogram correction, registration, channel transformations (Ibrahim et al. 2008). Therefore, subsequent segmentation can be performed. Segmentation is the stage where the area of interest is recognized from the background region in order to discard most non-relevant elements of the image, or accent important regions of interest to be analyzed subsequently. For food application, robust algorithms are required for isolating regions of interest in food color images using threshold and morphological operations (Mery and Pedreschi 2005). However, historically, the most. 14.
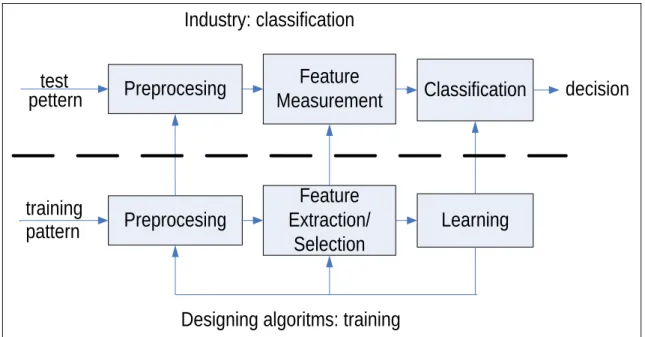
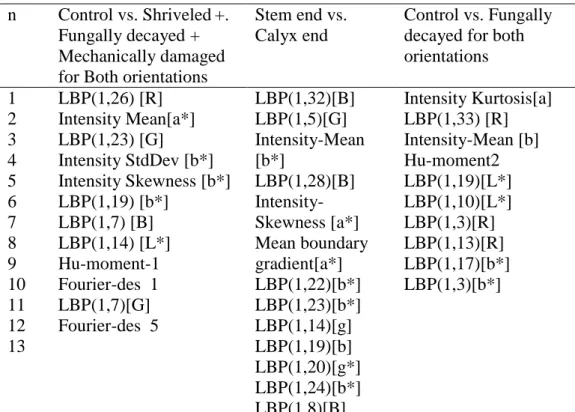
(29) Chapter 2. used algorithms is the Otsu method (Otsu 1979). Other segmentation algorithms include adaptive image segmentation (Jiang et al. 2008), texture segmentation using Gabor filters (Zhang 2002), and classification segmentation (Mery et al. 2011). After segmentation, color images could be transformed from RGB color channels to others (i.e. grayscale; L*,a*, b*; H, S, I coordinates) by applying mathematical relations and transformations in order to improve the image processing (León et al. 2006). 2.3.3.. Statistical pattern recognition Pattern recognition studies how machines may ―watch‖ the environment in order. to take decisions about how an object wedges in a category. A pattern is represented for a group of geometric and chromatic features able to define two or more classes. A pattern is represented by a set of features or quantitative attributes able to be segregated by decision boundaries between pattern classes establish by concepts of statistical decision theory operated in two modes: training or learning and classification or testing. In training operation, the features extraction / selection module finds the appropriate features for representing the input patterns and the classifier is trained to partition the feature space while in the classification mode, the trained classifier assigns the input pattern to one of the pattern classes under consideration based on the measured features (Figure 2.1) (Jain et al. 2000). Pattern recognition techniques can be applied over a set of images to segregate or sort groups of images by setting one or more differentiation criteria. Those criteria are defined for extracting and selecting image features, training and testing classifiers and validating the methodology.. 15.
(30) Chapter 2. Industry: classification test pettern. training pattern. Preprocesing. Feature Measurement. Classification. Preprocesing. Feature Extraction/ Selection. Learning. decision. Designing algoritms: training Figure 2.1: The recognition system is operated in two modes: training (learning) and classification (testing) (Jain et al. 2000). The most common industrial applications of computer vision involve the classification stage. Nevertheless, training is closely related during the process. It allows a continuous improvement of the system. 2.3.3. 1. Feature extraction and selection After segmentation, the sample´s quantitative attributes from the region(s) of interest (is) are measured. When a system is trained, the first step consists of extraction of features using algorithms (the most features from known category images as possible), After that, features must be selected by their capacity of correctly separating the classes (Mery and Soto 2008). Attributes or features include: Standard geometrical features such as area, orientation, Euler number, and solidity; invariant features like Hu and Flusser and Suk moments (Hu 1962a; Flusser and Suk 2005) (Table 2.2.); Fourier descriptors which facilitates the shape determination of a region and its neighborhood (Persoon and Fu 1977). Thus, invariant moments are calculated to obtain information about the patterns of the shape regardless the overall size of the regions of interest. A second group is Intensity features, Haralick and Gupta texture and Local Binary Pattern (LBP) features take into account the distribution of the intensity values in the region. Haralick features are often extracted in order to obtain information about the 16.
(31) Chapter 2. intensity values distribution (Table 2.3). Basically, to obtain these textural features a cooccurrence matrix is computed per intensity image, which represents the joint probability distribution of intensity pairs of neighboring pixels. Thereafter, the mean and range of a mask containing five different neighboring pixels generated 14 basic Tx features summarizing information regarding the overall appearance quality of blueberries in each of the different color channels, where darker colors present in healthy, ripe fruit have a lower intensity and variability in comparison with lighter colors present in shriveled and fungally decayed fruit (Donis-González et al. 2012; Haralick 1979; Haralick and Shapiro 1993). Standard intensity features (Table 2.4) are related to mean, standard deviation of intensity in region, mean first-order derivative in the boundary and second order derivative in the region; contrast features which provide information of the intensity between a region and its neighborhood (Mery and Soto 2008). LBP uses both statistical and structural characteristics of texture; it is a powerful tool for texture analysis. In the LBP operator, local texture patterns such as means, variances, etc. are extracted by comparing the value of neighborhood pixels with the value of the central pixel and are represented using binary codes (Kumar and Pang 2002; Pietikäinen et al. 2000). (2.27) Where (2.28) In Which neighbourhood,. is the gray value of the central pixel in the circularly symmetric takes the different eight pixels values from the neighborhood.. 17.
(32) Chapter 2. Table 2.2. Invariant moments Hu moments (2.1). (2.2) (2.3) (2.4). (2.6) (2.7). Where, (2.8) and. is the central moment, and and. describe pixel position of the segmented image (I).. Flusser and Suk moments Moments are derived from complex moments of the image: (2.9). While the segmented object is rotated by an angle magnitude, as its phase is shifted by. , each of the complex moments of the image preserves its. (2.10). 18.
(33) Chapter 2. Table 2.3. Haralick textural features (Donis-González et al. 2012; Haralick 1979) Texture Formula 1. Angular second moment. (2.11). 2. Contrast. (2.12). 3. Correlation. (2.13) Where and are the means and standard deviation of probability density functions.. 4. Sum of Squares: Variance 5. Inverse difference moment 6. Average sum. and. , the partial. (2.14). (2.15). (2.16). Where, is the number of gray tones of the image (I). and are the coordinates (row and column) of an entry in the coocurrence matrix coordinates.. 7. Variance sum. (2.17). 8. Entropy sum. (2.18). 9. Entropy (. (2.19). 10. Variance difference. (2.20). 11. Entropy difference 12. Correlation measurement - 1 13. Correlation measurement - 2. (2.21). (2.22) (2.23) HX and HY are the entropies of. and. . (2.24) (2.25). 14. Maximum correlation coefficient. Square root of the second largest eigenvalue of: (2.26). 19.
(34) Chapter 2. Fourier and discrete cosine transform coefficients where images are analyzed in the frequency domain. In Fourier domain image, each pixel represents a particular frequency contained in the spatial domain image; Gabor features are based on 2D Gaussian-shaped band-pass filter, with dyadic treatment of the radial spatial frequency range and multiple orientations representing measurement in both space and frequency domains (Mery et al. 2012). (2.29) for. .. where (ik, jk) are the border pixel coordinates for. , L is the number of. pixels that are part of the perimeter border of a complex number region denoted by with. .. Gabor filters have been applied to image recognition problems because of its optimal localization properties in both the spatial and frequency domains (Huang et al. 2005). In this sense, Gabor features provide information concerning the development of any singularity of sample and is a complex exponential modulated by a Gaussian function:. (2.30). and. denote the Gaussian envelope along the. and. axes, and. defines the. radial frequency. In the frequency domain, the Gabor function acts as a band pass filter, using the Gaussian function. The self-similar filter banks can be obtained by dilations and rotation of. through. the generating function: (2.31) where,. 20.
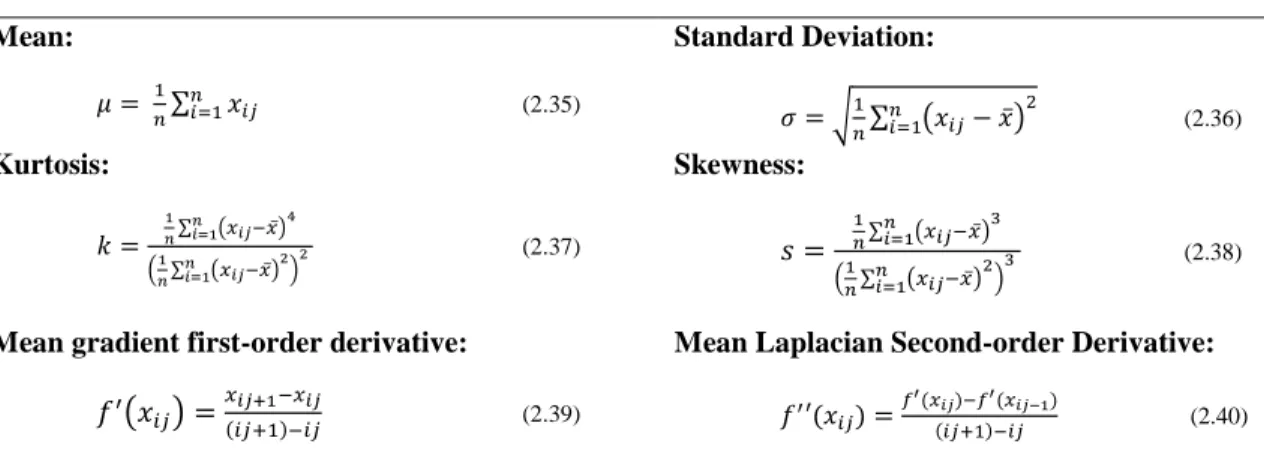
(35) Chapter 2. (2.32) and (2.33) and represent the index for dilation and orientation respectively. S is the total number of dilatations and L is the total number of orientations, orientation s. For a given segmented image. is the angle for each. , the magnitude of filtered image. is obtained by Gabor filter frs: (2.34). Where ―*‖ denotes a 2 dimension convolution operation, and. and. represent the real (even), and imaginary (odd) parts of the Gabor filter (Eq. 10) respectively. Table 2.4. Standard intensity features Mean:. Standard Deviation: (2.35). Kurtosis:. (2.36). Skewness: (2.37). Mean gradient first-order derivative:. (2.38). Mean Laplacian Second-order Derivative: (2.39). (2.40). Where, represents the gray-scale value of pixels in each of the segmented intensity images, and n the total number of evaluated pixels (ij) in the segmented image.. After the features extraction, normalization is a requirement to process data to facilitate the classification; in this way, the extracted features are arranged and transformed in order to attain a group of features in the same order of magnitude (Mery and Soto 2008).. 21.
(36) Chapter 2. To conclude with features management, it is necessary to select the best features before classification. Thus, the principal idea is selecting a minor subset of features from total features that leads to the smallest classification error (Jain et al. 2000; Zhang 2002). In order to reduce the number of features, some strategies are employed. The best strategy should optimize a reduced number of features with the maximal classification hits. Among the useful selection strategies are sequential forward selection (SFS), nearest neighbor (KNN), linear and quadratic discriminant analysis‖ (LDA /QDA) and ―Rank key features by class sorting criteria‖ (RANKFS) based on the ―Relative Operating Characteristic curve‖ (R.O.C) and the ―Student test‖ (Jain et al. 2000; Bishop 2007). 2.3.3. 3. Classification and validation Once objects of interest are selected and measured, it would be desirable to classify or assign them into classes according to selected features. A simple statistical approach is the so-called supervised classification in which training sets of previously defined classes are selected by the operator (Aguilera and Briones 2005). Useful supervised classification algorithms to build decision lines, planes or hyper planes of the selected features are: linear and quadratic discriminant analysis (LDA or QDA), Mahalanobis distance (MD), support vector machine (SVM), and ―Probablistic Neural Network‖ (PNN) (Ren et al. 2006; Leiva et al. 2011; Mery et al. 2010b). Differently, unsupervised classification does not require human to have the prior knowledge of the classes, and it mainly uses some clustering algorithms to classify an image data (Richards and Jia 1994). Classification is done using statistic or clustering algorithms such as K nearest neighbors (kNN), k-means, hierarchical clustering and mixture models, to determine which objects correspond to one or other class. Performance of the classifier is measured as the ratio of correctly classified images in reference to its supervised categorical class to the total number of tested images. Detailed information about statistical pattern recognition can be found in Jain (2000), Duda (Duda et al. 2000), and Bishop (Bishop 2007) . More extensive information about. 22.
(37) Chapter 2. computer vision and image processing can also be found in book and reviews (Sun 2008; Aguilera and Briones 2005; Russ 1998; Gonzalez et al. 2009). 2.3.4.. Applications. The use of color images offers an alternative to visual inspection, and has been broadly used in various foods commodities because it is objective, reliable, rapid, and economical (Brosnan and Sun 2002; Kumar-Patel et al. 2012). Images have been effectively used to classify or recognize quality in several foods including potato chips (Pedreschi et al. 2006; Pedreschi et al. 2007), tortillas (Mery et al. 2010a), pizza (Sun and Brosnan 2003b, a), chocolate chip biscuits (Davidson et al. 2001), cheese (Wang and Sun 2002a, b, 2001), and pork meat (Lu et al. 2000; Faucitano et al. 2005), salmon bones (Mery et al. 2011) In detection or classification of postharvest fruit defects, image processing allows the segregation of different quality degrees for fruits such as olive (Riquelme et al. 2008; Wang et al. 2011a), apple (Xing et al. 2005; De Belie et al. 1999; Unay and Gosselin 2006; Throop et al. 2005,Paulus and Schrevens 1999), bayberry (Zhang et al. 2005, Lu et al. 2010), pistachio (Pearson and Toyofuku 2000) , grape (Zoffoli et al. 2008), blueberry (Leiva et al. 2011; Leiva-Valenzuela and Aguilera 2013), fungally decayed sliced chestnut (Donis-González et al. 2013) , strawberry (Fragaria spp.) (Bato et al. 2000). Comprehensive reviews of non-destructive imaging technology in fruit postharvest have been done by Studman (2001), Brosnan and Sun (2004), Kondo (2010), Wu and Sun (2013b) and Jackman and Sun (2013). However, image processing applications for small fruits are still limited in scope. First studies in sweet cherry, tried to recognize basic fruit parts such as stems (Wolfe and Sandler 1985). Later studies have focused on shape characterization; a comprehensive determination of 3D cherry shapes would permit the understanding of fruit geometry; change of fruit shape with development, effects of environmental factors and differences. 23.
(38) Chapter 2. in fruit shape among cultivars (Beyer et al. 2002). Also, freshness of cherry has been explained by detection of changes in fluorescence images of peduncles correlating chlorophyll properties with color (Linke et al. 2010). This technique not only helped verify quality of cherries, but also better understands the physiology of cherries. Simple applications of computer vision have also allowed the rating of cherries by color since the color of the skin is an important indicator of ripeness and quality in orchard (Rosenberger et al. 2004; Wang et al. 2012a). In-line computer vision systems completed with image processing to segregate or classify fruit are main commercial applications. For strawberries, a traditional mechanical system with sorting algorithms to determine color and size was developed for grading fruit (Liming and Yanchao 2010a). In recent years, some research has been focused on non-destructive recognition of images by extraction of patterns (Figure 2.2) to segregate defective berries such as those decayed, shriveled or mechanically damaged, and distinguish orientation (LeivaValenzuela and Aguilera 2013). Despite the possibilities offered by computational capabilities and new sensors, only a few commercial blueberry sorting systems based on images are available. These commercial systems allow for high-speed sorting (up of 2 tons h-1)for overall detection of berry colors and are able to reject up to 95% of bad fruit in appearance. However, they cannot recognize defects on fruit surfaces such as fungal decay and shriveling. A mobile, visible computer vision system was developed to estimate the yields of wild blueberry (Zaman et al. 2008; Zaman et al. 2010; Zhang et al. 2010). The system implemented algorithms based on a ―blue index‖ which weighted the blue color on the green and red of RGB images, allowing a better detection of mature blueberries in order to design models to mapping the yield of orchards. 24.
(39) Chapter 2. Figure 2.2. Automatic detection of defective blueberries using a computer vision system (Leiva-Valenzuela and Aguilera 2013). 2.4.. Near infrared spectroscopy and hyperspectral imaging. Conventional color or grayscale imaging techniques are inadequate for measuring chemical constituents or internal quality attributes of fresh fruit because they only record the spatial distribution of light intensities over a broadband spectrum without detailed information for individual wavelengths considering that many chemical constituents are only sensitive to specific wavelengths. Differently, visible and near-infrared spectroscopy (NIRS) has become an important non-destructive technique for chemical analysis and quality assessment of agricultural and food products covering the spectral region where many components interact with light in the form of absorption, reflection, transmission at specific wavelengths (Lu 2008). Hyperspectral imaging (HSI) is a more. 25.
(40) Chapter 2. advanced technology that integrates visible and near-infrared spectroscopy and imaging techniques by generation of a spatial map of spectral data. 2.4.1. Hyperspectral imaging equipment A basic hardware hyperspectral imaging system consists of a sample positioning unit, a light source and an imaging unit. Sample positioning unit can consisted of a mobile or static unit depending on the requirement of application. Mobile system is composed of a line belt conveyor, where each sample is placed and moved to the imaging area underneath the imaging unit.. Because a hyperspectral image is composed of multiple spectra, its acquisition of is slower than NIRS and its equipment requires the adaptation of the hardware to operate under the conditions imposed by sensors. There are basically two types of HIS: tunable filter based equipment, which generally acquire hyperspectral images of static samples (Ariana and Lu 2010) push broom or line-scan system, where samples are carefully placed over a sample holding try which is attached to a motorized linear stage. With this system is able to scan samples simultaneously maintaining the control of the sample position, the illumination and the acquisition conditions in order to improve the performance of experimentation (Leiva-Valenzuela et al. 2013). Tungsten halogen lamps usually are used as light source because they are cheap, offer high intensity in the near infrared region and the spectral output is continuous. While in NIR spectroscopy light is focused on a specific zone of fruit, in hyperspectral reflectance imaging light should irradiate the whole surface of sample causing the disadvantage of large amounts of heat generation. Additionally, tungsten halogen lamp has a short operational lifetime. Finally, the spectral characteristic of the output can drift with time, and the radiant energy is not equal in different wavelengths (Cen and He 2007). The imaging unit consisted of camera with imaging sensor, an imaging spectrograph usually attached to the camera to acquire hyperspectral images. This spectrograph is composed for a monochromator and optical components such as collimators, beam. 26.
(41) Chapter 2. splitters, lenses integrating spheres and optical fibres. Monochromator is an optical device that transmits a selectable band of wavelengths selected from the wider range of wavelengths, thus, can produce monochromatic signals. Spectrophotometers are classified according to the type of monochromator: a limited spectral resolution filter instrument (wheel monochromator), a scanning instrument (prism or grating monochromator) is commonly used to select individual frequencies. Fourier transform spectrophotometers generate modulated light using interferometers which convert the time domain signal of the light into a spectrum with Fourier transform. Laser system has multiple specific wavelength laser light sources, hence acts as monochromator, Acoustic optic tunable filter uses optical-band-pass (constituted by an anisotropic crystal which change its optic properties when an acoustic wave is applied) to diffract the light in specific wavelengths by varying the frequency of acoustic signals (Tang et al. 1998). Liquid crystal tunable filter use a birefringent liquid crystal filter to retard light rays which pass through in phase. Therefore, wavelengths can be separated obtaining high spectral resolution when electronically tunable stages in series are combined. Most common by their features photodiode array PDA is being more used. Their high acquisition speed and the absence of moving parts allow online fruit grading implementation. This system is based in the dispersion of radiation by fixed grater which focuses the light onto an array of silicon or Indium Gallium Arsenide photodiode detectors (Nicolaï et al. 2007). Detectors quantify the intensity of reflected or transmitted and selected light by converting photons into electrons. There are two major types of solid state area detector: CCD and CMOS. In both types of cameras, photodiodes are made of light sensitive materials such as Silicon (Si), Indium gallium arsenide (InGaAs), and mercury cadmium tellurium (MCT or HgCdTe) capable to convert radiation energy to electrical signal. The main differences between their, is that both photodetector and read out amplifier in each pixel are included within the CMOS image sensor improving the imaging speed for online industrial inspection. However CMOS cameras acquire images with higher noise and dark current than the CCDs because of the on-chip circuits used to transfer and amplify signals, and as a result of lower dynamic range and sensitivity than CCDs. (Wu and Sun 2013a). Order-blocking 27.
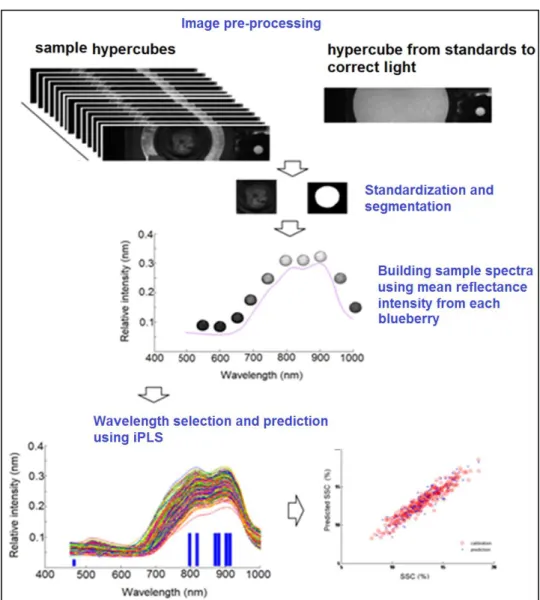
(42) Chapter 2. filter can be installed onto the sensor of the camera to prevent wavelengths below or above the range of measurement; a fixed focal length lens are attached to the front of the spectrograph. 2.4.2.. Sensing modes. In NIRS as well in hyperspectral imaging, products are subjected to NIR radiation in order to measure their spectra The spectral characteristics of the incident ray are modified while it passes through the product due to wavelength dependent absorption and scattering processes (Ruiz-Altisent et al. 2010a). This change depends on the chemical composition of the product, its light scattering properties which are related to the microstructure as well as on the lightning configuration or sensing mode. In hyperspectral imaging generation, light interaction with sample can be classified in three sensing modes: reflectance, where light source and detector are mounted over the sample under a specific angle, thus specular reflection is avoid, transmittance where the light source is positioned opposite to the detector in consequence, the penetration of NIR radiation into fruit tissue decreases exponentially with the depth (Figure 2.4). In the third sensing mode, interactance (not suitable to hyperspectral imaging), the light source and detector are positioned parallel to each other in such a way that light due to specular reflection cannot directly enter the detector by means of a bifurcated cable in which fibers leading to the source and detector are parallel to each other and in contact with the product, or by means of a special optical arrangement (Nicolaï et al. 2007). Generally, reflectance and interactance are related to chemiometric and food microstructure while transmittance has been used in detection of foreign internal materials such as worms or pits (Figure 2.3). 2.4.3.. Hypercube acquisition and spectral image processing. Hyperspectral images are building of hundreds of contiguous wavebands for each spatial position of a product. The resulting spectrum acts like a fingerprint which can be used to characterize the composition of that particular pixel Accordingly, each pixel in a hyperspectral image contains the spectrum of that specific position (Gowen et al. 2007). 28.
(43) Chapter 2. In consequence, each hyperspectral imaging is a conjunct of grayscale images which represents a single band of spectral wavelength. Therefore, hyperspectral image is a conjunct of multiple images acquired at the same time where rows and columns define a spatial position for variables which localized a continuous range of wavelengths (Figure 2.3). Hyperspectral imaging is similar to color imaging in the spatial information, but add spectral information which increase the capacity of sense minor components such chemicals (Wu and Sun 2013a). Additionally, due to NIR light properties, the light penetrates objects in higher degree than in color images allowing the interpretation of internal phenomena. Visible and near infrared (Vis-NIR) covers the spectral region between 400 and 2500 nm providing more structural information about vibration behavior of combinations of bonds. After irradiation of food or agricultural commodities by NIR radiation, the absorption of energy of occurs when organic molecular groups O–H, C–H, C–O and N–H start vibrating (stretching or bending) and specific wavelengths NIR radiation are transformed in heat. In consequence, reflected or transmitted light generates overtones in spectrogram signal allowing the interpretation of differences between compositions of samples. The NIR region is divided into short-wave NIR (SW-NIR) and medium and long wave NIR from 1300 nm. The SW-NIR absorb high overtones band while medium and long wave NIR, first or second overtone. Considering the intensity of absorption decreases when the overtone increases, SW-NIR is usually applied in transmission analysis with long path length and common NIR is used in diffuse reflection analysis (Cen and He 2007).. 29.
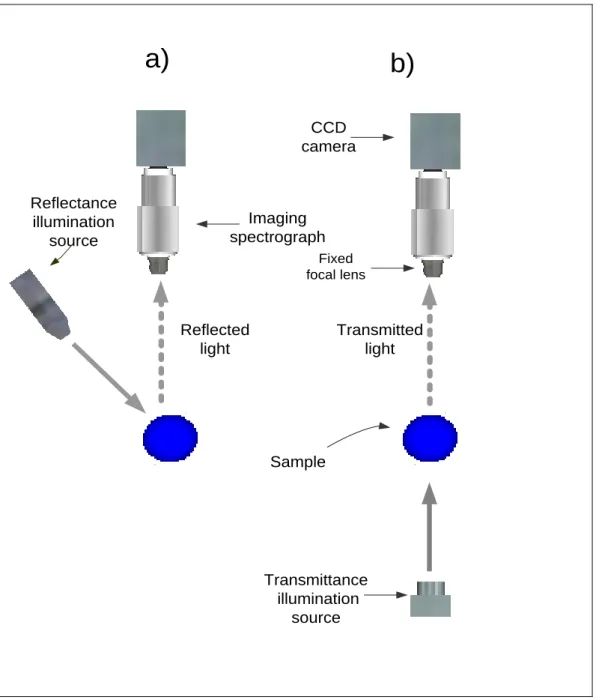
(44) Chapter 2. a). b) CCD camera. Reflectance illumination source. Imaging spectrograph Fixed focal lens. Reflected light. Transmitted light. Sample. Transmittance illumination source. Figure 2.3. Sensing modes in hyperspectral image acquisition a) reflectance, b) transmittance.. 30.
(45) Chapter 2. Figure 2.4. Understanding hyperspectral imaging acquisition 2.4.3.1 Pre-processing For correction of the light source effect, hyperspectral reflectance images are also acquired from diffuse reflectance standard using the same imaging parameters as that for samples. For transmittance images corrections, generally a cylindrical reference disc made from white Teflon is mounted next to the frame of the sample holding unit (Lu and Ariana 2013). Dark current images are acquired with the camera shutter being closed. Therefore, the intensity values for each hyperspectral image are corrected by the reference and transmittance image pixels by pixels in both spatial and spectral dimensions (Ariana and Lu 2010; Tallada et al. 2006):. 31.
Figure
+7
Documento similar
The first method is based on color and texture features extraction, followed by a selection of the most effective features, and classification with a hybrid of artificial
This booklet includes top tips for those who experience a mental health condition to help improve their quality of life and think about their sense of belonging and place in
(1995): Effects of preparation on internal and external memories.. En G.DAVIES, S.M.A
In a survey of 1,833 business management undergraduates in six Ibero-American countries, factor analysis identified three approaches to stakeholder relations, behaviors, and
The objective of this paper is therefore to analyze the interaction of firms’ internal capabilities and external or shared capabilities and their effect on both radical and
Research conducted in this thesis offers a framework of open models of decision support that suggests that the use of internal and external sources of knowledge can be leveraged
AN INTERNAL AND EXTERNAL LOGICAL ANALYSIS OF SANT MATEU TRADITIONAL GAMES PLAYED IN THE XX CENTURY.. Joan
In higher education, when the self-assessed task counted toward final grades, rubrics (a) enhanced performance, (b) reduced performance and avoidance goals, (c) were preferred by
