DOI:10.1051/0004-6361/201628188 c
ESO 2016
&
Astrophysics
The stellar metallicity gradients in galaxy discs
in a cosmological scenario
Patricia B. Tissera
1,2, Rubens E. G. Machado
1, Patricia Sanchez-Blazquez
3, Susana E. Pedrosa
4, Sebastián F.
Sánchez
5, Owain Snaith
6, and Jose Vilchez
71 Departamento de Ciencias Fisicas, Universidad Andres Bello, Av. Republica 220, Santiago, Chile e-mail:[email protected]
2 Millennium Institute of Astrophysics, Av Libertador Bernardo O’Higgins 1058 Santiago, Regiòn Metropolitana, Chile 3 Institute of Astronomy, Pontificia Universidad Católica de Chile, Av. Vicuña Mackena, 4860 Macul, La Florida,
Regiòn Metropolitana, Chile
4 Instituto de Astronomía y Física del Espacio, CONICET-UBA, Casilla de Correos 67, Suc. 28, C1428ZAA, Ciudad Autónoma de Buenos Aires, Argentina
5 Instituto de Astronomía, Universidad Nacional Autónoma de México, A.P. 70-264, 04510 México D.F., Mexico 6 School of Physics, Korea Institute for Advanced Study, 85 Hoegiro, Dongdaemun-gu, 02455 Seoul, Republic of Korea 7 Instituto de Astrofísica de Andalucía (CSIC), Glorieta de la Astronomía s/n, 18008 Granada, Spain
Received 25 January 2016/Accepted 21 April 2016
ABSTRACT
Context.The stellar metallicity gradients of disc galaxies provide information on disc assembly, star formation processes, and chem-ical evolution. They also might store information on dynamchem-ical processes that could affect the distribution of chemical elements in the gas phase and the stellar components. Understanding their joint effects within a hierarchical clustering scenario is of paramount importance.
Aims.We studied the stellar metallicity gradients of simulated discs in a cosmological simulation. We explored the dependence of the stellar metallicity gradients on stellar age and on the size and mass of the stellar discs.
Methods.We used a catalogue of galaxies with disc components selected from a cosmological hydrodynamical simulation performed including a physically motivated supernova feedback and chemical evolution. Disc components were defined based on angular mo-mentum and binding energy criteria. The metallicity profiles were estimated for stars with different ages. We confront our numerical findings with results from the Calar Alto Legacy Integral Field Area (CALIFA) Survey.
Results.The simulated stellar discs are found to have metallicity profiles with slopes in global agreement with observations. Low stellar mass galaxies tend to have a larger variety of metallicity slopes. When normalized by the half-mass radius, the stellar metallicity gradients do not show any dependence and the dispersion increases significantly, regardless of the galaxy mass. Galaxies with stellar masses o f around 1010M
show steeper negative metallicity gradients. The stellar metallicity gradients correlate with the half-mass radius. However, the correlation signal is not present when they are normalized by the half-mass radius. Stellar discs with positive age gradients are detected to have negative and positive metallicity gradients, depending on the relative importance of recent star formation activity in the central regions.
Conclusions.Our results suggest that inside-out formation is the main process responsible for the metallicity and age profiles. The large dispersions in the metallicity gradients as a function of stellar mass could be ascribed to the effects of dynamical processes such as mergers, interactions and/or migration as well as those regulating the conversion of gas into stars. The fingerprints of the inside-out formation seem better preserved by the stellar metallicity gradients as a function of the half-mass radius.
Key words. galaxies: abundances – galaxies: formation – galaxies: fundamental parameters
1. Introduction
Chemical patterns, such as the mass-metallicity relation, the age-metallicity relation, and age-metallicity gradients, store relevant in-formation on the history of galaxy assembly. Among these pat-terns, observational results show that slope of the gas-phase metallicity gradients correlates with stellar mass if expressed in dex kpc−1, but that this correlation is erased if the
metallic-ity gradients are renormalized by adopting a characteristic scale length for the disc component (e.g.Garnett et al. 1997;Sánchez et al. 2014; Ho et al. 2015; Sánchez-Menguiano et al. 2016). Similar results are found for discs formed in hydrodynami-cal cosmologihydrodynami-cal simulations (Tissera et al. 2015) and by using analytical models (Prantzos & Boissier 2000; Ho et al. 2015).
Both observational and theoretical results favour the existence of metallicity gradients, the origin of which would be linked to the joint action of gas outflows and inflows that regulate star formation activity and chemical abundances (e.g.Chiappini et al. 2001;Mollá & Díaz 2005;Gibson et al. 2013;Mott et al. 2013). An important fraction of the synthesized chemical ele-ments, however, is locked into stellar populations (SPs) as the gas is transformed into stars. Hence, the chemical abundances of the SPs provide complementary information to understand the chemical loop between the gas-phase medium and the SPs within a context of galaxy formation (e.g.Calura et al. 2012; Tissera et al. 2012).
of the chemical properties of the underlying SPs is more dif-ficult. Estimations for the Milky Way and some nearby galax-ies suggested the existence of negative metallicity slopes (e.g. Bland-Hawthorn & Freeman 2003;Carraro et al. 2007;Hughes et al. 1994; Kudritzki et al. 2008). The metallicity proper-ties of the SPs in galaxies outside the Local Group have been studied using colour distributions. In these works, the colour gradients are interpreted as the result of the contribution of younger and less enriched stars to the outer parts (e.g.de Jong 1996;MacArthur et al. 2004;Muñoz-Mateos et al. 2007). Two-dimensional (2D) observations of nearby galaxies with detailed information on the age and metallicities of SPs are being gath-ered. As a result, more robust properties of the SPs in nearby galaxies are available (e.g.Rosales-Ortega et al. 2010). In partic-ular,Sánchez-Blázquez et al.(2014) reported normalized metal-licity gradients of SPs in the disc components for a set of face-on spirals in the CALIFA survey. Similar to the results reported for the gas-phase normalized metallicity gradients (Sánchez et al. 2014), the SP normalized metallicity slopes were not found to correlate with the global properties of galaxies such as stellar mass or luminosity. A weak trend for old SPs (>6 Gyr) to show steeper metallicity gradients than younger SPs (<2 Gyr) was re-ported. The metallicity and age gradients of galaxies with a va-riety of morphology are analysed by González Delgado et al. (2015). These authors also find a dependence of both gradients on stellar mass (or the potential well). In particular they found that spiral galaxies have negative metallicity and age profiles in agreement with an inside-out formation. For disc-dominated galaxies, they identified the steeper negative metallicity slopes to take place for intermediate stellar mass galaxies (Mollá & Díaz 2005).
The metallicity gradients of the SPs are the result of the com-bination of stars formed at different epochs from gas in the in-terstellar medium (ISM) that have different physical and chem-ical properties. Disentangling their contributions is a complex task, albeit crucial to build up a comprehensive understanding of how star formation, chemical production, and mixing take place in galaxies. Mergers and interactions are known to be efficient mechanisms to redistribute angular momentum and, as a con-sequence, they can affect the metallicity distribution of gas and stars. The action of migration was also claimed to be important in shaping the metallicity gradients, and flattening the abundance profiles of the SPs, principally of the old SPs (e.g.Friedli et al. 1994;Roškar et al. 2008;Di Matteo et al. 2013). However, more realistic simulations where the vertical velocity of the stars is taken into account suggest that strong migration might be pre-vented (Minchev et al. 2014).
In the current cosmological paradigm, galaxy formation is a complex process that involves the action of different physi-cal mechanisms acting with different temporal and spatial scales. In this context, hydrodynamical simulations that include chem-ical evolution are powerful tools to study the relation between chemical patterns and the history of galaxy assembly (e.g. Mosconi et al. 2001;Scannapieco et al. 2006;Tissera et al. 2012; Vogelsberger et al. 2014;Schaye et al. 2015). Similarly, chemo-dynamical models have extensively analysed the formation of metallicity gradients in disc galaxies (e.g.Chiappini et al. 1997; Mollá et al. 1997; Ho et al. 2015). Within a hierarchical clus-tering scenario, different mechanisms play a role in the assem-bly history of galaxies, however most numerical works suggest an inside-out formation for the disc components (Scannapieco et al. 2009;Brook et al. 2012;Few et al. 2012;Minchev et al. 2014). Particularly,Pilkington et al.(2012) analysed the metal-licity gradients of the young SPs as tracers of the gas-phase
metallicity, finding that the efficiency of star formation as a func-tion of radius was a main factor in determining the metallicity gradients. As expected, different supernova (SN) feedback mod-els produced different results (Gibson et al. 2013;Snaith et al. 2013).Tissera et al.(2015) analysed the metallicity gradients of the gas phase of the same set of simulated galaxies analysed in our work. They detected a trend for the gas-phase metallicity slopes to correlate with stellar mass. These authors found a rela-tionship between the efficiency of star formation and the slope of the gas-phase metallicity profile in agreement with the observa-tions ofStott et al.(2014). According to detailed numerical sim-ulations of prepared merger events, these relationships could be the result of the action of violent events in the regulation of star formation and chemical mixing (Tissera et al. 2015; and Sillero, in prep.).
In this work, we focus on the study of the metallicity gra-dients of the SPs in the disc components of the same simulated galaxies whose gas-phase components were analysed byTissera et al.(2015) in the redshift range [0, 2). We use the 12+log O/H abundance ratios and explore correlations with other physical parameters such as stellar mass and half-mass radius. We also extended the analysis of the metallicity gradients for SPs with different ages. We performed this analysis with a two-fold goal: searching for clues for galaxy formation and setting constraints on our galaxy formation model. The paper is organized as fol-lows. Section 2 explains the main characteristics of the numeri-cal models and the galaxy catalogue. Section 3 is dedicated to the analysis of the SP metallicity gradients. Our conclusions sum-marize the main findings.
2. Numerical experiments
We analysed the stellar disc components of simulated galax-ies selected from a cosmological simulation performed with a version of the code GADGET-3, an update of GADGET-2 (Springel 2005), optimized for massive parallel simulations of highly heterogeneous systems. This version includes treatments for metal-dependent radiative cooling, stochastic star formation (SF), chemical enrichment, and the multiphase model for the ISM and the SN feedback scheme ofScannapieco et al.(2005, 2006). The SN feedback model is able to successfully trig-ger galactic mass-loaded winds without introducing mass-scale parameters.
−2
−1
0 1 2
y
/
reff
−2 −1 0 1 2
x/reff
−2
−1
0 1 2
z
/
reff
−2 −1 0 1 2
x/reff
−2 −1 0 1 2
x/reff
6.0 6.5 7.0 7.5
logΣ⋆(M⊙kpc−2)
7.6 7.8 8.0 8.2
12+log(O/H)
2 4 6 8
age(Gyr)
Fig. 1.Surface mass density, oxygen abundance, and ages for the SPs in a simulated discs shown for illustration purposes (only stars with <0.5 were included). Each frame is 5reffwide and the half-mass radius of this stellar disc isreff=11 kpc.
As mentioned in the Introduction, we analysed the SPs of the simulated disc components whose gas-phase medium was studied by Tissera et al.(2015). They were selected from the so-called S230D simulation, whose initial conditions are con-sistent with the concordance model withΩΛ = 0.7,Ωm = 0.3,
Ωb =0.04, a normalization of the power spectrum ofσ8 =0.9
and H0 = 100 h km s−1 Mpc−1, with h = 0.7. The
simu-lated volume represents a box of 14 Mpc comovil side, resolved with 2×2303 initial particles, achieving a mass resolution of
5.9 ×10⁶ h−1M and 9.1 ×10⁵ h−1 M for the dark matter and initial gas particles, respectively. The gravitational soften-ing is 0.7 kpc. We acknowledge the fact that the initial condition represents a small volume of the Universe. It was chosen to rep-resent a typical region with no large structure nearby.De Rossi et al. (2013) verified that the growth of the haloes was repro-duced well by confronting the halo mass function with those ob-tained from the Millennium simulation (Fakhouri et al. 2010).
Simulation S230D used a high gas density threshold for the star formation and an energy per SN event of 0.7×1051erg. This
combination diminishes the over transformation of gas into stars at very high redshift. Simulation S230D injects 80 per cent of the new synthesized chemical elements into the cold phase (the remaining is pumped directly into the hot phase). Our code also includes the chemical evolution model developed by Mosconi et al. (2001). Chemical elements produced by SNII and SNIa events are estimated by adopting the chemical yields ofWoosley & Weaver (1995) and Iwamoto et al. (1999), respectively. We follow 12 individual chemical elements (such as16O and56Fe)
and that SNII yields are metallicity dependent (Mosconi et al. 2001).
2.1. The simulated galaxy sample
The simulated galaxy sample was constructed by using a friends-of-friends algorithm to identify the virialized structures. Then the substructures were selected using the SUBFIND scheme (Springel et al. 2001). To identify the disc components, we used the angular momentum content of each particle defined as
=Jz/Jz,max(E), whereJzis the angular momentum component in the direction of the total angular momentum andJz,max(E) is
the maximum Jz over all of the particles at a given binding en-ergy, E. The details are explained inTissera et al. (2012) and Pedrosa & Tissera(2015). We considered star particles with
higher than 0.5 to be part of the stellar disc. The star particles that did not satisfy this requirement were taken to belong to the spheroidal component and are not analysed in this paper. We do not distinguish between thin and thick discs. They are both in-cluded in the analysed stellar disc components. To diminish reso-lution issues, we restricted our study to systems with the number of star particles larger than 2000 in the disc components. With this criterium, 37 galaxies were selected atz∼0.
The simulated galaxies analysed in this paper were also stud-ied byPedrosa & Tissera(2015). These authors focused on the angular momentum content of the disc and bulge components, finding that the simulated galaxies are able to reproduce ob-served trends reported by Romanowsky & Fall(2012). Hence, we expect the sizes of the simulated galaxies to be in agree-ment with observations. Tissera et al. (2015) studied the gas-phase metallicity gradients of the same galaxies we analysed in this paper in relation to the specific star formation of the galax-ies. These authors reported that these galaxies reproduced ob-servational trends at z ∼ 0. In agreement with observations, Tissera et al.(2015) showed that simulated gas-phase metallic-ity slopes of these low stellar mass galaxies exhibit a larger va-riety. As a function of redshift, these authors found an increas-ing fraction of gas-phase metallicity profiles with negative slopes (<−0.1 dex kpc−1 in galaxies withM <1010.5 M). More mas-sive galaxies showed a larger frequency of positive metallicity slopes for higher redshifts.
We use the CALIFA sample of Sánchez-Blázquez et al. (2014) to confront the simulated trends at z ∼ 0 since it is a
self-consistent sample and the stellar mass range covered is sim-ilar to our simulated mass range. For the purpose of comparison, we use the mass-weighted metallicity gradients. We note that the observed half-mass radii are defined from the surface luminos-ity distributions, while we use the half-mass radius of the stellar disc components. This should be taken into consideration when comparing the normalized gradients.
3. Metallicity and age gradients of the SPs
We estimated the radial abundance gradients and age profiles of the disc SP. We performed linear regression fits to the profiles in the range [0.5,1]reff, wherereff is the radius that enclosed half of the stellar mass of the disc components. We find that this ra-dial region provides stable and good fits for our profiles and is within the radial range chosen bySánchez-Blázquez et al.(2014) for the analysis of the SP gradients in a set of face-on spiral galaxies of the CALIFA survey, which we use to compare with our simulated data. This is also the spatial range adopted to fit the gas-phase metallicity gradients byTissera et al.(2015). The linear regressions are performed by applying a bootstrap tech-nique. In Fig.2we show the metallicity and age profiles (upper and lower panels, respectively) for the same galaxy depicted in Fig.1. The goodness of the fittings are shown with the shaded areas (95 per cent confidence bands).
3.1. Metallicity gradients
Figure3shows the metallicity slopes in units of dex kpc−1(upper
panel) and the renormalized slopes usingreff (lower panel) as a function of the stellar mass of the galaxies. For comparison, we also include the observational estimations reported by Sánchez-Blázquez et al.(2014).
We define two subsamples by adopting the stellar mass limit,
M < 1010.5 M, similar to the analysis carried out byTissera
et al.(2015) for the gas-phase metallicity profiles, to quantify a possible dependence on the stellar mass. From Fig. 3 and Table1, we can see that the non-normalized metallicity slopes show a very weak dependence on stellar mass. Galaxies in the low stellar mass subsample have a median metallicity slope of
−0.04±0.01 dex kpc−1, while those in the high stellar mass
subsample have−0.03±0.02 dex kpc−1. The median slopes and
errors were estimated by applying a bootstrap resampling tech-nique. In Table1we also include the standard dispersions. The
8.0
Fig. 2.Metallicity and age profiles for the SPs in the stellar disc compo-nent of the galaxy shown in Fig.1(thin grey lines). The thick red lines are the linear fits within the region 0.5<r/reff <1. The shaded areas
represent the 95 per cent confidence bands of the fits.
most significant variation with stellar mass is the increase of the dispersion of the metallicity slopes measured in the low stellar mass galaxies.
We performed similar estimations for the normalized SP metallicity gradients, (dexr−1
eff). As shown in the lower panel of from Fig.3, there is no dependence on stellar mass and the dis-persion increases significantly for all galaxies (Table1). There are galaxies with normalized metallicity profiles with positive slopes at the two extreme of the stellar mass range, and simi-lar behaviour is also present for the CALIFA slopes. In the case of those at the lower mass end, the fittings have a larger dis-persion. The Spearman test of correlation yields no signal of correlation for both distributions:r = −0.11,p = 0.51 for the
non-normalized relation andr=−0.19,p=0.27 for the
normal-ized relation. The gas-phase metallicity gradients of these simu-lated galaxies show clear trends with stellar mass as reported by Tissera et al.(2015). The weakness of the signal could be due to the action of dynamical processes or different star formation effi -ciencies. The SN feedback adopted for this simulation is able to regulate the transformation of gas into stars naturally in different potential wells (de Rossi et al. 2010). Interestingly, the simu-lated discs are able to reproduce a trend of having steeper nega-tive metallicity gradients for masses around 1010 M
,as shown bySánchez-Blázquez et al.(2014) andGonzález Delgado et al. (2015). See alsoMollá & Díaz(2005) for similar results by using analytical models.De Rossi et al.(2013) showed that there is a change in the effects of the SN feedback around this stellar mass from the combined effects of the SN strengths and the potential well of the systems. These changes affect the gas cooling time, star formation activity, and the amount of metals ejected in galac-tic winds. We speculate that these processes might also leave an imprint in the chemical gradients. A large statistical sample is needed to confirm these trends.
9 9.5 10 10.5 11
Fig. 3. Slopes of the non-normalized (upper panel) and normalized (lower panel) metallicity gradients of the SPs in the disc components as a function of total stellar mass of the simulated galaxies (solid, blue cir-cles). The error bars correspond to a bootstrap error of the linear regres-sion fits. Observations from the CALIFA survey by (Sánchez-Blázquez
et al. 2014; open yellow squares) were included for comparison.
reff, which got erased if the gradients were normalized by a char-acteristic scale length. To test the existence of such a correlation for the simulated SPs, in Fig.4we show the relation for the simu-lated discs. In this case, we find a clearer signal of correlation for the non-normalized gradients:r∼ 0.38,p ∼0.02. The
correla-tion signal significantly decreases for the normalized gradients:
r∼0.031,p∼0.86.
Since the characteristic radiusreffseems to play a significant role, it is important to show that the simulatedreff are in agree-ment with observations. In Fig. 5 we show a function of stel-lar mass together with recent observations byvan der Wel et al. (2014) andSánchez-Blázquez et al.(2014). The plot shows that the mean values are consistent with observations byvan der Wel et al.(2014) within a standard deviation for late-type galaxies as expected since most of our galaxies have active star forma-tion (Tissera et al. 2015). However, at the more massive end, our simulated systems show larger values than the reported av-erages. The simulatedreff are in very good agreement with those estimated from the CALIFA survey1.
1 We also fitted exponential discs to the mass surface density and cal-culated thereff from the disc scale lengths. These values agreed with
those estimated directly from the mass distributions.
5 10 15
Fig. 4.Slopes of the non-normalized (upper panels) and normalized (lower panels) metallicity gradients of the SPs in the disc components as a function ofreff(solid blue circles). The error bars correspond to the
bootstrap errors of the linear regression fits.
109 1010 1011
Fig. 5.Meanreff of the stellar disc components as a function of total
stellar mass of the simulated galaxies (solid blue circles) for the ob-servational estimations byvan der Wel et al.(2014) for early-type (red inverted triangles) and late-type (blue triangles) galaxies and for obser-vations of the disc galaxies in the CALIFA survey (Sánchez-Blázquez
et al. 2014; open yellow squares).
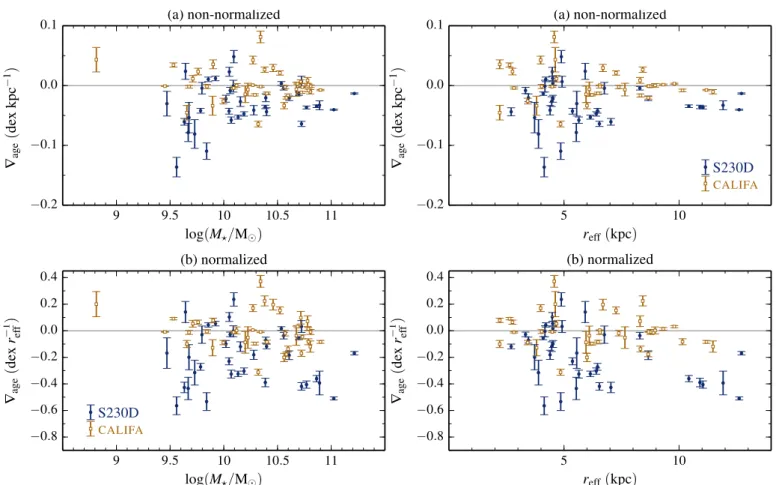
3.2. Age gradients
9 9.5 10 10.5 11
Fig. 6.Slopes of non-normalized (upper panel) and normalized (lower panel) age gradients of the SPs as a function of the stellar mass (left panels) andreff (right panels) of the simulated galaxies. Similarly, observations from the CALIFA survey (Sánchez-Blázquez et al. 2014; open yellow
squares) were included for comparison.
formed first and have higher density gas to feed the star forma-tion activity. Although this might be the case on global terms, mergers and interactions as well as secular evolution could con-tribute to flatten or to build positive age and/or metallicity pro-files as shown in previous works (e.g.Rupke et al. 2010;Perez et al. 2011). Migration could also cause old stars to populate outer regions, flattening the age and metallicity distributions. Minor mergers might also add old stars to the outer parts of the discs (Abadi et al. 2003;Tissera et al. 2012).
We fit linear regressions to the age profiles following the same procedure as in the case of the metallicity profiles. In Fig.6, we show the age gradients as a function of the stellar mass of the simulated galaxies. On average, the mean age gradients are negative as expected for inside-out histories of formation. The slopes of the age profiles show a very mild dependence on stel-lar mass. In Table1 we show the median age gradients for the two stellar-mass subsamples. The normalized age slopes show similar behaviour, again with a large dispersion. The Spearman test shows a very weak signal for the non-normalized relations (r = 0.19,p = 0.26; upper panel) and no signal at all for the normalized relation (r=−0.044,p=0.80; lower panel).
As a function ofreff, the age gradients show no clear signal of correlation. This might be caused by the intrinsic dispersion in stellar age or by the low number of galaxies. In analytical mod-els, a parallel behaviour between metallicity and age could be expected but the relations are more complex when the non-linear assembly of structure is considered. In fact, the age profiles could be more affected by a fraction of young stars as a function of radius. In our simulation, there are high metallicity stars of all
ages, although they tend to be younger than low-metallicity stars on average.
We note that there are steeper negative normalized age gra-dients in the simulation than in the observations reported by Sánchez-Blázquez et al.(2014). These age profiles with steeper negative slopes could be the result of a difference in the es-timation of the reff and/or of the action of physical processes poorly described in our model or of differences in the galaxy sample.
Table 1.Median metallicity (∇Z) and age(∇age) gradients for the normalized (dexr−1
eff) and non-normalized (dex kpc−1) stellar profiles.
M? ∇Z ∇Z ∇age ∇age
(M) (dex kpc−1) (dexr−1
eff) (dex kpc−1) (dexre−ff1) Simulation <>10101010..55 −−00..0403±±00..02 (001 (0..05)04) −−00..2621±±00..10 (007 (0..27)18) −−00..0402±±00..01 (001 (0..02)04) −−00..2317±±00..12 (006 (0..20)19)
Notes.The medians and the errors are estimated via a bootstrapping technique (the standard deviations are given within parentheses).
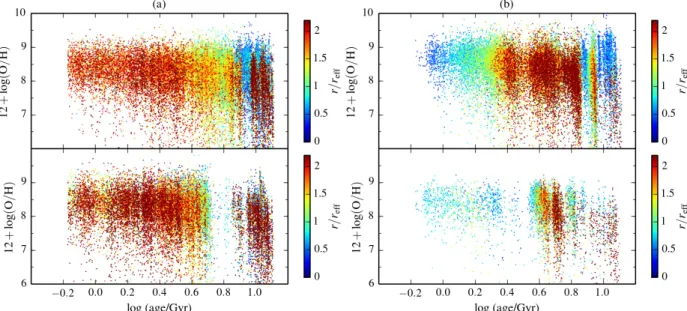
Fig. 7.Age-metallicity relation for simulated galaxies:a)negative age gradients (upper-leftgalaxy:∇age=−0.41;∇Z =−0.34;lower-leftgalaxy: ∇age =−0.40;∇Z =−0.14) andb)positive age gradients (upper-rightgalaxy:∇age =0.32;∇Z =−0.34;lower-rightgalaxy:∇age =0.10;∇Z = −0.14). The colours denote the distance to the centre of mass in units of thereff. Each point depicts a star particle representing a single SP. The
relation between old and new SPs clearly differs and is responsible for the different age profiles in the simulations.
gas (i.e. the slope of the gas-phase metallicity gradients) and the relative fraction of young-to-old stars present in the central regions.
As an illustration, in Fig.7we show the age-metallicity rela-tion for two galaxy discs with positive (right panel) and negative (left panel) age gradients that have negative metallicity slopes. From this figure we can see that the galaxies with positive age slopes have a larger fraction of young stars within reff. Those with negative age slopes have young stars formed mainly in the outer parts of the discs or more evenly distributed along the discs. We expect positive age slopes if there is available gas to form stars in the central regions and this might happen if the gas is transported inwards by tidal torques produced during interac-tions with nearby satellites or galaxies.
We also find that old stars are present at all radii. In partic-ular, in Fig.7the presence of old stars in the outer regions can be clearly seen. This could be ascribed in part to migration pro-cesses (e.g.Spitoni et al. 2015) or bar diffusion (Brunetti et al. 2011). It should be also mentioned that the accretion of satellite galaxies could also contribute with old stars in the outer parts (Abadi et al. 2003;Tissera et al. 2012).
Hence, it might be possible to have galaxies with positive age profiles that have experienced secular evolution recently but their metallicity gradients still show negative slopes. This situa-tion adds noise to observasitua-tions and may prevent us from drawing clear conclusions in relation to the presence of bars and their im-pact on metallicity slopes (Sánchez-Blázquez et al. 2014).
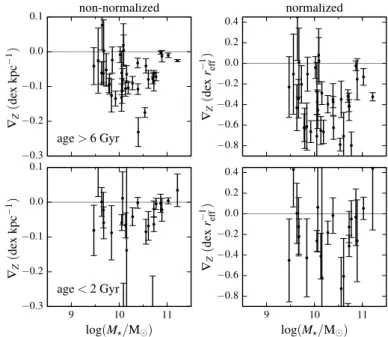
3.3. Metallicity gradients for old and young stars
Sánchez-Blázquez et al.(2014) reported a trend, albeit weak, for the old SP to have normalized metallicity profiles with steeper negative slopes than those determined by young stars. We es-timated the metallicity profiles for stars older than 6 Gyr and younger than 2 Gyr for both normalized and non-normalized profiles to evaluate this trend in our simulated galaxies. Figure8 shows the estimated metallicity gradients. The median values have a mild trend for the old populations to have steeper metal-licity gradients (−0.06±0.01 dex kpc−1) compared to the young
populations (−0.04±0.02 dex kpc−1). A stronger trend is found for the normalized metallicity slopes although with larger boot-strap errors and dispersions (Table2).
Table 2.Median metallicity gradients, both normalized to the effective radius of each disc (in dexr−1
Notes.Galaxies are separated into two subsamples according to stellar mass, and the gradients were measured separately for the old and young SPs. Errors are as in Table1.
Fig. 8. Slopes of the normalized metallicity profiles of the old SP (>6 Gyr) vs. those of the young SP (<2 Gyr) for the simulated disc components.
that the old populations are primarily responsible for this be-haviour in the simulation (Figs.3and4).
The gas-phase metallicity profiles show a clearer dependence on stellar mass as reported by Tissera et al. (2015), however, the SPs are not able to preserve this correlation in our simula-tions and, even for the younger stars, the signal is very weak. This suggests the action of mechanisms that contribute to mix up stars such as mergers/interactions and/or migration, as previ-ously mentioned.
4. Conclusions
We studied the metallicity and age gradients of the stellar discs
z ∼ 0 in a hierarchical clustering scenario with the aim of
analysing whether they reproduce observational trends and how they depend on stellar mass. The metallicity gradients reflect the enrichment of the ISM at the time of star formation and, hence, can store information that is relevant to understand the star for-mation process, the enrichment cycle, and the effects of galaxy assembly.
The non-normalized metallicity gradients of the SPs show a very weak dependence on stellar mass of the galaxies, which is erased when normalized byreff. There is a large variety of nor-malized metallicity gradients. The results are in global agree-ment with those reported by the CALIFA survey (
Sánchez-−0.3
Fig. 9. Normalized (left panels) and non-normalized (right panels) metallicity slopes as a function of stellar mass separated into two sub-populations: old (>6 Gyr; upper panels) and young<2 Gyr; lower panels).
Blázquez et al. 2014), considering the differences in the defi-nition of the scale lengths (Sect. 3). Our simulated discs show the steeper metallicity gradients for galaxies with stellar masses around 1010 M
in agreement with observational results (e.g. González Delgado et al. 2015).
The simulated reff of the stellar discs as a function of stellar mass are consistent with observational estimations by van der Wel et al.(2014) and bySánchez-Blázquez et al.(2014) within a standard deviation. Our simulated stellar discs are formed by conserving the specific angular momentum content (Pedrosa & Tissera 2015) with mean values in agreement with observations (Romanowsky & Fall 2012). These are important achievements for our simulations considering that the free pa-rameters were not fixed to reproduce these mean values.
the discs and mix the gas and SPs, thereby producing changes in the relation. As reported in previous works, we expect merg-ers to be the one of the most important mechanisms responsible for driving inflows that contribute to produce positive metallicity and/or age profiles (Rupke et al. 2010;Perez et al. 2006,2011). In fact, the metallicity gradients may change back to negative but they tend to remain with values above the original values. Also, the ejection of enriched material from the central regions by SN outflows could be re-accreted in the external regions of the discs later on, and contribute to flattening the metallicity profiles (Perez et al. 2011).
The simulated stellar discs show negative age profiles that, on average, are consistent with an inside-out history of forma-tion. There are some discs with positive (or close to flat) age gradients that can be linked to the recent formation of stars in the central region r/reff < 1. These cases could be related to galaxies with a recent history of galaxy interactions that have driven gas inflows. The metallicity profiles are weakly modified since recent gas infalls would tend to transport already enriched material. Conversely the age profiles are strongly modified by these new stars since the dynamical range covered by age is much larger. Our results suggest that, in some cases, relating the presence of a bar responsible for gas inflow with the slope of metallicity profile might not be so direct.
The SPs show metallicity profiles with different slopes when they are separated according to age. The metallicity gradients of young (<2 Gyr) stars tend to be slightly flatter than those of the old (>6 Gyr) stars. These trends are in agreement with results from CALIFA survey and the Milky Way (Maciel et al. 2003).
Overall, our findings suggest that the underlying process that is responsible for determining the age and metallicity profiles is the inside-out formation of discs with specific angular momen-tum conservation. In spite of this, dynamical processes that can disturb the stellar distributions, together with those that affect the transformation of gas into stars, play an important role.
Acknowledgements. Support for P.B.T. is provided by the Ministry of Economy, Development, and Toursim’s Millennium Science Initiative through grant IC120009, awarded to The Millennium Institute of Astrophysics, MAS. R.E.G.M. acknowledges support from Ciência sem Fronteiras (CNPq, Brazil). This work was partially supported by PICT 2011-0959 (ANCyT, Argentina) and PIP 2012-0396 (Conicet, Argentina). PBT acknowledges partial support from the Regular Grant UNAB 2014, Nucleo UNAB 2015 (DI-677-15/N) of Universidad Andres Bello and Fondecyt 1150334 (Conicyt).
References
Abadi, M. G., Navarro, J. F., Steinmetz, M., & Eke, V. R. 2003,ApJ, 591, 499
Bland-Hawthorn, J., & Freeman, K. C. 2003, in Star Formation Through Time, eds. E. Perez, R. M. Gonzalez Delgado, & G. Tenorio-Tagle,ASP Conf. Ser., 297, 457
Brook, C. B., Stinson, G. S., Gibson, B. K., et al. 2012,MNRAS, 426, 690
Brunetti, M., Chiappini, C., & Pfenniger, D. 2011,A&A, 534, A75
Calura, F., Gibson, B. K., Michel-Dansac, L., et al. 2012,MNRAS, 427, 1401
Carraro, G., Geisler, D., Villanova, S., Frinchaboy, P. M., & Majewski, S. R. 2007,A&A, 476, 217
Chiappini, C., Matteucci, F., & Gratton, R. 1997,ApJ, 477, 765
Chiappini, C., Matteucci, F., & Romano, D. 2001,ApJ, 554, 1044
de Jong, R. S. 1996,A&S, 313, 45
de Rossi, M. E., Tissera, P. B., & Pedrosa, S. E. 2010,A&A, 519, A89
De Rossi, M. E., Avila-Reese, V., Tissera, P. B., González-Samaniego, A., & Pedrosa, S. E. 2013,MNRAS, 435, 2736
Di Matteo, P., Haywood, M., Combes, F., Semelin, B., & Snaith, O. N. 2013,
A&A, 553, A102
Fakhouri, O., Ma, C.-P., & Boylan-Kolchin, M. 2010,MNRAS, 406, 2267
Few, C. G., Gibson, B. K., Courty, S., et al. 2012,A&A, 547, A63
Friedli, D., Benz, W., & Kennicutt, R. 1994,ApJ, 430, L105
Garnett, D. R., Shields, G. A., Skillman, E. D., Sagan, S. P., & Dufour, R. J. 1997,ApJ, 489, 63
Gibson, B. K., Pilkington, K., Brook, C. B., Stinson, G. S., & Bailin, J. 2013,
A&A, 554, A47
González Delgado, R. M., García-Benito, R., Pérez, E., et al. 2015,A&A, 581, A103
Ho, I.-T., Kudritzki, R.-P., Kewley, L. J., et al. 2015,MNRAS, 448, 2030
Hughes, S. M. G., Stetson, P. B., Turner, A., et al. 1994,ApJ, 428, 143
Iwamoto, K., Brachwitz, F., Nomoto, K., et al. 1999,ApJS, 125, 439
Kudritzki, R.-P., Urbaneja, M. A., Bresolin, F., et al. 2008,ApJ, 681, 269
MacArthur, L. A., Courteau, S., Bell, E., & Holtzman, J. A. 2004,ApJS, 152, 175
Maciel, W. J., Costa, R. D. D., & Uchida, M. M. M. 2003,A&A, 397, 667
Minchev, I., Chiappini, C., & Martig, M. 2014,A&A, 572, A92
Mollá, M., & Díaz, A. I. 2005,MNRAS, 358, 521
Mollá, M., Ferrini, F., & Díaz, A. I. 1997,ApJ, 475, 519
Mosconi, M. B., Tissera, P. B., Lambas, D. G., & Cora, S. A. 2001,MNRAS, 325, 34
Mott, A., Spitoni, E., & Matteucci, F. 2013,MNRAS, 435, 2918
Muñoz-Mateos, J. C., Gil de Paz, A., Boissier, S., et al. 2007,ApJ, 658, 1006
Pedrosa, S., & Tissera, P. 2015, Boletin de la Asociaciòn Argentina de Astronomia, 57, 14
Perez, J., Michel-Dansac, L., & Tissera, P. B. 2011,MNRAS, 417, 580
Perez, M. J., Tissera, P. B., Scannapieco, C., Lambas, D. G., & de Rossi, M. E. 2006,A&A, 459, 361
Pilkington, K., Gibson, B. K., Brook, C. B., et al. 2012,MNRAS, 425, 969
Prantzos, N., & Boissier, S. 2000,MNRAS, 313, 338
Romanowsky, A. J., & Fall, S. M. 2012,ApJS, 203, 17
Rosales-Ortega, F. F., Kennicutt, R. C., Sánchez, S. F., et al. 2010,MNRAS, 405, 735
Roškar, R., Debattista, V. P., Stinson, G. S., et al. 2008,ApJ, 675, L65
Rupke, D. S. N., Kewley, L. J., & Chien, L. 2010,ApJ, 723, 1255
Sánchez, S. F., Rosales-Ortega, F. F., Iglesias-Páramo, J., et al. 2014,A&A, 563, A49
Sánchez-Blázquez, P., Rosales-Ortega, F. F., Méndez-Abreu, J., et al. 2014,
A&A, 570, A6
Sánchez-Menguiano, L., Sánchez, S. F., Pérez, I., et al. 2016,A&A, 587, A70
Scannapieco, C., Tissera, P. B., White, S. D. M., & Springel, V. 2005,MNRAS, 364, 552
Scannapieco, C., Tissera, P. B., White, S. D. M., & Springel, V. 2006,MNRAS, 371, 1125
Scannapieco, C., White, S. D. M., Springel, V., & Tissera, P. B. 2009,MNRAS, 396, 696
Schaye, J., Crain, R. A., Bower, R. G., et al. 2015,MNRAS, 446, 521
Snaith, O. N., Tissera, P. B., Pedrosa, S., de Rossi, M. E., & Vílchez, J. M. 2013,
Asociacion Argentina de Astronomia La Plata Argentina Book Series, 4, 129
Spitoni, E., Romano, D., Matteucci, F., & Ciotti, L. 2015,ApJ, 802, 129
Springel, V. 2005,MNRAS, 364, 1105
Springel, V., Yoshida, N., & White, S. D. M. 2001,New Astron., 6, 79
Stott, J. P., Sobral, D., Swinbank, A. M., et al. 2014,MNRAS, 443, 2695
Tissera, P. B., White, S. D. M., & Scannapieco, C. 2012,MNRAS, 420, 255
Tissera, P. B., Pedrosa, S. E., Sillero, E., & Vilchez, J. M. 2015,MNRAS, 456, 2982
van der Wel, A., Franx, M., van Dokkum, P. G., et al. 2014,ApJ, 788, 28
Vogelsberger, M., Genel, S., Springel, V., et al. 2014,MNRAS, 444, 1518