TítuloComplex patterns of habitat use by juvenile spider crabs "Maja brachydactila" revealed by stable isotope analyses
27
0
0
Texto completo
(2) 2. juveniles spend most of the time in sedimentary bottoms, where they find more refuge, but they move frequently (probably at night) to the nearby rocky substrates to feed. INTRODUCTION Juvenile spider crabs Maja brachydactila (Decapoda, Brachyura) (the NE Atlantic species previously known as M. squinado, see Newman, 1998 for taxonomic status) inhabit shallow waters (down to 10-15 m deep), using both rocky and sandy substrates and performing slow (<100 m d-1), small scale non-directional movements (González-Gurriarán & Freire 1994, Hines et al. 1995). Recent evidence points to ontogenetic movements when crabs are one year old and approximately 60 mm carapace length (CL), from very shallow rocky substrates (approx. 5 m), where the postlarval settlement would take place, to deeper rocky or sandy bottoms (5-20 m). Within this depth range, juveniles would spend their second year, after which they attain sexual maturity (Freire et al. 2002, Corgos 2004). Some months later, adults migrate to deeper waters (>50 m), where they mate (González-Gurriarán et al. 1998). The patterns of habitat use (specially regarding substrate type) of juvenile spider crabs in shallow waters is still to be discussed (González-Gurriarán et al. 1994, Hines et al. 1995, Freire et al. 2002), regarding the geographical and small-scale differences observed in habitat selection. Geographical variability in selected substrate type might be related to the degree of exposure, with crabs mostly selecting rocky areas in protected sites and sandy areas in more exposed sites (Corgos 2004). On the other hand, this author also points out the occurrence of variability in habitat selection by juveniles within a certain site, which is still to be explained. Furthermore, there is a high variability in body coloration and epibiosis within and among local populations, which was interpreted to be related to habitat use, taking into account the species presents masking behaviour (Parapar et al. 1997, Fernández et al. 1998). Therefore, crabs inhabiting soft bottoms are mostly slightly coloured (known as “white” crabs) and show little epibiosis, while in rocky habitats bright red-coloured crabs with abundant epibiosis dominate. Corgos (2004) observed that an important number of “red” crabs with algal epibiosis, episodically appeared in sandy areas, proposing the hypothesis of ontogenetic habitat changes (shifting from rocky to sandy areas when juveniles attain one year). Relation among different stable carbon (12C/13C, expressed as δ13C) and nitrogen (14N/15N, expressed as δ15N) isotopes, is widely used tool for the study of trophic relationships.
(3) 3. (Peterson & Fry 1987, Wada & Hattori 1991, Cabana & Rasmussen 1994, Michener & Schell 1994) and food webs (Newell et al. 1995, Ben-David & Schell 1997, Burns & Walter 2000, Fry & Smith 2002, Cocheret de la Moriniere et al. 2003). On the other hand, isotope analysis allows migration, movements and habitat use to be traced when they involve changes in feeding behaviour and diet composition (Hobson et al. 1994, 1995, Hansson et al. 1997, Hobson 1999). The fractionation of C and N isotopes when they are transferred trough a food web involves changes in the relative proportion of their stable isotopes. δ15N in consumer tissues is enriched in about a 3‰ respect to those of its preys (Owens 1987), what allows to estimate the trophic level for each organism in the trophic chain. δ13C values, on the other side, show a slow fractionation with an increase of 0-1‰ for each trophic level (DeNiro & Epstein 1978, Fry & Sherr 1984), but are closely related to organic matter origin (Fry &Sherr 1984, Peterson et al. 1985, Wainwright et al. 1993, Fry 2002). In particular, those organisms using plankton-dependant organic matter sources show different values for the C isotopes ratio than those depending on benthic primary producers or detritus (France 1995, Jennings et al. 1997, Pinnegar & Polunin 2000). Isotopic enrichment also depends on the tissue turnover rates, and can vary among different tissues within an organism (Tieszen et al. 1983, Lee-Thorp et al. 1989). Therefore, tissues such as muscle, with low turnover rates, integrate diet isotope relations corresponding to long periods in the animal life, while tissues with higher turnover rates (gonad, digestive gland), reflect the diet of short time periods (Raikow & Hamilton 2001). The present study analyzes the patterns in habitat use in juvenile spider crabs Maja brachydactila, using stable isotope analysis. C and N isotope relations were analyzed in two tissues (muscle and hepatopancreas or digestive gland) in two coastal sites of the NW of the Iberian Peninsula, 150 kms apart. (Fig. 1): the Ria de Arousa (where crabs select protected rocky areas) and the Ria da Coruña, in the Golfo Ártabro, where they tend to occur in soft, exposed bottoms. The main organisms constituting the diet of the spider crab juveniles (following Bernardez et.al, 2000, for rocky areas; non published data for soft bottoms; Table 1) and the main organic matter sources for coastal food webs (suspended organic matter, plankton and seaweeds were also analyzed). The objectives were to test the following hypotheses:.
(4) 4. (1) Habitat determines variations in diet, in both the type of preys (Table 1) and the origin of the organic matter. These variations result in changes in isotope relationships that could be used as habitat indicators. (2) Ontogenetic changes in habitat use take place, with juveniles performing movements from rocky shallow to deeper areas, with rocky substrates in protected locations and sandy substrates in exposed sites. (3) Carapace colour and epibiosis are habitat-dependant, and thus red and white crabs should show isotope relations typical of diets corresponding to rocky and sandy bottoms, respectively, with no relation to the habitat they were captured in. (4) Hepatopancreas has a higher turnover rate than muscle, and so both tissues will be diet (and consequently, habitat) indicators at different time scales. (5) As a consequence of the results obtained concerning the high inter-individual variability existing in isotope ratios among individuals, a new exploratory hypothesis was developed, proposing the existence of a relationship between diet (shown as isotope ratios) and energetic condition in an individual. MATERIAL AND METHODS A total of 39 juvenile crabs were caught in May 1999 in the Ria de Arousa for isotope analysis. Sampling was carried on in a protected area with dominating rocky bottoms at the mouth of the bay (Fig. 1). For the Golfo Ártabro, another 46 crabs were obtained between April and July 1999 in an exposed area (Bastiagueiro) located in the inner part of the Ria da Coruña. Captures in the inner part of the bay took place both in rocky habitats and in sandy areas (where most of the local population of juveniles live, Corgos 2004). In both areas, the crabs were caught using experimental traps. They were all over 60 mm CL and in intermoult. Carapace length, colour (red or white, according to degree of pigmentation) and algal epibiosis (Parapar et al. 1997, Fernández et al.1998) were noted. Taking into account that colour and degree of epibiosis are highly related, just colour will be mentioned from now. In the lab, muscle from the fourth pereiopod and hepatopancreas were extracted and tissues were freeze-dried and ground with a mortar. Tissues with high lipidic content usually show lower δ13C values, due to positive. 12. C discrimination during lipid synthesis (DeNiro &. Epstein 1977). To determine the effect of high lipid content in the hepatopancreas on isotope.
(5) 5. recordings, and to be able to compare results with other tissues (such as muscle, with lower lipid content), a complementary analysis was performed in ten hepatopancreas samples after a lipid extraction (Bligh & Dyer 1959). For this complementary analysis the samples were selected to cover the range of hepatopancreas lipid content estimated through C content (see below). Representative preys were selected according to gut content analysis by Bernárdez et al. (2000) for rocky habitat and the authors (unpublished data) for sandy bottoms (Table 1). Samples of potential organic matter sources for the foodweb involving the spider crab and its preys were collected in 2002 in five locations in coastal bays and one oceanic location (O) (Fig. 1 and Table 2) in the Golfo Ártabro using the following methodology. Sedimentary organic matter (SOM) was collected by superficial scrapings (3 replicates per location), and was later resuspended in seawater and filtered with GF/F precombusted filters. Suspended particulated organic matter (SPOM) was taken using a Niskin bottle at a depth of 2 m. Three 1.5 l water replicates were collected in each station and were filtered using GF/F precombusted filters. Plankton was sampled towing a 200 µm mesh net (diameter, 0.4 m), obtaining 6 replicates in the oceanic location. Each sample was divided in four size fractions: 100-200 µm, 200-300 µm, 300-500 µm and 500-750 µm. Seaweeds and macrofauna (bivalves, gastropods, polychaetes, equinoderms and crustaceans) were captured in the intertidal and subtidal areas of the coastal locations (Fig. 1). At the lab, epiphytes were removed from seaweeds (Laminaria ochroleuca, Cystoseira baccata, Ulva rigida), and the gut and exosqueleton from sea urchins (Paracentrotus lividus). Soft tissues were extracted from mussels (Mytilus edulis) and large individuals of the gastropod Hinia reticulata. The whole animal was processed in the case of small individuals of this species and all the Bittium sp., polychaetes (Nereis diversicolor, Eulalia viridis and a composite sample of different less-abundant errant polychaete species), sea cucumbers (Aslia lefevrei e Holothuria forskali) and decapod crustaceans (Liocarcinus arcuatus, Xantho incisus and Paguridae). Processing of samples previous to isotope analysis followed the protocols proposed by Carabel et al. (submitted). Plankton samples, large Hinia reticulata, polychaetes, holoturians and crustaceans were divided into two subsamples, one for C analysis (that was acidified with.
(6) 6. HCl 1 M during 3 hours) and another for N analysis, which was not acidified. Samples of small H. reticulata and the other gastropods were analyzed for both N and C after acidification, due to the small amount of tissue available. For the mussels and sea urchins, where soft tissues were extracted, and for seaweeds, no acidification was performed. Every sample was freeze-dried and ground in an agate mortar until a fine dust was obtained, except for the filters, which were kept intact. Isotope analyses were performed in the Servicios Xerais de Apoio á Investigación (SXAIN, Universidade da Coruña). C and N contents and isotope analysis were determined using an elemental analyzer FlashEA1112 by ThermoFinnigan connected to an isotope ratio mass spectrophotometer DELTA plus by Finnigan MAT , using a ConFlo II interface. Relative proportions of isotopes are estimated following: δ15N ‰ = [(15N/14N) sample/ (15N/14N) standard -1] · 1000 δ13C ‰ = [(13C/12C) sample/ (13C/12C) standard -1] · 1000 Atmospheric N and VPDB (Pee Dee Belemnites) were used as standards for isotope analysis of N and C, respectively. In addition, elemental composition of spider crab samples (percentage of C and N) was used as an indicator of biochemical composition of tissues (Anger & Dawirs 1982, Anger et al. 1983, Gnaiger & Bitterlich 1984). High N contents in the muscle and hepatopancreas would reflect a high percentage of protein, while a high C percentage would be showing a high lipidic content in those tissues. Differences in the spider crab isotope ratios between geographical areas, habitat of capture and carapace colour, as well as the effect of lipid extraction in hepatopancreas records were tested using ANOVA. Preliminary analyses (not shown here) indicated no differences in isotope ratios related to sex and body size. To test variability between tissues of the same crab, a t-student test was used. To explore variability among individuals in terms of isotope ratio and elemental composition (C and N as indicators of lipid and protein content and energetic condition), we used principal component analysis (PCA) was used to explore the relationships between isotope variability (related to diet) and body condition (biochemical composition)..
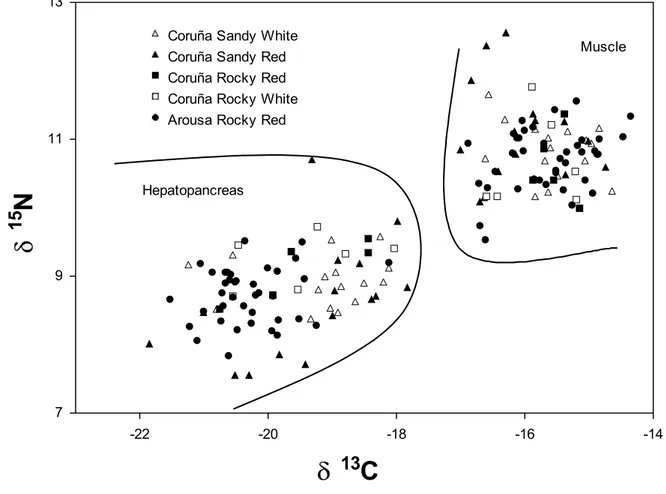
(7) 7. RESULTS Geographical variability Isotope ratios of muscle and hepatopancreas of juvenile spider crabs from rocky bottoms in the Rias de Arousa and A Coruña were compared, showing only significative differences in hepatopancreas with higher values in the crabs from the northern location for both isotopes (Table 3, Fig. 2, ANOVA, F1,47 = 10.63, p < 0.01 for δ15N; F1,47 = 12.45, p < 0.01 for δ13C). In the muscle, differences in isotope ratio between crabs from both areas, were not significant (ANOVA, F1,48 = 0.06, p = 0. 81; F1,48 = 0.23 p = 0.64, for C and N, respectively). Variability between habitats and body colour For the study of changes in diet in relation to habitat and the use of body colour as an indicator of habitat type (Table 3), we used crabs just from the Ria de A Coruña. No significant differences in isotope ratios were found between muscle and hepatopancreas, nor between red and white crabs and rocky and soft bottoms crabs (Table 4). Variability between tissues Muscle showed higher values of both isotope ratios than hepathopancreas in the Ria de A Coruña (δ15N: t41 = 19.85, p < 0.01; δ13C: t41 = 18.34, p < 0.01). Lipid removal from the hepatopancreas caused a significant increase of δ13C (ANOVA, F1,18 = 16.93, p <0.01), on average 1.74 ‰ (SE = 0.10, range = 1.09 - 2.18). No significant changes were found in δ15N after lipid removal (F1,18 = 0.09, p = 0.76). Variation in C isotope ratio was independent (r = 0.30, p = 0.39) of C percentage in the hepatopancreas (an indicator of lipid levels in that tissue), thus indicating no bias in the results presented depending of the biochemical composition of the tissues. After correcting C isotope values for the hepatopancreas (adding 1.74 % to each crab value), significant differences remained when comparing both tissues (t41 = 9.24, p < 0.01). Inter-individual variability Variability in δ13C and δ15N values observed among crabs both for the hepatopancreas and the muscle was much higher than that related to geographical location, habitat and body colour (Fig. 2, Table 3). For the N, the variation range observed in both tissues (3.03 and 3.15‰ for muscle and hepatopancreas, respectively), which is equivalent to a complete trophic level, indicates the occurrence of important differences in diet composition among.
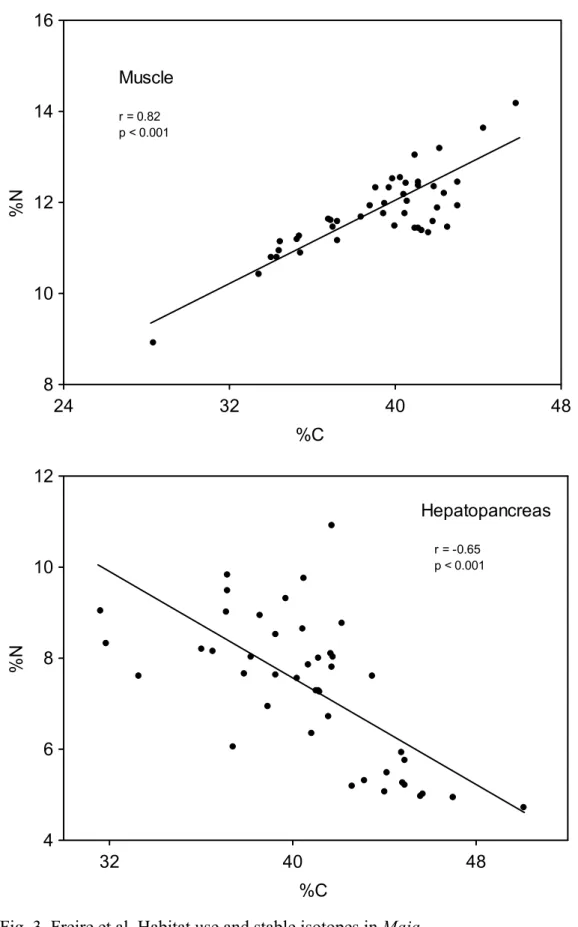
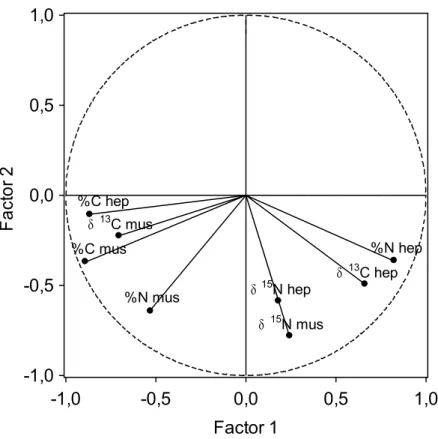
(8) 8. crabs caught in the same habitat and with similar biological characteristics. For the C, this variation (4.01 ‰ hepatopancreas and 2.36 ‰ muscle) shows that spider crabs base their diet on different sources of organic matter. On the other hand, the opposite behaviour is shown for elemental composition (percentage of C and N) of muscle and hepatopancreas (Fig. 3), with a negative correlation between N and C in hepatopancreas (r = -0.65; p < 0.001), while in the muscle both variables show a positive correlation (r = 0.82; p < 0.001). In the PCA for isotope ratios and elemental composition (Fig. 4), factor 1 explains 44.2 % of the variance, and mostly represents variability among individuals in elemental composition. Thus, both C and N percentages in muscle and C percentage in hepatopancreas, show a strong negative correlation with axis 1, while N percentage in hepatopancreas shows a positive correlation. This axis would distribute crabs according to their energetic condition, distinguishing those individuals in good condition (high levels of C and N in the muscle, related to high protein content, and high C content in the hepatopancreas, showing high lipid content) from those in bad condition (with lower protein and lipid content in muscle and hepatopancreas, respectively). Isotope ratios for N showed a low correlation with axis 1, suggesting that energetic condition is not dependant on trophic level, but on the contrary δ13C in the muscle is associated to crabs in good body condition (showing higher δ13C), while δ13C in hepatopancreas is related to crabs in bad condition. Factor 2 explains 24.2 % of the variance and establishes a positive relation between δ15N values in hepatopancreas and muscle, and can be considered associated with trophic level. Coastal food web and spider crab diet The average values for δ15N in the different components of the food web for the Golfo Ártabro, ranged from 5.39 ‰ (SPOM) to 11.72 ‰ (Eulalia viridis) (Table 5). Assuming a 3 ‰ enrichment in each trophic level, the range comprised slightly more than two trophic levels. δ15N values for Mytilus edulis and Paracentrotus lividus placed them as herbivores, while most of the preys consumed by the spider crab can be considered as omnivorous (gastropods, polychaetes, Aslia lefevrei and decapods). An enrichment of about 6 ‰ in δ15N respect to primary producers and organic matter for Hinia reticulata, Holothuria forskali and E. viridis seems to indicate a carnivorous diet for these species..
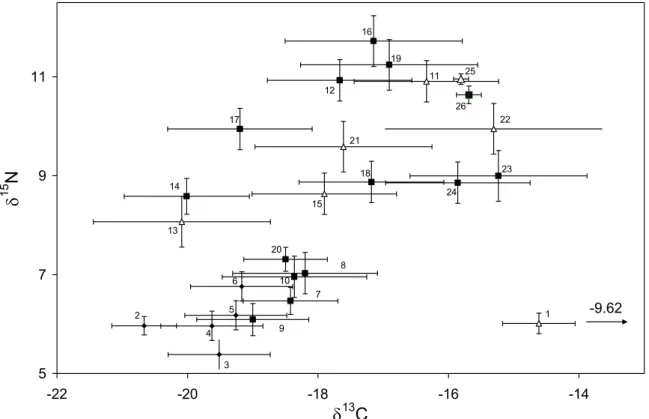
(9) 9. A wide range of values for δ13C was observed in the different compartments of the food web, with minimum values (-20.7 ‰) for the SPOM and maximum for SOM (9.6 ‰) (Table 5, Fig.5). For plankton and seaweeds, values were closer to those of MOPS (δ13C = -19.8 ‰ and -18.5 ‰ respectively). Assuming a fractionation of 0-1 ‰ for the C, the animals showing the closest values to those of the rocky habitat organic matter sources were the polychaete N. diversicolor and the sea urchin P. lividus (-18.5 ‰), with values very similar to seaweeds. Mussel M. edulis (δ13C=-18.4‰) seem to feed mostly on the smaller fraction of plankton (basically phytoplancton). Other organisms, Bittium sp., A. lefevrei, errant polychaetes, Holothuria forskali and decapods (Liocarcinus arcuatus, Xantho incisus and Paguridae, both from rocky and sandy areas), presented intermediate values between the potential organic matter sources, indicating that both could be constituting their main food sources. Gastropod H. reticulata showed a δ13C closer to those of seaweeds and plankton for benthic rocky habitats and to MOS for sandy habitats. Stable isotope values for some of the species used here seem to indicate that the organic matter sources upon which their diets are based would be different from those selected for this study. δ15N values for Paracentrotus lividus are lower than those found for the organic matter sources, indicating it could be feeding on some algae species different than those we analyzed. On the other hand, δ13C for Nereis diversicolor and Liocarcinus arcuatus differ about a 2 ‰ from plankton values, being much closer to macroalgae and minimum values of MOS, suggesting that drift algae in soft bottoms could be an important part of their diet. Something similar would happen to pagurids that inhabit sandy bottoms, although in this case δ13C values for rocky bottom crustaceans (Paguridae and Xantho incisus) are more difficult to explain, due to its distance from both seaweeds and herbivore values. A possible cause would be to assume much higher C values for Ulva rigida, such as the observed by other authors (14.5‰, Sauriau & Kang 2000, -11.8 and -10.8‰ Page & Lastra 2003), putting ratios for this primary producer much closer to the decapods included in the present study. On the other hand, due to their mobility, it is also possible that they would move to sandy areas where they would be feeding on organisms from soft bottoms. δ13C values for the spider crab are very similar to the values for the rest of the decapods analyzed, both from rocky and sandy bottoms, with values in between pelagic and benthic compartment. Trophic level based in δ15N for the spider crab in the Golfo Ártabro is similar.
(10) 10. to other carnivores of this food web, and higher than omnivorous crustaceans and typical herbivore invertebrates (Fig. 6). DISCUSSION Geographical differences in C and N isotope ratios were very small for the muscle of Maja brachydactila, but reach significant values for the hepatopancreas. Muscle values, due to its lower turnover rate, provide an integrated signal of the animal diet in the medium term (months), while hepatopancreas reflects diet in the shorter term (days or weeks) (Raikow & Hamilton 2001, Lorrain et al. 2002). Differences found in hepatopancreas values between areas could be showing differences in diet during the days previous to the sampling, but muscle values indicate that in the long term, diet would have similar isotopic signatures in both locations. C and N isotope ratio did not show differences between habitats (rocky vs. sandy) in the Ria de A Coruña, both for muscle and hepatopancreas. These results suggest that movements between both habitats are much more frequent than the suggested in previous studies (González-Gurriarán & Freire 1994, Hines et al. 1995, Corgos 2004, Bernárdez et al., unpublished data). It has to be taken into account that previous studies used telemetry to obtain daily locations, but restricted to daylight time, and trap sampling to map distributions. The use of body colour as an indicator of habitat preference was found to be inconsistent. DeNiro & Epstein (1978) showed that fractioning patterns exhibited in different tissues can be dependant on the relative distribution of individual fractions (i.e. lipids, proteins, carbohidrates). Pinnegar & Polunin (1999) and Lorrain et al. (2002) observed that the range of δ13C and δ15N values in the muscle and hepatic tissue of an organism can be strongly related to relative abundance of lipids, known that these tissues show great differences in lipidic content. The observed increase in δ13C after lipid removal in the hepatopancreas of selected crabs of the Ria de A Coruña (1.74 ‰) was much higher than the fractionation of this isotope between a predator and its prey (0-1%), what could result in a wrong interpretation of the organic matter sources. Differences between hepatopancreas and muscle before lipid removal were reduced after the process, but were still significant. Thus, it seems that they indicate actual differences in short and long term diet, and that these are not due to differences in lipid content between tissues..
(11) 11. The negative correlation between δ13C in hepatopancreas and muscle could be reflecting diet variations in the short and medium term, and suggests very frequent movements, also in the medium term, between both habitats used by juvenile spider crabs. For example, crabs with high δ13C muscle values that would be associated in the medium term to a diet based on preys that feed in MOS-dependant trophic routes (highest δ13C values), have low hepatopancreas values of δ13C (associated with rocky habitats). The relationships between C and N isotopic ratios in muscle and hepatopancreas for the crabs sampled in the Ria de A Coruña and the relative proportions of lipids and proteins in these tissues, seem to indicate a strong relation between the trophic origin of preys consumed by the spider crab and its energetic condition (that would be independent from the capture habitat and colour). So, the relation between δ13C and the percentage of C and N in both tissues would indicate that the crabs that spent more time feeding in soft bottoms would be in a better energetic condition. Stable isotope analyses are frequently used to determine relative contribution of different food sources to an animal diet (Hobson 1999). Similarity between isotope ratios of the tissues of an organism and its food sources gives an idea of their relative importance in its diet. Relative importance of preys in the diet of the spider crab can be estimated using the isotope ratios of a single element (i.e. δ13C) (Kwak & Zedler 1997). In the foodweb studied here for the Golfo Ártabro, two main trophic compartments according to their organic matter source were identified (Fig. 6): one based on plankton (δ13C = -19.4) and macroalgae (δ13C = -18.5) mostly corresponding to rocky habitats, and the other based on sedimentary particulated organic matter (MOS) (δ13C = -9.62), corresponding to sandy bottoms. Isotope values observed for the main organic matter sources in both rocky and sandy bottoms suggest that juvenile spider crabs (δ13C = -15.7) consume approximately two thirds of its preys in rocky bottoms and one thrid in sandy areas, although this last proportion could be infraestimated due to the large range of variability of MOS. This result does not seem to fit previous hypotheses about habitat use in the studied area (Corgos 2004), given that captures are much more abundant in sandy areas. Juvenile crabs might be spending most of their time in soft bottoms, where they find refuge in this highly exposed area, but move frequently to rocky areas, where they feed. Given the fact that previous telemetry studies were based in daylight observations (González-Gurriarán & Freire 1994, Hines et al. 1995, Bernárdez et al., unpublished data) and no short-term habitat changes were detected, our results suggest that probably spider crabs would make nightly movements among habitats to feed..
(12) 12. ACKNOWLEDGEMENTS This study is part of the projects DIMEPIC (REN2000-0446MAR) and ECOSOST (REN2003-04816), funded by the Spanish Ministerio de Ciencia y Tecnología. We thank to I. Álvarez, M. Boán, A. Corgos, B. García-Calvo, E. Godínez-Domínguez, A. Pallas, M. Pan and N. Sánchez for their collaboration during the field sampling and in the laboratory. We also thank to the personal of SXAIN (UDC) for their help. The authors would like to express their gratitude to E. Méndez-Souto for her helpful English correction during the preparation of this manuscript. LITERATURE CITED Anger K, Dawirs RY (1982) Elemental composition (C, N, H) and energy in growing and starving larvae of Hyas araneus (Decapoda, Majidae). Fish Bull 80: 419-433 Anger K, Laasch N, Püschel C, Schorn F (1983) Changes in biomass and chemical composition of spider crab (Hyas araneus) larvae reared in the laboratory. Mar Ecol Prog Ser 12: 91-101 Ben-David M, Flynn RW, Schell DM (1997) Annual and seasonal changes in diets of martens: evidence from stable isotope analysis. Oecologia, 111: 280-291 Bernárdez C, Freire J, González-Gurriarrán E (2000) Feeding of the spider crab Maja squinado in rocky subtidal areas of the Ría de Arousa (north-west Spain). J Mar Biol Ass U K 80: 95-102 Bligh EG, Dyer WF (1959) A rapid method of total lipid extraction and purification. Canadian Journal of Biochemical Physiology, 37: 991-917. Burns A, Walker KF (2000) Biofilms as food for decapods (Atyidae, Palaemonidae) in the River Murray, South Australia. Hydrobiologia 437: 83-90. Cabana G, Rasmussen JB (1994) Modelling food chain structure and contaminant bioaccumulation using stable N isotopes. Nature 372: 255-257 Cocheret de la Morinière E, Pollux BJA, Nagelkerken I, Hemminga MA, Huiskes AHL, van der Velde G (2003) Mar Ecol Prog Ser 246: 279-289 Corgos A (2004) Estrategia vital, estructura espacial y dinámica metapoblacional de la centolla Maja squinado (Decapoda: Majidae) PhD Thesis, Universidade da Coruña (Available at http://www.udc.es/dep/bave/jfreire/home.htm).
(13) 13. DeNiro MJ (1977) I. Carbon isotope distribution in food chains. II. Mechanism of carbon isotope fractionation associated with lipid synthesis. Ph. D. thesis. California Institute of Technology, Los Angeles. DeNiro MJ, Epstein S (1978) Influence of diet on the distribution of nitrogen isotopes in animals. Geochim Cosmochim Acta 42: 495-506 Fernández L, Parapar J, González-Gurriarán E, Muiño R (1998) Epibiosis and ornamental cover patterns of the spider crab Maja squinado on the Galician coast, Northwestern Spain: Influence of behavioural and ecological characteristics of the host. J Crustac Biol 18: 728-737 France RL (1995) Carbon-13 enrichment in benthic compared to planktonic algae: Foodweb implications. Mar Ecol Prog Ser 124: 307-312 Freire J, Bernardez C, Corgos A, Fernandez L, Gonzalez-Gurriaran E, Sampedro MP, Verisimo P (2002) Management strategies for sustainable invertebrate fisheries in coastal ecosystems of Galicia (NW Spain). Aquat Ecol 36: 41-50. Fredriksen, S (2003) Food web studies in a Norwegian kelp forest based on stable isotope (δ13C and δ15N) analysis. Mar Ecol Prog Ser 260: 71-81 Fry B (2002) Stable isotopic indicators of habitat use by Mississippi River fish J N A Benthol Soc 21: 676-685 Fry B, Sherr EB (1984) δ13C measurements as indicators of carbon flow on marine and freshwater ecosystems. Contrib Mar Sci 27: 13-47 Fry B, Smith III TJ (2002) Stable isotope studies of red mangrove and filter feeders from the Shark River Estuary, Florida. Bull Mar Sci 70: 871-890. Gnaiger E, Bitterlich G (1984) Proximate biochemical composition and caloric content calculated from elemental CHN analysis: a stoichiometric concept. Oecologia 62: 289298. González-Gurriarán E, Freire J (1994) Movement patterns and habitat utilization in the spider crab Maja squinado (Herbst) (Decapoda, Majidae) measured by ultrasonic telemetry. J Exp Mar Biol Ecol 189: 183-203. González-Gurriarán E, Fernández L, Freire J, Muiño R (1998) Mating and role of seminal receptacles in the reproductive biology of the spider crab Maja squinado (Decapoda, Majidae). J Exp Mar Biol Ecol 220: 269-285. Hansson S, Hobbie JE, Elmgren R, Larsson U, Fry B, Johansson S (1997) The stable nitrogen isotope ratio as a marker of food-web interactions and fish migration. Ecology, 78: 2249-2257.
(14) 14. Herman PMJ, Middelburg JJ, Widdows J, Lucas CH, Heip CHR (2000) Stable isotopes as trophic tracers: combining field sampling and manipulative labelling of food resources for macrobenthos. Mar Ecol Prog Ser 204: 79-92 Hines AH, Ruiz GM (1995) Temporal variation in juvenile blue crab mortality: nearshore shallows and cannibalism in Chesapeake Bay. Bull Mar Sci 57: 884-901. Hobson KA, Piatt JF, Pitocchelli J (1994) Using stable isotopes to determine seabird trophic relationships. J Animal Ecol 63:786-798. Hobson KA, Ambrose Jr WG, Renaud PE (1995) Sources of primary production, benthicpelagic coupling, and trophic relationships within the Northeast Water Polynya: insights from δ13C and δ15N analysis. Mar Ecol Prog Ser 128: 1-10. Hobson KA (1999) Tracing origins and migration of wildlife using stable isotopes: a review. Oecologia 120: 314-326 Jennings S, Renones O, Morales-Nin B, Polunin NVC, Moranta J, Col J (1997) Spatial variation in the. 15. N and. 13. C stable isotope composition of plants, invertebrates and. fishes on Mediterranean reefs: implications for the study of trophic pathways. Mar Ecol Prog Ser 146: 109-116 Kwak TJ, Zedler JB (1997) Food web analysis of southern California coastal wetlands using multiple stable isotopes. Oecologia 110: 262-277 Lee-Thorp JA, Sealy JC, van der Merwe NJ (1989) Stable carbon isotope ratio differences between bone collagen and bone apatite, and their relationship to diet. J Arch Sci 16: 595-589 Lorrain A, Paulet Y-M, Chauvaud L, Savoye N, Donval A, Scout C (2002) Differential δ13C and δ15N signatures among scallop tissues: implications for ecology and physiology. J Exp Mar Biol Ecol, 275: 47-61 Michener RH, Schell DM (1994) Stable isotope ratios as tracers in marine aquatic food webs. In: Lajtha K, Michener RH (eds) Stable isotopes in ecology and environmental science. Blackwell Scientific Publication, Oxford, pp 138-157 Newell RIE, Marshall N, Sasekumar A, Chong VC (1995) Relative importance of benthic microalgae, phytoplankton, and mangroves as sources of nutrition for penaeid prawns and other coastal invertebrates from Malaysia. Mar Biol 123: 595-606 Neumann, V. (1998). A review of the Maja squinado (Crustacea: Decapoda: Brachyura) species-complex with a key to the eastern Atlantic and Mediterranean species of the genus. Journal of Natural History, 32: 1667-1684..
(15) 15. Owens NJP (1987) Natural variations in. 15. N in the marine environment. Adv Mar Biol 24:. 389-451 Page H M, Lastra M (2003) Diet of intertidal bivalves in teh Ria de Arosa (NW Spain): evidence from stable C and N isotope analysis. Mar Biol 143: 519-532 Parapar J, Fernández L, González-Gurriarán E, Muiño R (1997) Epiobisis and masking material in the spider crab Maja squinado (Decapoda: Majidae) in the Ría de Arousa (Galicia, NW Spain). Cah Biol Mar 38: 221-234 Peterson BJ, Fry B (1987) Stable isotopes in ecosystem studies. Annu Rev Ecol Syst 18: 293320 Peterson BJ, Howarth RW, Garritt RH (1985) Multiple stable isotopes used to trace the flow of organic matter in estuarine food webs. Science 227: 1361-1363 Pinnegar JK, Polunin NVC (1999) Differential fractionation of δ13C and δ15N among fish tissues: implications for the study of trophic interactions. Funct Ecol 13: 225-231 Pinnegar JK, Polunin NVC (2000) Contributions of stable-isotope data to elucidating food webs of Mediterranean rocky littoral fishes. Oecologia 122: 399-409 Raikow DF, Hamilton SK (2001) Bivalve diets in a Midwestern U.S. stream: a stable isotope enrichment study. Limnol Oceanogr 46: 514-522 Sauriau, P-G, Kang C-K (2000) Stable isotope evidence of benthic microalgae-based growth and secondary production in the suspension feeder Cerastoderma edule (Mollusca, Bivalvia) in the Marennes-Oléron Bay. Hydrobiologia 440: 317-329 Tieszen LL, Boutton TW, Tesdahl KG, Slade NH (1983) Fractionation and turnover of stable carbon isotopes in animal tissues: implications for. 13. C analysis of diet. Oecologia 57:. 32-37 Wada E, Hattori A (1991) Nitrogen in the sea: forms, abundances, and rate processes. CRC Press, Boca Raton Wainright SC, Fogarty MJ, Greenfield RC, Fry B (1993) Long-term changes in the Georges Bank food web - trends in stable isotopic compositions on fish scales. Mar Biol 115: 481-493.
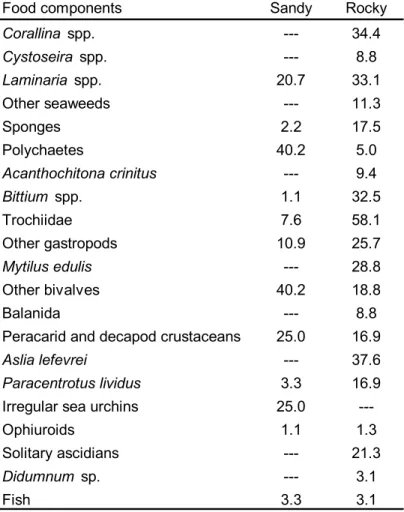
(16) 16. Table 1. Frequency of appearance of food components in the gut contents of Maja brachydactila. (percentages respect to the total number of guts containing food are shown) in rocky (N=160, data from Bernárdez et al. 2000) and sandy habitats (N=92, unpublished data).. Food components. Sandy. Rocky. Corallina spp.. ---. 34.4. Cystoseira spp.. ---. 8.8. Laminaria spp.. 20.7. 33.1. Other seaweeds. ---. 11.3. Sponges. 2.2. 17.5. Polychaetes. 40.2. 5.0. Acanthochitona crinitus. ---. 9.4. Bittium spp.. 1.1. 32.5. Trochiidae. 7.6. 58.1. Other gastropods. 10.9. 25.7. Mytilus edulis. ---. 28.8. Other bivalves. 40.2. 18.8. ---. 8.8. 25.0. 16.9. Aslia lefevrei. ---. 37.6. Paracentrotus lividus. 3.3. 16.9. Irregular sea urchins. 25.0. ---. Ophiuroids. 1.1. 1.3. Solitary ascidians. ---. 21.3. Didumnum sp.. ---. 3.1. Fish. 3.3. 3.1. Balanida Peracarid and decapod crustaceans.
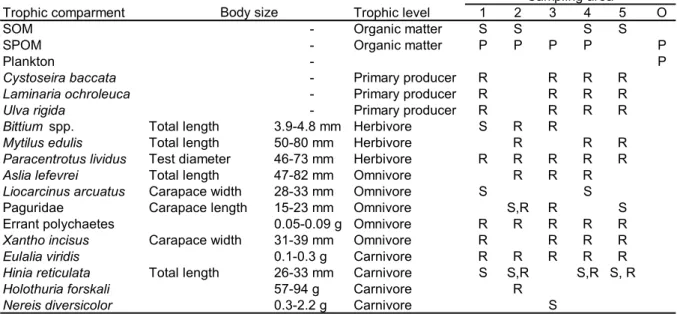
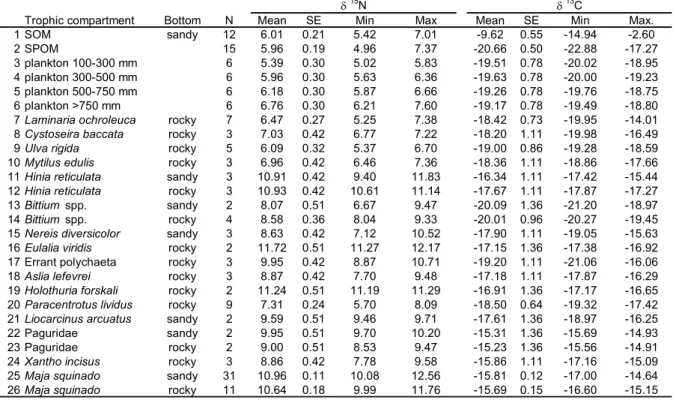
(17) 17. Table 2. Food web compartments (organic matter sources and organisms) in the Golfo Artabro sampled for stable isotope analysis. Nominal trophic level, habitat type in which samples where taken (S= sandy substrates, R= rocky substrates, P= pelagic), sampling locations (see Fig. 1) and body size or fresh weight of organisms are shown.. Trophic comparment SOM SPOM Plankton Cystoseira baccata Laminaria ochroleuca Ulva rigida Bittium spp. Mytilus edulis Paracentrotus lividus Aslia lefevrei Liocarcinus arcuatus Paguridae Errant polychaetes Xantho incisus Eulalia viridis Hinia reticulata Holothuria forskali Nereis diversicolor. Body size. Total length Total length Test diameter Total length Carapace width Carapace length Carapace width Total length. 3.9-4.8 mm 50-80 mm 46-73 mm 47-82 mm 28-33 mm 15-23 mm 0.05-0.09 g 31-39 mm 0.1-0.3 g 26-33 mm 57-94 g 0.3-2.2 g. Trophic level Organic matter Organic matter. 1 S P. Primary producer Primary producer Primary producer Herbivore Herbivore Herbivore Omnivore Omnivore Omnivore Omnivore Omnivore Carnivore Carnivore Carnivore Carnivore. R R R S R. 2 S P. Sampling area 3 4 5 S S P P. R R R R. R R R R R R. S R R R S. S,R R R S,R R. R R R R. S. R R R. R R R. R R R S. R R. S R R R R R R S,R S, R. O P P.
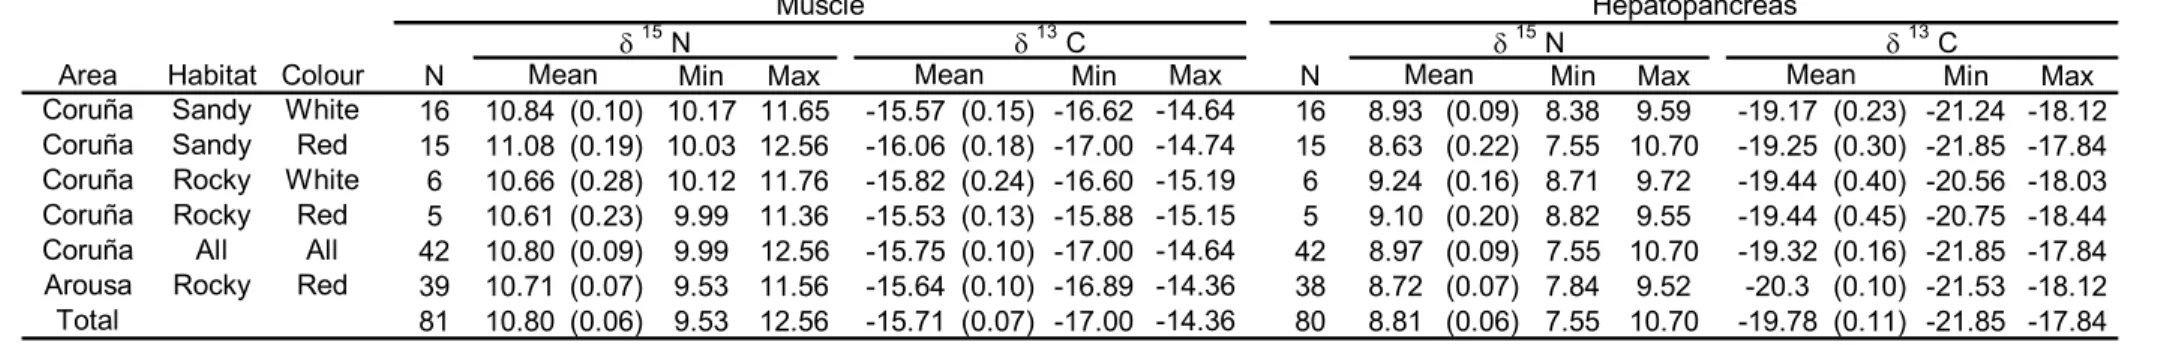
(18) 18. Table 3. Average (SE in parentheses) and minimum and maximum values for δ15N and δ13C in hepatopancreas and muscle of spider crabs Maja brachydactila from the Ria de Arousa and Ria de A Coruña, in relation to habitat (substrate) and body colour. N=number of individuals. Muscle δ. Area Coruña Coruña Coruña Coruña Coruña Arousa Total. Habitat Colour Sandy White Sandy Red Rocky White Rocky Red All All Rocky Red. N 16 15 6 5 42 39 81. 15. Mean 10.84 (0.10) 11.08 (0.19) 10.66 (0.28) 10.61 (0.23) 10.80 (0.09) 10.71 (0.07) 10.80 (0.06). N Min 10.17 10.03 10.12 9.99 9.99 9.53 9.53. δ. Max 11.65 12.56 11.76 11.36 12.56 11.56 12.56. Mean -15.57 (0.15) -16.06 (0.18) -15.82 (0.24) -15.53 (0.13) -15.75 (0.10) -15.64 (0.10) -15.71 (0.07). 13. C Min -16.62 -17.00 -16.60 -15.88 -17.00 -16.89 -17.00. δ. Max -14.64 -14.74 -15.19 -15.15 -14.64 -14.36 -14.36. N 16 15 6 5 42 38 80. 15. Mean 8.93 (0.09) 8.63 (0.22) 9.24 (0.16) 9.10 (0.20) 8.97 (0.09) 8.72 (0.07) 8.81 (0.06). Hepatopancreas 13 N δ C Mean Min Max Min 8.38 9.59 -19.17 (0.23) -21.24 7.55 10.70 -19.25 (0.30) -21.85 8.71 9.72 -19.44 (0.40) -20.56 8.82 9.55 -19.44 (0.45) -20.75 7.55 10.70 -19.32 (0.16) -21.85 7.84 9.52 -20.3 (0.10) -21.53 7.55 10.70 -19.78 (0.11) -21.85. Max -18.12 -17.84 -18.03 -18.44 -17.84 -18.12 -17.84.
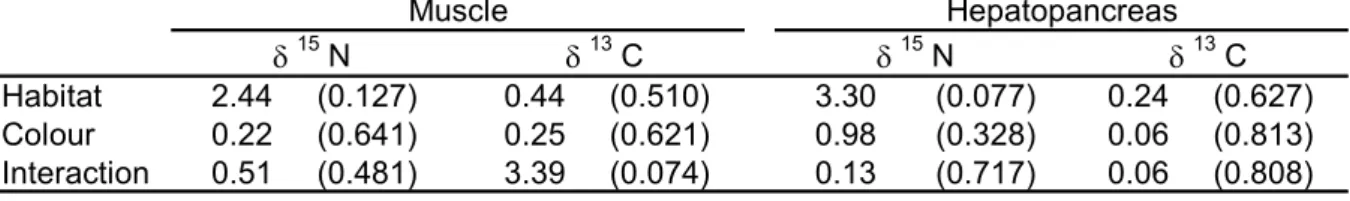
(19) 19. Table 4. Results of ANOVAs (F-statistic and probability level in parenthesis) used to test differences in δ15N and δ13C values in the muscle and hepatopancreas of Maja brachydactila in the Ria de A Coruña, between habitats and body colours (df= 1,38). Muscle δ Habitat Colour Interaction. 2.44 0.22 0.51. 15. N (0.127) (0.641) (0.481). δ 0.44 0.25 3.39. 13. C (0.510) (0.621) (0.074). δ 3.30 0.98 0.13. 15. Hepatopancreas 13 N δ C (0.077) 0.24 (0.627) (0.328) 0.06 (0.813) (0.717) 0.06 (0.808).
(20) 20. Table 5. Average, standard error (SE), minimum and maximum values of δ15N and δ13C for the organic matter sources, primary producers and consumers that integrate the foodweb associated to Maja brachydactila in the Golfo Ártabro. Substrate type were samples were collected is shown. N= number of samples analyzed. The codes used in Figure 5 are indicated. 15. 1 2 3 4 5 6 7 8 9 10 11 12 13 14 15 16 17 18 19 20 21 22 23 24 25 26. Trophic compartment SOM SPOM plankton 100-300 mm plankton 300-500 mm plankton 500-750 mm plankton >750 mm Laminaria ochroleuca Cystoseira baccata Ulva rigida Mytilus edulis Hinia reticulata Hinia reticulata Bittium spp. Bittium spp. Nereis diversicolor Eulalia viridis Errant polychaeta Aslia lefevrei Holothuria forskali Paracentrotus lividus Liocarcinus arcuatus Paguridae Paguridae Xantho incisus Maja squinado Maja squinado. Bottom sandy. rocky rocky rocky rocky sandy rocky sandy rocky sandy rocky rocky rocky rocky rocky sandy sandy rocky rocky sandy rocky. N 12 15 6 6 6 6 7 3 5 3 3 3 2 4 3 2 3 3 2 9 2 2 2 3 31 11. Mean 6.01 5.96 5.39 5.96 6.18 6.76 6.47 7.03 6.09 6.96 10.91 10.93 8.07 8.58 8.63 11.72 9.95 8.87 11.24 7.31 9.59 9.95 9.00 8.86 10.96 10.64. SE 0.21 0.19 0.30 0.30 0.30 0.30 0.27 0.42 0.32 0.42 0.42 0.42 0.51 0.36 0.42 0.51 0.42 0.42 0.51 0.24 0.51 0.51 0.51 0.42 0.11 0.18. δ N Min 5.42 4.96 5.02 5.63 5.87 6.21 5.25 6.77 5.37 6.46 9.40 10.61 6.67 8.04 7.12 11.27 8.87 7.70 11.19 5.70 9.46 9.70 8.53 7.78 10.08 9.99. 13. Max 7.01 7.37 5.83 6.36 6.66 7.60 7.38 7.22 6.70 7.36 11.83 11.14 9.47 9.33 10.52 12.17 10.71 9.48 11.29 8.09 9.71 10.20 9.47 9.58 12.56 11.76. Mean -9.62 -20.66 -19.51 -19.63 -19.26 -19.17 -18.42 -18.20 -19.00 -18.36 -16.34 -17.67 -20.09 -20.01 -17.90 -17.15 -19.20 -17.18 -16.91 -18.50 -17.61 -15.31 -15.23 -15.86 -15.81 -15.69. SE 0.55 0.50 0.78 0.78 0.78 0.78 0.73 1.11 0.86 1.11 1.11 1.11 1.36 0.96 1.11 1.36 1.11 1.11 1.36 0.64 1.36 1.36 1.36 1.11 0.12 0.15. δ C Min -14.94 -22.88 -20.02 -20.00 -19.76 -19.49 -19.95 -19.98 -19.28 -18.86 -17.42 -17.87 -21.20 -20.27 -19.05 -17.38 -21.06 -17.87 -17.17 -19.32 -18.97 -15.69 -15.56 -17.16 -17.00 -16.60. Max. -2.60 -17.27 -18.95 -19.23 -18.75 -18.80 -14.01 -16.49 -18.59 -17.66 -15.44 -17.27 -18.97 -19.45 -15.63 -16.92 -16.06 -16.29 -16.65 -17.42 -16.25 -14.93 -14.91 -15.09 -14.64 -15.15.
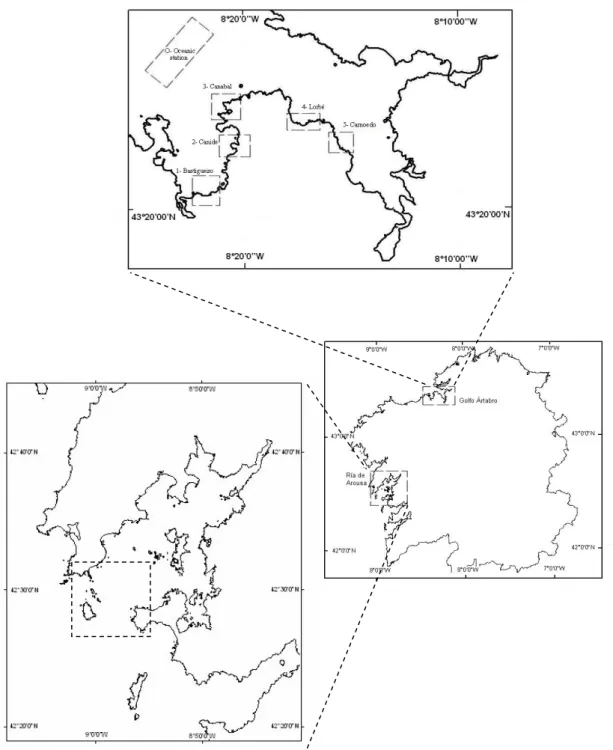
(21) 21. Figure Legends Figure 1. Location of sampling areas in the Golfo Ártabro and Ria de Arousa; 1 to 5, coastal embayments, O: oceanic station. Maja brachydactila were obtained from the Ría de Arousa and station 1 in Golfo Artabro. Food web samples were obtained in all locations from the Golfo Artabro. Figure 2. δ13C and δ15N ratios for hepatopancreas and muscle of juvenile spider crabs Maja brachydactila in the Ria de Arousa and Ria de A Coruña. Substrate type of capture area and body colour are indicated. Figure 3. Elemental composition of muscle and hepatopancreas of the juvenile spider crabs Maja brachydactila caught in the Ría da Coruña. Relationships between N and C percentages are shown for both tissues. Figure 4. Correlation of elemental composition (shown as C and N percentages) and isotope ratios (δ13C e δ15N) for hepatopancreas (hep) and muscle (mus) with the two main factors extracted from PCA. Figure 5. Isotope ratios of the main compartments of the coastal food web in the Golfo Ártabro. Mean values of δ15N and δ13C for thophic components from rocky ( ) and sandy ( ) benthic habitats and pelagic habitats ( ) are shown. Confidence intervals represent standard error. Codes for trophic components are shown in Table 5. Figure 6. Representation of the main trophic flows in the food web related to Maja brachydactila in the Golfo Ártabro, from N N nd C stable isotope analysis. (See Table 5 and Figure 5 for data)..
(22) 22. Fig. 1. Freire et al. Habitat use and stable isotopes in Maja.
(23) 23. 13 Coruña Sandy Coruña Sandy Coruña Rocky Coruña Rocky Arousa Rocky. White Red Red White Red. Muscle. 11. δ. 15. N. Hepatopancreas. 9. 7 -22. -20. -18. δ. 13. C. Fig. 2. Freire et al. Habitat use and stable isotopes in Maja. -16. -14.
(24) 24. 16 Muscle. %N. 14. r = 0.82 p < 0.001. 12. 10. 8 24. 32. 40. 48. %C 12 Hepatopancreas r = -0.65 p < 0.001. %N. 10. 8. 6. 4 32. 40 %C. Fig. 3. Freire et al. Habitat use and stable isotopes in Maja. 48.
(25) 25. 1,0. Factor 2. 0,5. 0,0. %C hep δ. 13. C mus %N hep. %C mus. -0,5. %N mus. δ. 15. δ. -1,0 -1,0. -0,5. δ. 13. C hep. N hep. 15. 0,0. N mus. 0,5. Factor 1. Fig. 4. Freire et al. Habitat use and stable isotopes in Maja. 1,0.
(26) 26. 16 19. 11. 25. 11 12. 26 22. 17. 9. 23. 18 14. 15. δ N. 21. 24 15. 13 20 8. 7. 6. 10 7. 5. 2. -9.62. 1 9. 4 3. 5 -22. -20. -18. 13. δ C. Fig 5. Freire et al. Habitat use and stable isotopes in Maja. -16. -14.
(27) 27. δ 15N. Carnivores. 13 CARNIVORES. SPIDER CRAB. 11. OMNIVORES. OMNIVORES. Omnivores. Herbivores. HERBIVORES. 8. SEAWEEDS. Seaweeds O.M.. PLANKTON 5 -22. SPOM. SOM. -19 Pelagic O.M.. -15 Seaweeds. δ 13C. Fig. 6. Freire et al. Habitat use and stable isotopes in Maja. -11 Benthic O.M..
(28)
Figure
+7
Documento similar
In this study, oviposition intensity and the within-plant distribution of Orius insidiosus (Heteroptera: Anthocoridae) and Nabis americoferus (Heteroptera: Nabidae) eggs on
Although some studies have related the presence of European rabbits with an increased road mortality of predators (Barrientos and Bolonio 2009, Barrien-.. tos and de Dios
In this work we develop high-resolution habitat models (1 ha) and study habitat preferences (focal points) of Dupont’s lark Chersophilus duponti, an endangered shrub- steppe
1) to describe the food webs using carbon and ni- trogen stable isotopes, with emphasis on tempo- ral and habitat variations in the diet of P. clarkii occupies the same trophic
Specifically, SOC had a significant protective influence in adolescents whose peer group showed either a non- consumption pattern or a pattern of frequent alcohol use and occasional
The broad “WHO-ICF” perspective on HrWB provided at Figure 1 has a significant implication also for HRQoL. The develop- ment of ICF and its conceptual approach has challenged to
(ii) Classify by means of a local machine those patterns rejected by the global learning
Seasonal change in (A) leaf δ 15 N values, (B) leaf nitrogen total content and (C) area-based leaf nitrogen content for TW-FI (Transfer 281. water-Full Irrigation), TW-RDI
