TítuloCommunity structure and spatial distribution of benthic fauna in the Bellingshausen Sea (West Antarctica)
15
0
0
Texto completo
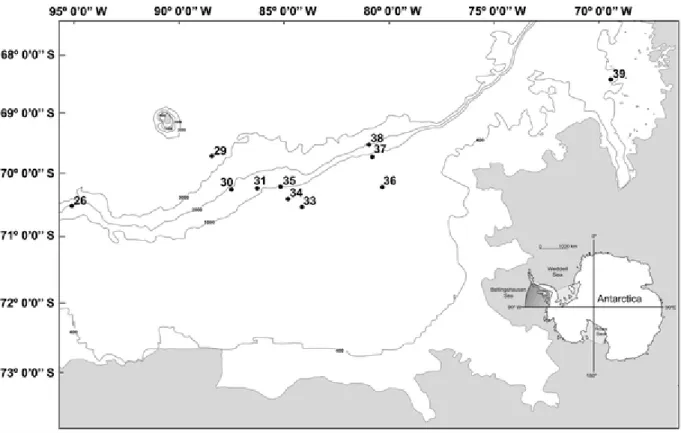
(2) (depth, redox, organic matter, carbonates and particle size of surficial sediments) were measured simultaneously on the sea floor to characterise the substrate preferences of the fauna. Positive correlations were found between the faunal distribution and a combination of depth, redox values, and organic matter content of sediments. This indicates decreasing availability of food in the deeper bottoms of the Bellingshausen Sea with a prevalence of depauperated bottoms dominated almost exclusively by a foraminiferans community. Keywords Abiotic factors; Abundance; Antarctica; Bellingshausen Sea; Macrobenthos; PRIMER. Introduction The Antarctic sector corresponding to the Bellingshausen Sea (BS) is one of the most difficult areas for a research vessel to visit because of the prevalence of ice (Clarke and Johnston 2003) during most of the year. As a result, this area has been comparatively less studied than the Weddell and Ross Seas, where many countries have conducted vast programs of research during the past decades. The situation is even worse when we realise that the majority of the few studies conducted in this remote geographical area are other than benthic studies. One exception is the recent publication of two faunal works on fishes and molluscs from Matallanas and Olaso (2007) and Troncoso et al. (2007). The BS constitutes a natural connection between the Weddell and Ross seas along both sides of the Antarctic Peninsula with obvious zoogeographical significance in the dispersion of species around the waters of the Antarctic continent and through the Scotia Arc; with this study we seek to help in remedying the scarcity of data by exploring general characteristics of the benthos of this remote Antarctic area by using well known standard benthos study methods. Thus, the aims of the present study are: (1) to characterise the faunal assemblages present on the sea floor and (2) to identify environmental factors that may affect and/or determine the composition and spatial distribution of fauna.. Materials and methods Field sampling The sampling program was carried out aboard the RV ‘Hespérides’ during the cruise named ‘BENTART-06’ in January and February 2006. Stations are reported in Fig. 1, and station locations and depths are given in Table 1. Sediment samples were collected by means of an USNEL-type box corer (BC) with a maximum breakthrough of 60 cm and an effective sampling area of 0.25 m2. When possible, two duplicate samples per station were carried out, and a total of 20 BC samples were collected from 11 different stations at water depths between 157 and 3,304 m (Fig. 1, Table 1)..
(3) Fig. 1 Position of the stations sampled on the ‘BENTART-06’ cruise. The inset shows the Bellingshausen Sea (BS) location in Antarctica. At each station, the first BC sample was equally subdivided into four equal sub-samples of 0.063 m2. On the first sub-sample, temperature measurements and redox profiles (Eh) of sediment were performed immediately after sampling. Redox values (Eh) were measured with an Orion ORP 9678 electrode coupled to an Orion 3 Star Portable pH metre. A standard ORP solution (Orion 967861) was used as a reference. Subsequently, analyses of sediment granulometry, organic matter and carbonates’ contents of the sediment were performed following the standard methods detailed in Eleftheriou and McIntyre (2005). Granulometric fractions were defined following Wentworth’s classification system (Wentworth 1922): gravel (grain size > 2 mm), coarse sand (grain size between 2 and 0.5 mm), medium sand (grain size between 0.5 and 0.25 mm), fine sand (grain size between 0.25 and 0.0625 mm) and mud (grain size < 0.0625 mm), and the respective percentages were noted. The carbonate content (CO3%) of the sediment was measured after treatment with hydrochloric acid, and the total organic matter content (OM%) was estimated from the sediment weight loss after 4 h heating in an oven at 450°C. The other subsamples were used for quantitative assessment of the fauna present in the sediment. For each subsample, the sediment was sieved through three mesh sizes (5.0, 1.0 and 0.5 mm) and the fauna collected was then sorted according to major taxonomic groups (Table 2). Finally, samples were preserved either in a buffered 4% formaldehyde seawater solution or in 70% ethanol for further identification analysis..
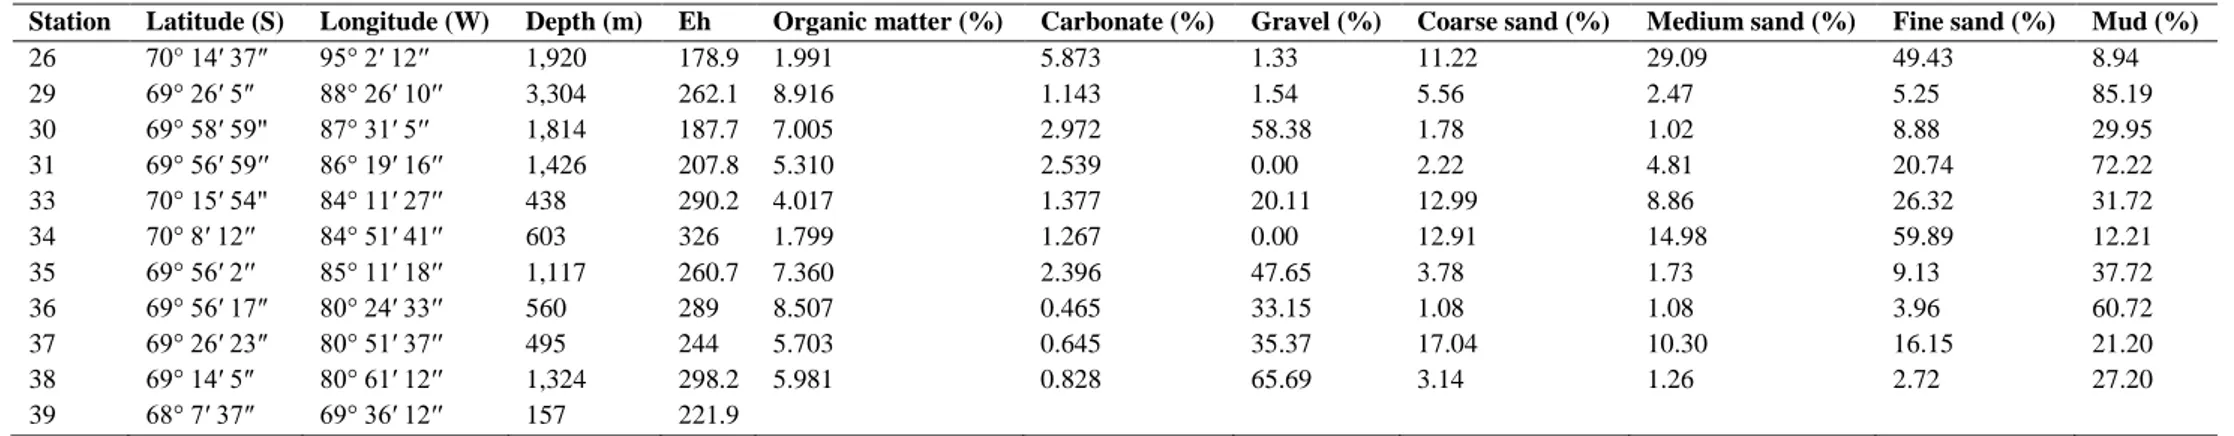
(4) Table 1 Station list with location and environmental parameters at the seafloor surface Station 26 29 30 31 33 34 35 36 37 38 39. Latitude (S) 70° 14′ 37″ 69° 26′ 5″ 69° 58′ 59" 69° 56′ 59′′ 70° 15′ 54" 70° 8′ 12′′ 69° 56′ 2′′ 69° 56′ 17″ 69° 26′ 23″ 69° 14′ 5″ 68° 7′ 37″. Longitude (W) 95° 2′ 12′′ 88° 26′ 10′′ 87° 31′ 5′′ 86° 19′ 16′′ 84° 11′ 27′′ 84° 51′ 41′′ 85° 11′ 18′′ 80° 24′ 33′′ 80° 51′ 37′′ 80° 61′ 12′′ 69° 36′ 12′′. Depth (m) 1,920 3,304 1,814 1,426 438 603 1,117 560 495 1,324 157. Eh 178.9 262.1 187.7 207.8 290.2 326 260.7 289 244 298.2 221.9. Organic matter (%) 1.991 8.916 7.005 5.310 4.017 1.799 7.360 8.507 5.703 5.981. Carbonate (%) 5.873 1.143 2.972 2.539 1.377 1.267 2.396 0.465 0.645 0.828. Gravel (%) 1.33 1.54 58.38 0.00 20.11 0.00 47.65 33.15 35.37 65.69. Gravel (>2 mm), coarse sand (>0.5 mm), medium sand (>0.25 mm), fine sand (>0.0625 mm), mud (<0.0625 mm). Coarse sand (%) 11.22 5.56 1.78 2.22 12.99 12.91 3.78 1.08 17.04 3.14. Medium sand (%) 29.09 2.47 1.02 4.81 8.86 14.98 1.73 1.08 10.30 1.26. Fine sand (%) 49.43 5.25 8.88 20.74 26.32 59.89 9.13 3.96 16.15 2.72. Mud (%) 8.94 85.19 29.95 72.22 31.72 12.21 37.72 60.72 21.20 27.20.
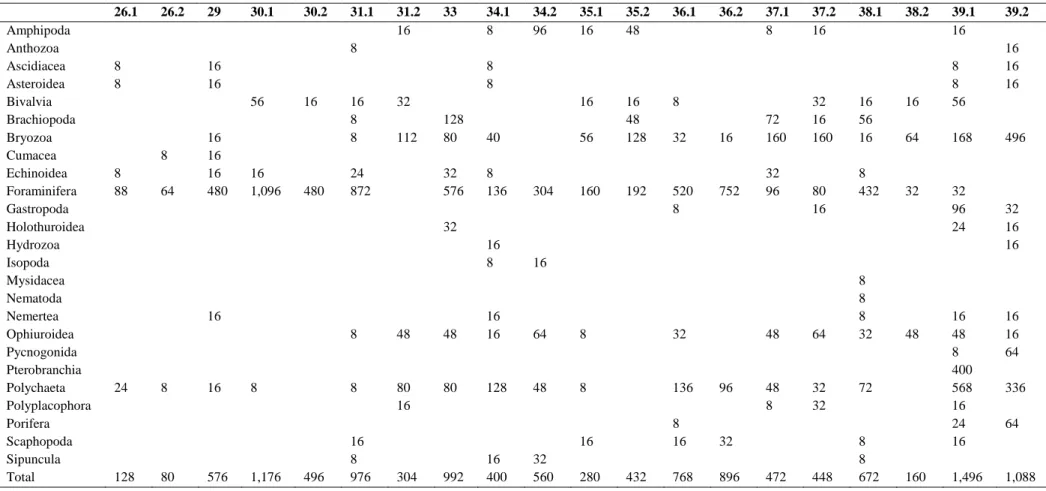
(5) Table 2 Taxa abundance per square metre detected on the ‘BENTART-06’ cruise 26.1 Amphipoda Anthozoa Ascidiacea Asteroidea Bivalvia Brachiopoda Bryozoa Cumacea Echinoidea Foraminifera Gastropoda Holothuroidea Hydrozoa Isopoda Mysidacea Nematoda Nemertea Ophiuroidea Pycnogonida Pterobranchia Polychaeta Polyplacophora Porifera Scaphopoda Sipuncula Total. 26.2. 29. 30.1. 30.2. 31.1. 31.2 16. 33. 34.1 8. 34.2 96. 35.1 16. 35.2 48. 36.1. 36.2. 37.1 8. 37.2 16. 38.1. 38.2. 39.1 16. 8 8 8. 16 16. 8 8 56. 8 8 88. 64. 16 16 16 480. 16 1,096. 16. 480. 16 8 8. 32 112. 24 872. 16 128 80. 40. 32 576. 8 136. 304. 8. 56. 16 48 128. 32. 16. 72 160. 160. 192. 520 8. 752. 32 96. 32 16 160. 80 16. 16 56 16 8 432. 16. 8 8 56. 64. 168. 32. 32 96 24. 32 16 8. 16. 24. 128. 8. 80. 16. 576. 48. 48. 16 16. 64. 8. 32. 8. 8. 80 16. 80. 128. 48. 8. 136. 96. 16. 8 16. 32. 1,176. 16 8 976. 768. 896. 304. 992. 16 400. 16 16 16. 496. 32 16 16. 16. 8. 496. 39.2. 32 560. 280. 432. 48. 64. 48 8. 32 32. 472. 448. 8 8 8 32. 48. 72. 8 8 672. 160. 16 48 8 400 568 16 24 16. 16 16 64. 1,496. 1,088. 336 64.
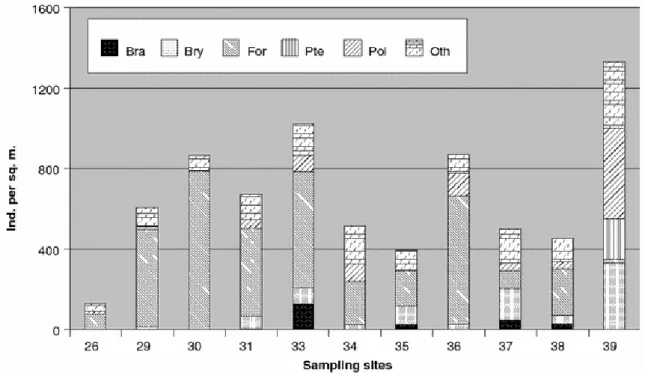
(6) Data analysis Data were organised with each station by taxa matrices (Table 2). Univariate measurements such as total abundance (N) and number of taxa (T) were calculated for each sampling station (Table 3). The composition of macrobenthic assemblages was analysed by means of nonparametric multivariate techniques as described by Field et al. (1982) using the PRIMER v 5.0 (Plymouth Routines in Multivariate Ecological Research) software package (Clarke and Gorley 2001). A matrix of similarity between samples was constructed by means of the BrayCurtis similarity coefficient by first applying fourth root transformation on abundance figures to down-weight the contribution of the most abundant taxa. From this matrix the 20 box-core samples were classified by cluster analysis based on the group-average sorting algorithm, as well as an ordination analysis was performed by means of a non-metrical multidimensional scaling (MDS). The SIMPER routine was then used to identify taxa that contributed greatly to distinctions between station groups. Table 3 Figures for number of taxa (T) and abundance (N) over all the sampling sites investigated on the ‘BENTART-06’ cruise. An average for each sampling site was estimated from several boxcore subsamples when available. Site 26 29 30 31 33 34 35 36 37 38 39. T 5 7 4 12 8 11 8 9 10 12 17. N 91 288 949 752 496 453 331 811 464 501 1,360. Investigations into the environmental factors having a potential influence on the macrobenthic distribution were carried out using the BIO-ENV routine (Clarke and Ainsworth 1993) of PRIMER package and canonical correspondence analysis (CCA) using the CANOCO (v. 3.10) and CanoDraw (v. 3.0) programs of ter Braak (1988, 1990) and Smilauer (1992), respectively. Specifically, depth (m) and the following abiotic variables were used in the analyses: redox state (Eh) of sediments, organic matter content (OM) (as %), different granulometric fractions and carbonate content (%). All these abiotic variables were standardised prior to analysis. Principal component analysis (PCA) was performed to reduce the number of autocorrelated environmental variables.. Results Abundance, taxa richness and diversity About 6,496 individuals belonging to 25 major taxa were collected (Table 2). The lowest abundance value was recorded at station 26 (91 indiv./m2), at a depth of 1,920 m (located at the western part of BS); while the highest was recorded at station 39 (1,360 indiv./m2), at 157 m deep at Margarite Bay (eastern area); this was due to the abundance of sedentary Polychaeta (432 indiv./m2) and Pterobranchia (267 indiv./m2) (Fig. 2). Taxa richness ranged from 4 (station 30) to 17 (station 39)..
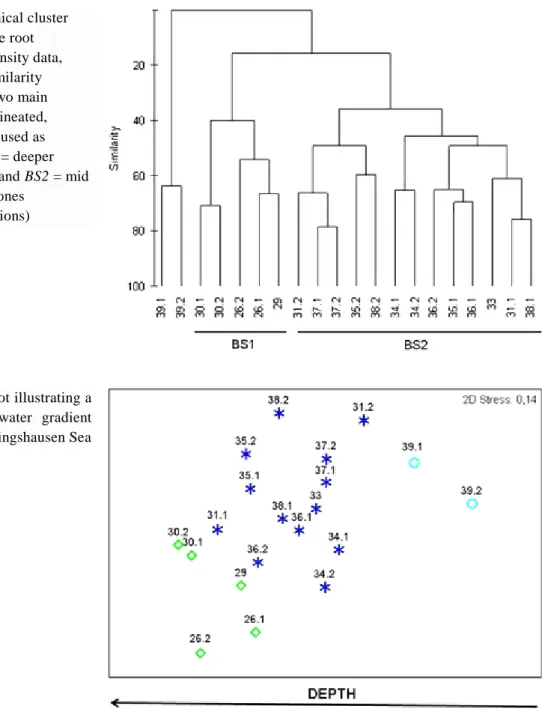
(7) Fig. 2 Taxonomic composition of benthic fauna from box-core samples taken in the Bellingshausen Sea. An average was estimated for each sampling site when available. Acronyms: Bra brachiopods, Bry bryozoans, For foraminiferans; Pte pterobranchs; Polpolychaetes; Ot h others. Benthic assemblages Cluster analysis (Fig. 3) shows that stations can be placed together into three main groups with a similarity level of 50%. Group BS1 includes three deep-water stations (between 1,814 and 3,304 m in depth) located in the western sector of BS with bottoms that show a high percentage of carbonates. Group BS2 comprises eight shallow and mid-water stations (157– 1,426 m deep) with medium levels of mud and low percentages of carbonates. The MDS ordination plot (Fig. 4) shows similar results to those of the dendrogram, with an acceptable stress value (0.14). Sampling sites are segregated along the first dimension which can be easily identified as a depth gradient from deeper stations off the western sector of the BS to the eastern shallow water stations closer to the Antarctic Peninsula. In fact, a Spearman rank correlation of depth and MDS x-axis co-ordinates (a one-dimensional measure of taxa change) gave a coefficient of 0.79 (P < 0.01). The dispersion of sampling sites along the vertical MDS axis being distinctly less well pronounced, was negatively correlated with the recorded redox values of surficial sediments (ρ = −0.6), although lacking significance (P = 0.07)..
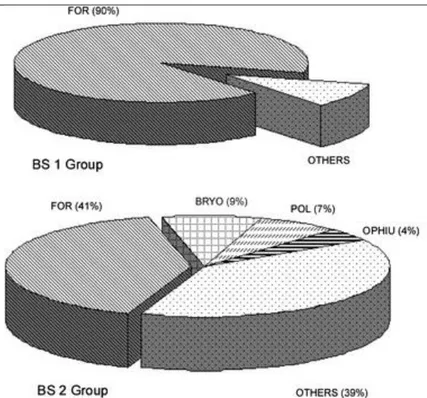
(8) Fig. 3 Hierarchical cluster analysis (square root transformed density data, Bray-Curtis similarity coefficient). Two main clusters are delineated, besides site 39 used as reference. BS1 = deeper sampling sites and BS2 = mid and shallower ones (remaining stations). Fig. 4 MDS plot illustrating a deep-shallow water gradient across the Bellingshausen Sea. The results of the SIMPER analysis for the similarity of groups BS1 and BS2 are shown in Table 4. Foraminifera, Bryozoa, Polychaeta and Ophiuroidea account for almost 80% of the dissimilarity level between deeper-water group BS1 and the mid-water and shallower stations of group BS2. In short (see Fig. 5), deeper sampling sites (BS1) are dominated almost exclusively by Foraminifera, whereas mid-water sites (BS2) exhibit further coverage of bryozoan colonies over drop stones and also a superficial film of small Polychaeta. It is quite evident that BS2 sampling sites show a more characteristic balance between microfauna and macrofauna (Fig. 5)..
(9) Table 4 Results of SIMPER analysis Av. abund. Av. sim. Sim./SD Contrib. (%) Cum. (%) Group BS 1 (av. sim.: 41.2%) Foraminifera 441.60 38.19 1.47 92.71 92.71 Group BS 2 (av. sim.: 48.3%) Foraminifera 319.38 23.74 1.25 53.89 53.89 Bryozoa 67.08 7.76 0.84 17.60 71.49 Polychaeta 56.62 4.94 0.90 11.21 82.70 Av. Av. Av. diss. Diss./SD Contrib. Cum. (%) abund. abund. (BS 1 and (%) (BS 1) (BS 2) BS 2) MB1 and MB2 (av. dissimil.: 64.11%) Foraminifera 441.6 319.38 34.05 1.53 53.11 53.11 Bryozoa 3.2 67.08 8.61 0.95 13.43 66.53 Polychaeta 11.2 56.62 5.47 1.07 8.54 75.07 Ophiuroidea 0.0 32.00 4.05 0.97 6.32 81.39 Taxa are ranked according to their average contribution to similarity within (top tables) or between (down table) assemblages BS 1 and BS 2. Average abundances, ratio (similarity or dissimilarity/standard deviation, Sim./SD), and percentage of cumulative similarity are also included. A cut-off at a cumulative % dissimilarity of 80% was applied. Fig. 5 Taxa composition at two main station groups as defined by cluster analyses. Abbrev.: BS 1: deeper sites group (top); BS 2: shallower sites group (bottom); Acronyms: FORForaminifera, B RYO Bryozoa, POL Polychaeta, OPHIU Ophiuroidea. Relationship between biotic and environmental variables Sediment samples collected across the BS encompass bottoms that lie between the sublittoral and bathyal zones (157–3,304 m deep). Sediments are mainly composed of gravels and mud, with a medium organic matter content (Table 1). Superficial sediments appear to be oxidised,.
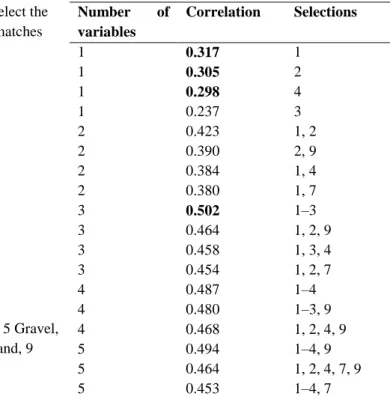
(10) as shown by redox (Eh) values in excess of 178.9 mV. In most stations, the carbonate content of sediments is relatively low. The BIO-ENV procedure (Table 5) shows that the best combination of environmental variables with the highest correlation with the faunistic data recorded (ρw: 0.502) is a combination of water depth, Eh values and OM of the sediments. Particularly, depth is the variable matching the best result when each abiotic variable is considered separately (ρw: 0.317).. Table 5 Result of BIOENV analysis to select the number of abiotic variables which best matches the biotic matrix. Numbers in bold indicate best matches Variables: 1 Depth, 2 Eh, 3 OM, 4 CO3, 5 Gravel, 6 Coarse sand, 7 Medium sand, 8 Fine sand, 9 Mud. Number variables 1 1 1 1 2 2 2 2 3 3 3 3 4 4 4 5 5 5. of. Correlation. Selections. 0.317 0.305 0.298 0.237 0.423 0.390 0.384 0.380 0.502 0.464 0.458 0.454 0.487 0.480 0.468 0.494 0.464 0.453. 1 2 4 3 1, 2 2, 9 1, 4 1, 7 1–3 1, 2, 9 1, 3, 4 1, 2, 7 1–4 1–3, 9 1, 2, 4, 9 1–4, 9 1, 2, 4, 7, 9 1–4, 7. A preliminary principal component analysis (PCA) of the environmental variables of Table 1indicated that, for the sampling area, several fractions of ‘sand’ were highly autocorrelated with ‘gravel’ and ‘CO 3’ content of sediments. Consequently, they were considered ‘redundant’ and discarded for further ordination analysis. The ordination diagram (CCA) (Fig. 6) of the first two axes reveals the general relationships between faunal distribution on the sea-floor and the revised sub-set of environmental variables sampled in the field (sand fractions removed). Eigenvalues of the CCA are λ1 = 0.24 and λ2 = 0.19 for the two first axes. Both axes capture 41.5% of the cumulative variance of the macrobenthic data and 62.3% of the variance in the faunal–environment relationship (Table 6). The importance of the variables depth and redox is again shown by long vectors in the CCA plot (Fig. 6). OM is negatively correlated with redox, whereas CO 3 is relatively correlated with depth. The results reflect the sampling scheme, because most of the deepest sites (corresponding to cluster BS1 in Fig. 3) had their distribution optima along the depth gradient. Sampling sites 33, 34, and 36, positioned in the lower part of the diagram (Fig. 6), presented high redox values on the sediment surface. The remaining stations positioned to the upper left part of the CCA plot (Fig. 6) were moderately affected either by high deposits of gravel (stations 35, 37 and 38) or mud (station 31) at the sediment surface..
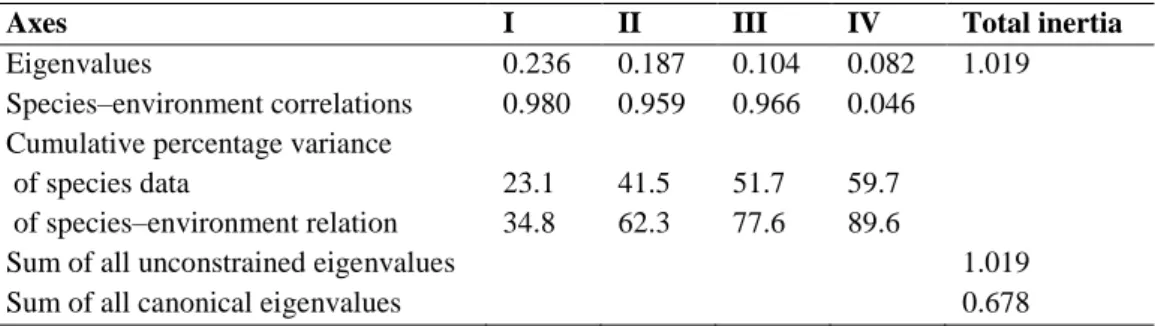
(11) Fig. 6 Canonical correspondence analysis (CCA) ordination showing sampling sites and a selection of environmental variables relative to axes I and II. Table 6 Summary statistics for the first four axes of Canonical Correspondence Analysis (CCA) Axes Eigenvalues Species–environment correlations Cumulative percentage variance of species data of species–environment relation Sum of all unconstrained eigenvalues Sum of all canonical eigenvalues. I 0.236 0.980. II 0.187 0.959. III 0.104 0.966. IV 0.082 0.046. 23.1 34.8. 41.5 62.3. 51.7 77.6. 59.7 89.6. Total inertia 1.019. 1.019 0.678. Discussion The decrease in the supply of organic matter as depth increases has long been considered the main limiting factor for the Antarctic benthos (Knox 1994; Arntz et al. 1994), which generally receives limited organic inputs of low nutritional quality at deeper bottoms (Piepenburg et al. 2002; Smith et al. 2006). We observed extreme differences in taxa richness and faunal densities over the area investigated. The high values of both faunal descriptors recorded at station 39 are probably a benthic response to the shallower depth of a sampling site which is located at the eastern border of the BS, close to the Antarctic Peninsula. Hence, this location may be considered as a control or reference situation of a ‘typical’ Antarctic benthos as characterised in previous papers by our team (Saiz-Salinas et al. 1997, 1998) with an average abundance of 1,236 indiv./m2. In fact, the figures recorded (taxa = 17 and density = 1,360 indiv./m2) in our study lie within the ranges previously compiled in the relevant literature by Jazdzewski et al. (1986), Mühlenhardt-Siegel (1988), Gerdes et al. (1992), Knox (1994) and Gambi et al. (1994) at similar depths. By contrast, the average figure.
(12) for the BS shows (taxa = 9 and density = 493 indiv./m2) lower abundances with— remarkably—even lower figures at deeper bottoms (taxa = 4; density = 90 indiv./m2). In general, the benthic response of the seabed of the BS is quite poor, indicating the existence of a vast ‘benthic desert’ driven by an oligotrophic regime (Mouriño, personal communication), a situation which is exacerbated still further by the influence of physical disturbances (such as iceberg scouring) and depth. Considering abundance and richness levels of individual taxa, variations between the main clusters of stations detected in the multivariate analysis reveal two contrasting faunal strategies that are well illustrated in Fig. 5. Deeper sites (cluster BS1) show an exclusive dominance of foraminiferans (accounting for proportions of 90%) with correspondingly low biodiversity levels of other organisms. Similar observations have been reported in other polar studies (Wollenburg and Kuhnt 2000; Schewe and Soltwedel 2003) with a rapid reaction of foraminiferans species to the pulsed deposition of food particles from superficial waters onto the seabed. It is precisely the short reproduction cycles of Foraminifera that enable them to react rapidly to changing environmental conditions that favour opportunistic species capable of rapidly exploiting organic supplies deposited at the seafloor (Schewe and Soltwedel 2003). This should be considered in our opinion as an indication of the first steps in an ecological succession from barren sediments towards microfauna dominance led by pioneering opportunists, such as Foraminifera. In fact, sediment cores on board the vessel showed no traces of bioturbation, which may indicate negative effects by physical disturbances during the austral summer under conditions of low availability of food. By contrast, shallower sites (cluster BS2) show a greater heterogeneity of taxa, because Foraminifera shares its ecological dominance with an infauna of deposit-feeding Polychaeta and an epifauna of encrusting Bryozoa over pebbles and stones. In this case, sediment cores show a few burrows and many drop-stones over the surface coming from icebergs, with a rich encrusting fauna of small colonies of bryozoans. The abundance of bryozoans varies from 26 to 277 colonies/m2 throughout the sampling sites of cluster BS2. It has been suggested elsewhere that the availability of a hard substratum limits the abundance and diversity of bryozoans on the Hebridean continental slope (Hughes 2001). This author also notes that the small average size of the individual rocks severely limits the space available for subsequent growth and probably accounts for the prevalence of spot colony forms as observed in our survey. By contrast, Oschmann (1990) relates the low spatial coverage of epifauna on dropstones from the Norwegian Sea to seasonal food scarcity as a factor limiting community development. At this stage it is difficult to decide which is the most prevalent limiting factor (trophic ecology or physical disturbance, or even a combination of the two) responsible for the wide variation and size of bryozoan colonies on dropstones in the BS. On the other hand, the multivariate plots (Figs. 3, 4) also show a neat west–east gradient with taxa richness levels increasing towards the east where the Antarctic Peninsula lies. Taxa richness, which is an easy ‘surrogate’ for diversity, is negatively influenced by catastrophic disturbances derived from more intense iceberg traffic in the western area of the BS. In this sense, Hillenbrand et al. (2003) recently noted a prevalence of foraminiferal deposits in the western part of the BS, whereas the eastern area is characterised by diatom-bearing and carbonate-free sediments. Moreover, they relate the sedimentary differences with opposite modes of biological production driven by contrasting oceanographic regimes. These.
(13) differences drastically affect faunal assemblages on the sea floor as recorded by our own results. Plausible alternative explanations can be offered for all the environmental variables best correlated with the multivariate spatial pattern detected throughout the BS. Depth, redox values and carbonates achieve the highest correlation values on their own (ρw ≥ 0.3). The separate effects of abiotic variables on biota distribution are improved more by a synergy of depth, redox values and OM content of the sediments (ρw > 0.5), as shown by the BIO-ENV analysis. In energy-limited systems such as deep sea or polar waters, food supply has repeatedly been proposed as the prime agent controlling macrofauna on the seafloor (Piepenburg et al. 2002). But the improvement recorded in the final result of the BIO-ENV introduced by the redox state of the sediments might indicate a role for microorganisms in converting refractory OM into better-quality food for the benthos as noted by Kröncke et al. (2000) in the Arctic. As both the BIO-ENV procedure and CCA analysis separately identified ‘depth’, ‘redox’ and (to a lesser extent) ‘OM’ as the major environmental variables influencing the faunal distribution along the BS, the results obtained with two different statistical techniques can be viewed with a reasonable degree of confidence. Other physical disturbances, not sampled by our survey and linked to intense iceberg traffic from the mainland (such as iceberg scouring over the sea-floor, high sedimentation rates and intense fall of drop-stones onto the sea-floor), were continuously observed; at least we were able to trace expected responses of the benthos with water depth and food quality, as shown in other general studies (Graf 1992; Piepenburg et al. 2002). In short, the exploratory expedition ‘BENTART-06’ provided a glimpse into this understudied Pacific sector of Antarctica. While the limited sample size does not enable broad conclusions to be drawn at this point, our results suggest a trend of faunal abundance decreasing with water depth, which is well established for other oceanic regions. This trend is most likely linked to limited low-quality food availability for the deep-sea benthos. The results also suggest a neat west–east spatial diversity gradient across the BS, with numbers of taxa increasing towards the east in accordance with the recent sedimentary analyses published by Hillenbrand et al. (2003). Nevertheless, a more comprehensive study of the fauna in the BS is needed to provide a complete faunal inventory and a better understanding of other ecological processes, especially before drastic changes occur in Antarctica due to global warming.. Acknowledgments The ‘BENTART-06’ cruise was funded by the Antarctic Programme GLC2004-01856/ANT of the Spanish Government. We would like to express our thanks to the crew and UTM technicians of R/V ‘Hespérides’, who helped in the collection of samples..
(14) References Arntz WE, Brey T, Gallardo VA (1994) Antarctic zoobenthos. Oceanogr Mar Biol Annu Rev 32:241–304 Clarke KR, Ainsworth M (1993) A method of linking multivariate community structure to environmental variables. Mar Ecol Prog Ser 92:205–219 Clarke KR, Gorley RN (2001) PRIMER (Plymouth Routines In Multivariate Ecological Research) v5: User manual/tutorial, pp 1–91 (PRIMER-E Ltd, Plymouth) Clarke A, Johnston NM (2003) Antarctic Marine Benthic diversity. Oceanogr Mar Biol Annu Rev 41:47–114 Eleftheriou A, McIntyre A (2005) Methods for the study of marine benthos. Blackwell, Oxford Field JG, Clarke KR, Warwick RM (1982) A practical strategy for analysis multispecies distribution patterns. Mar Ecol Prog Ser 46:7–12 Gambi MC, Lorenti M, Russo GF, Scipione MB (1994) Benthic associations of the shallow hard bottoms off Terra Nova Bay, Ross Sea: zonation, biomass and population structure. Antarct Sci 6:449–462 Gerdes D, Klages M, Arntz WE, Herman RL, Galeron J, Hain S (1992) Quantitative investigations on macrobenthos communities of the southeastern Weddell Sea shelf based on multibox corer samples. Polar Biol 12:291–301 Graf G (1992) Benthic-pelagic coupling: a benthic view. Oceanogr Mar Biol Annu Rev 30:149– 190 Hillenbrand C-D, Grobe H, Diekmann B, Kuhn G, Futterer DK (2003) Distribution of clay minerals and proxies for productivity in surface sediments of the Bellingshausen and Amundsen seas (West Antarctica). Relation to modern environmental conditions. Mar Geol 193:253–271 Hughes DJ (2001) Quantitative analysis of a deep-water bryozoan collection from the Hebridean continental slope. J Mar Biol Assoc UK 81:987–993 Jazdzewski K, Jurasz W, Kittel W, Premier E, Presier P, Sicinski J (1986) Abundance and biomass estimates of the benthic fauna in Admiralty Bay, King George Island, South Shetland Islands. Polar Biol 6:5–16 Knox GA (1994) The biology of the Southern Ocean. Cambridge University Press, Cambridge Kröncke I, Vanreusel A, Vincx M, Wollenburg J, Mackensen A, Liebezeit G, Behrends B (2000) Different benthic size compartments and their relation to sediment chemistry in the deep Eurasian Arctic Ocean. Mar Ecol Prog Ser 199:31–41 Matallanas J, Olaso I (2007) Fishes of the Bellingshausen Sea and Peter I Island. Polar Biol 30:333–341 Mühlenhardt-Siegel U (1988) Some results on quantitative investigations of macrozoobenthos in the Scotia Arc (Antarctica). Polar Biol 8:241–248 Oschmann W (1990) Dropstones—rocky mini-islands in high latitude pelagic soft substrate environments. Senckenberg Marit 21:55–75 Piepenburg D, Schmid MK, Gerdes D (2002) The benthos off King George Island (South Shetland Islands, Antarctica): further evidence for a lack of latitudinal biomass cline in the Southern Ocean. Polar Biol 25:146–158 Saiz-Salinas JI, Ramos A, García FJ, Troncoso JS, San Martín G, Sanz C, Palacín C (1997) Quantitative analysis of macrobenthic soft-bottom assemblages in South Shetland waters. Polar Biol 17:393–400.
(15) Saiz-Salinas JI, Ramos A, Munilla T, Rauschert M (1998) Changes in the biomass and dominant feeding mode of benthic assemblages with depth off Livingston Island (Antarctica). Polar Biol 19:424–428 Schewe I, Soltwedel T (2003) Benthic response to ice-edge-induced particle flux in the Arctic Ocean. Polar Biol 26:610–620 Smilauer P (1992) CanoDraw. User Guide v. 3.00. Environmental Change Research Centre, University College London, London Smith CR, Mincks S, DeMaster DJ (2006) A synthesis of bentho-pelagic coupling on the Antarctic shelf: food banks, ecosystem inertia and global climate change. Deep Sea Res II 53:875–894 Ter Braak CJF (1988) CANOCO a FORTRAN programme for canonical community ordination by [partial] [detrended] [canonical] correspondence analysis, principal components analysis and redundancy analysis (version 2.1). Agricultural Mathematics Group, Wageningen Ter Braak CJF (1990) Update notes: Canoco version 3.1. Agricultural Mathematics Group, Wageningen Troncoso JS, Aldea C, Arnaud P, Ramos A, García F (2007) Quantitative analysis of softbottom molluscs in the Bellingshausen Sea and around Peter I Island. Polar Res 26(2):126– 134 Wentworth CK (1922) A scale of grade and class terms for clastic sediments. J Geol 30:377– 392 Wollenburg JE, Kuhnt W (2000) The response of benthic foraminifers to carbon flux and primary production in the Arctic Ocean. Mar Micropaleontol 40:189–231.
(16)
Figure
+5
Documento similar
7 ; otra posterior, también con intere- ses puramente comerciales pero protagonizada por otros navegantes orientales de procedencia heterogénea, marcará la presencia de protofeni-
In the previous sections we have shown how astronomical alignments and solar hierophanies – with a common interest in the solstices − were substantiated in the
Díaz Soto has raised the point about banning religious garb in the ―public space.‖ He states, ―for example, in most Spanish public Universities, there is a Catholic chapel
What is perhaps most striking from a historical point of view is the university’s lengthy history as an exclusively male community.. The question of gender obviously has a major role
In the preparation of this report, the Venice Commission has relied on the comments of its rapporteurs; its recently adopted Report on Respect for Democracy, Human Rights and the Rule
It is generally believed the recitation of the seven or the ten reciters of the first, second and third century of Islam are valid and the Muslims are allowed to adopt either of
ABSTRACT Transformation of the Specialized Knowledge of Future Primary Teachers on Fraction Division
From the phenomenology associated with contexts (C.1), for the statement of task T 1.1 , the future teachers use their knowledge of situations of the personal
In the “big picture” perspective of the recent years that we have described in Brazil, Spain, Portugal and Puerto Rico there are some similarities and important differences,
