Immunological and Biological Characterization of Blomia tropicalis Allergens
173
0
0
Texto completo
(2) Caracterización Inmunológica y Biológica de Alergenos de Blomia tropicalis. Tesis doctoral en la Universidad de Cartagena para obtener el título académico de:. Doctor en Ciencias Biomédicas. JOSEFINA ZAKZUK SIERRA, MD Supervisor: Luis Caraballo, MD, DSc Universidad de Cartagena en Cartagena, Colombia Submitted: 2012. 2.
(3) ABBREVIATIONS ..................................................................................................................7 ABSTRACT ...........................................................................................................................8 ROAD MAP OF THIS THESIS ................................................................................................ 10 ACKNOWLEDGEMENTS ...................................................................................................... 11 CHAPTER 1. GENERAL INTRODUCTION ......................................................................... 12 1.. IGE RESPONSES AND ALLERGY ............................................................................................. 13. 1.1. ALLERGENS ..........................................................................................................................13 1.2. ADJUVANTS .........................................................................................................................18 1.3. RISK FACTORS FOR ALLERGY AND ASTHMA ..................................................................................19. 1.4. ALLERGY DIAGNOSIS ..............................................................................................................21 1.4.1. COMPONENT RESOLVED DIAGNOSIS ..........................................................................................21 1.5. TREATMENT ............................................................................................................................22 HYPOTHESIS ...................................................................................................................... 24 THESIS AIMS ...................................................................................................................... 25 CHAPTER 2. MATERIAL AND METHODS ........................................................................ 26 2.1. SUBJECTS.................................................................................................................... 26 2.2. ALLERGEN OBTENTION ................................................................................................... 27 2.2.1. ALLERGENIC EXTRACTS........................................................................................................27 2.2.2. BLO T 12 ALLERGEN GROUP .................................................................................................27 2.2.3. GLUTHATHIONE S TRANSFERASE FROM B. TROPICALIS (BLO T 8) AND OTHER SOURCES....................30 2.2.4. BLO T 5 ............................................................................................................................31 2.2.5. UBIQUITIN FROM B. TROPICALIS ...........................................................................................32 2.2.6. OTHER RECOMBINANT ALLERGENS ........................................................................................32. 3.
(4) 2.3. OBTENTION OF OTHER BIOLOGICAL SAMPLES ....................................................................... 33 2.3.1. POLYCLONAL ANTIBODIES ....................................................................................................33 2.3.2. MONOCLONAL ANTIBODIES .................................................................................................33 2.4. PHYSICO-CHEMICAL CHARACTERIZATION OF PROTEINS ........................................................... 34 2.4.1. SDS-PAGE ......................................................................................................................34 2.4.2. TWO DIMENSIONAL ELECTROPHORESIS...................................................................................35 2.4.3. GLYCOSYLATION DETECTION.................................................................................................35 2.4.4. DEGLYCOSYLATION PROCEDURES ..........................................................................................36 2.4.5. SECTDA ..........................................................................................................................36 2.4.6. LC MS/MS ......................................................................................................................37 2.5. IMMUNOCHEMICAL PROCEDURES ..................................................................................... 37 2.5.1. TOTAL IGE DETERMINATION .................................................................................................37 2.5.2. HOUSEHOLD INDIRECT ELISA FOR SPECIFIC IGE DETERMINATION ................................................38 2.5.3. ELISA INHIBITION ..............................................................................................................39 2.5.4. SANDWICH ELISA ..............................................................................................................39 2.5.5. WESTERN BLOT .................................................................................................................40 2.5.6. EPITOPE MAPPING .............................................................................................................40 2.6. SKIN PRICK TESTS .......................................................................................................... 41 2.7. BIOINFORMATICS ANALYSIS AND ALLERGEN MODELING .......................................................... 42 2.8. EVALUATION OF THE BIOLOGICAL ACTIVITY OF BLO T 12 ......................................................... 43 2.8.1. AFFINITY BINDING ASSAYS....................................................................................................43 2.8.2. ANIMAL MODEL OF BLO T 12 SENSITIZATION...........................................................................43 2.9. BIRTH COHORT STUDY.................................................................................................... 45 2.9.1. EPIDEMIOLOGICAL DESCRIPTION OF THE COHORT .....................................................................45 2.9.2. SERUM SAMPLES................................................................................................................45 2.9.3. QUANTIFICATION OF TOTAL AND SPECIFIC IGE ........................................................................46 2.9.4. STOOL SAMPLES AND PARASITOLOGICAL EXAMINATION .............................................................46 2.9.5. DEFINITIONS OF CLINICAL PHENOTYPES AND OTHER OUTCOMES ..................................................47 2.9.6. COLLECTION OF DUST SAMPLES.............................................................................................47 2.9.7. STATISTICAL ANALYSIS .........................................................................................................48 RESULTS ............................................................................................................................ 49. 4.
(5) CHAPTER 3. IMMUNOLOGICAL AND BIOLOGICAL CHARACTERIZATION OF GROUP 12 ALLERGENS FROM BLOMIA TROPICALIS ............................................ 50 OVERVIEW ........................................................................................................................... 50 3.1. EVALUATION OF IGE IMMUNE RESPONSE TO BLO T 12 ISOFORMS ................................................ 52 3.1.1. INTRODUCTION.....................................................................................................................52 3.1.2. RESULTS ..............................................................................................................................53 3.1.3. DISCUSSION OF RESULTS .........................................................................................................58 3.2. PHYSICO-CHEMICAL CHARACTERIZATION OF PICHIA PASTORIS PRODUCED BLO T 12.0101 ................. 63 3.2.1. INTRODUCTION.....................................................................................................................63 3.2.2. RESULTS ..............................................................................................................................63 3.2.3. DISCUSSION OF RESULTS .........................................................................................................66 3.3. CHARACTERIZATION OF NATURAL BLO T 12 AND THE REPRESENTATIVENESS OF ITS RECOMBINANT COUNTERPARTS ..................................................................................................................... 68. 3.3.1. INTRODUCTION.....................................................................................................................68 3.3.2. RESULTS ..............................................................................................................................68 3.3.3. DISCUSSION OF RESULTS .........................................................................................................75 3.4. BLO T 12 IS A SPECIES-SPECIFIC MARKER OF BLOMIA TROPICALIS ................................................. 77 3.4.1. INTRODUCTION.....................................................................................................................77 3.4.2. RESULTS ..............................................................................................................................78 3.4.3. DISCUSSION OF RESULTS .........................................................................................................79 3.5. TESTING THE BIOLOGICAL ACTIVITY OF BLO T 12 AND ITS INFLUENCE OF ALLERGIC SENSITIZATION......... 80 3.5.1. INTRODUCTION.....................................................................................................................80 3.5.2 RESULTS ...............................................................................................................................80 3.5.3. DISCUSSION OF RESULTS .........................................................................................................85 CHAPTER 4. IDENTIFICATION OF NOVEL BLOMIA TROPICALIS ALLERGENS ..................... 88 4.1. IMMUNOLOGICAL STUDIES ABOUT BLO T 8, THE GLUTHATHIONE-S-TRANSFERASE (GST) FROM B. TROPICALIS ........................................................................................................................... 90. 4.1.1. INTRODUCTION .................................................................................................................90 4.1.2. RESULTS...........................................................................................................................90 4.1.3. DISCUSSION OF RESULTS......................................................................................................97. 5.
(6) 4.2. IMMUNOLOGICAL STUDIES ABOUT THE UBIQUITIN FROM BLOMIA TROPICALIS ............................... 100 4.2.1. INTRODUCTION...................................................................................................................100 4.2.2. RESULTS ............................................................................................................................100 4.2.3. DISCUSSION OF RESULTS .......................................................................................................103 CHAPTER 5. UNDERSTANDING THE EARLY IMMUNE RESPONSE TO B. TROPICALIS ALLERGENS AND ITS CLINICAL IMPACT IN CHILDREN FROM THE TROPICS .......................... 104 OVERVIEW ......................................................................................................................... 104 5.1. EPIDEMIOLOGICAL DESCRIPTION OF THE FRAAT COHORT ....................................................... 105 5.1.1. INTRODUCTION...................................................................................................................105 5.1.2. RESULTS ................................................................................................................... 107 5.1.3. DISCUSSION OF RESULTS .......................................................................................................111 5.2 IMPACT OF CORD BLOOD IGE, MATERNAL IGE AND OTHER PRENATAL FACTORS ON EARLY SENSITIZATION TO BLOMIA TROPICALIS ......................................................................................................... 117. 5.2.1. INTRODUCTION ...............................................................................................................117 5.2.2. RESULTS.........................................................................................................................118 5.2.3. DISCUSSION ....................................................................................................................130 5.3. EVALUATION OF IGE RESPONSE TO BLOMIA TROPICALIS AND ASCARIS COMPONENTS .................. 135 5.3.1. INTRODUCTION...................................................................................................................135 5.3.2. RESULTS ............................................................................................................................136 5.3.3. DISCUSSION OF RESULTS .......................................................................................................142 CHAPTER 7. GENERAL DISCUSSION ............................................................................ 144 FUTURE PERSPECTIVES..................................................................................................... 150 REFERENCES .................................................................................................................... 152 APPENDIXES .................................................................................................................... 171. 6.
(7) Abbreviations 2D: two dimensional. nBlo t 12: natural Blo t 12. AscGST: GST from Ascaris. nBlo t 8: natural Blo t 8. bp: base pairs. ON: overnight. CB: cord blood. OR: odds ratio. CBD: chitin binding domain. OVA: ovalbumin. CBP: chitin binding protein. PAGE: polyacrylamide gel electrophoresis. cDNA: complementary deoxinucleotide acid. pAb: policlonal antibody. CR: cross-reactivity. pBlo t 12.0101: Blo t 12.0101 expressed in Pichia pastoris. CRI: cross-reactivity index PBS: phosphate buffer saline CRD: component resolved diagnosis PCR: polymerase chain reaction ELISA: Enzyme linked immunosorbent assay PNGase: peptidoglycanase F e.p.g.: eggs per gram PVDF: polyvinylidene fluoride HDM: house dust mites rBlo t 8: recombinant Blo t 8 Ig: Immunoglobulin RNA: ribonucleic acid LC-MS/MS: Mass spectrometry ROC: receiver operator characteristics GST: Gluthathione-S-transferase RT: room temperature LB: Luria bertani r.p.m.: revolutions per minute LBA: LB supplemented with ampicillin SDS: sodium duodecyl sulphate kDa: kilodalton SIT: allergen specific-immunotherapy mAb: monoclonal antibody SPT: skin prick test MW: molecular weight SSM: species specific-marker NBB: native binding buffer. 7.
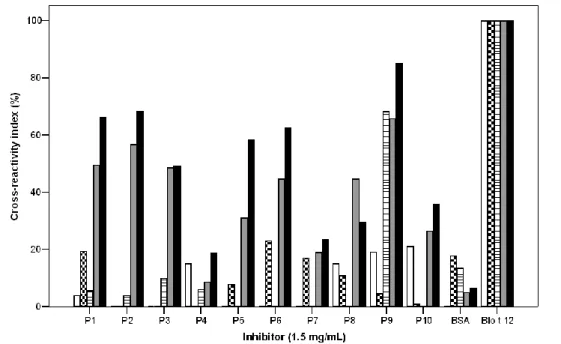
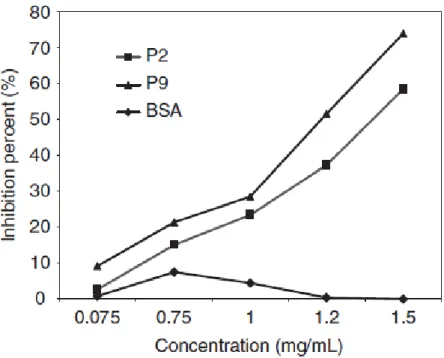
(8) Abstract Aim: This doctoral thesis aimed to understand more aspects about the great allergenic potential of B. tropicalis through the characterization of purified allergens and the evaluation of their clinical impact. Methods: Serum samples were obtained from three ongoing epidemiological programs from the Institute for Immunological Research in the University of Cartagena. Allergens were isolated from a cDNA library from B. tropicalis or, otherwise, their nucleotide sequences were synthesized by a commercial supplier (Genscript, USA). Natural allergens were purified by affinity chromatography. Anti-Blo t 12 mAbs and pAbs were obtained for allergen characterization. A murine model of asthma was done with Blo t 12 isoforms in the presence or not of chitin fragments. Immunochemical methods (ELISA, ELISA inhibition, WB and WB inhibition) and SPT were used for allergen characterization. In the FRAAT birth cohort study, IgE determination was done by ImmunoCap (B. tropicalis, D. pteronyssinus, Ascaris spp. and total IgE) and ELISA (Blo t 5, Blo t 12, AscGST, Asc l 3 and Asc s 1). Results: Chapter 3: IgE reactivity to Blo t 12.0101, a locally isolated isoform, was more frequent (36%) and intense than that to Blo t 12.0102 (23%), obtained from Singapore. The variant .0101, but not the .0102, was found to be glycosylated and this modification reduced antibody reactivity. Natural Blo t 12 could be isolated from B. tropicalis extract with antibodies raised in pBlo t 12.0101 immunized animals. IgE response to nBlo t 12 was more intense than that to any of the .0101 recombinants, E. coli or P. pastoris; however, both recombinants could diagnose most cases of Blo t 12 sensitization. There was not detected CR among Blo t 12 and other components from HDM and storage mites, other arthropods or Ascaris lumbricoides. In BALBc mice, both Blo t 12 isoforms induced airway inflammation (neutrophil-rich) and bronchial hyperreactivity without the need of an adjuvant (alum or chitin). However, chitin administration with .0101 isoform induced a more intense total IgE and methacholine response. Chapter 4: Two new IgE reactive-components from B. tropicalis were isolated. Blo t 8, the GST from B. tropicalis, was detected as a common (45-80%), but mild, IgE sensitizer. It was predicted to contain surface exposed amino-acids clusters, shared with other GST from allergenic sources, including HDM and Ascaris. Specific IgE levels to nBlo t 8 or the recombinant isoform were highly correlated, but more intense to the former. Ubiquitin showed 100% amino acid sequence identity to human ubiquitin. IgE reactivity was found in 23.6% (n = 26) of asthmatic patients and. 8.
(9) 4.7% (n = 3) of controls. Mean specific IgE levels were higher in asthmatics (0.295 ± 0.15 vs. 0.150 ± 0.09, P = 0.001). Chapter 5: In the FRAAT birth cohort (n=326) most children lived in poverty conditions. At 24 months, the prevalence of “wheezing ever” was 38.3% and 14.2% for recurrent wheezing. Maternal asthma was the main predisposing factor for wheezing [aOR 3.65 (95%CI 1.23-10.8), p = 0.01]. Clinical symptoms of milk/egg allergy or other food-induced allergies were scarce (1.8%) and no case of atopic eczema was observed. Maternal total IgE (aOR: 2.43, 95% CI: 1.09-5.43; p = 0.03) and poverty markers were associated with high cord blood (CB) total IgE. High CB total IgE was positively associated with B. tropicalis sensitization (Estimate: 0.42 p < 0.001) but protected from recurrent wheezing (aOR: 0.26, 95% CI 0.08-0.88, p = 0.03). Prevalence of IgE sensitization to HDM was high, especially to B. tropicalis, and increased with age. Unhygienic conditions were risk factors for B. tropicalis sensitization in children. HDM sensitization (and also B. tropicalis specific IgE) was weakly associated to ever-wheezing (aOR: 2.03, 95% CI 0.99-4.15, p = 0.05), with a population-attributable fraction of 19.7%. Conclusions: Valuable information about the allergenic potential of B. tropicalis was obtained from the characterization of purified allergens: . Blo t 12.0101 is a representative isoform of group 12. It is a species specific marker of B. tropicalis, thus, the developed two-site ELISA for its quantification can be useful to measure environmental exposition to B. tropicalis.. Although less potent than the natural allergen,. recombinant Blo t 12.0101 molecules can diagnose most cases of Blo t 12 sensitization. The chitin binding activity of this allergen influences total IgE production and bronchial hyperreactivity in mice. . Blo t 8 is a frequent, but mild, IgE sensitizer in the characterized population. CR with other GSTs, including AscGST is supported by its molecular similarity.. . Ubiquitin is a new allergen from Blomia tropicalis. Our data suggest that it could be clinically relevant in asthma. Since the sequence of this allergen is identical to human ubiquitin, the possibility of an autorreactive response due to cross-reactivity should be further investigated.. . In this socioeconomically deprived population living in the tropics wheezing, but not atopic eczema, is a common problem. Total IgE levels were influenced by maternal IgE and were protective from wheezing. The frequency of sensitization to any HDM, especially to B. tropicalis, during the first three years of age is high and associated with wheezing. Although, HDM and Ascaris IgE levels are highly correlated, it could be discriminated that most double positive children are actually co-sensitized; positivity to nematode and B. tropicalis specific markers were very frequent.. 9.
(10) Road map of this thesis To help the reader here I describe the structure of this doctoral thesis. The conventional background, methods, results, and discussion format has been followed. All the investigations during my doctoral formation were intended to understand several aspects related to the allergenic potential of B. tropicalis and its relationship with other allergenic sources of relevance in the tropics; however, since their results can be grouped into three main topics, they were divided into individual chapters: the characterization of Blo t 12 allergen (chapter 3), description of novel allergens from B. tropicalis (chapter 4) and a comprehensive study about the evolution of IgE responses to B. tropicalis components in early infancy (chapter 5). The methods used in all these investigations were described in one single section (chapter 2) because most protocols for allergen characterization were similar for all the tested molecules, otherwise, important modifications were described. A general discussion about the most important findings of this thesis was presented in chapter 6. Future perspectives of these investigations were shown in chapter 7. The Appendix includes 2 tables with materials and equipment and also the list of publications from this thesis work. It is also important to declare that part of this data, related to the characterization of Blo t 12 and the development of an ELISA sandwich for allergen quantification, will be kept confidential due to our interest to patent the obtained product.. 10.
(11) Acknowledgements. I would like to thank to my supervisor Prof. Luis Caraballo for all his support and advice, also to Prof. Leonardo Puerta and Prof. Niradis Reyes for their supervision. To the other members of the staff: Dilia Mercado, Velky Ahumada and Silvia Jimenez for their collaboration on ELISA and ImmunoCAP assays. To all students who collaborated with experiments of recombinant protein expression: Ronald Regino, Carolina Manotas, Landy Luna and Carolina Mercado. To the members of the FRAAT cohort, especially: Nathalie Acevedo, Adriana Bornacelly and Jorge Sanchez. To all co-investigators from abroad: Prof. KY Chua who produced pBlo t 12.0102 and participated on manuscript writing. Dr. Martin Himly (University of Salzburg) who helped with all his expertise and equipment to the molecular characterization of Blo t 12, Dr. Enrique Fernandez-Caldas, who received me for 8 months in Allergy Innovations GmbH (Germany) and supervised all my work during this period. To Dr. Jan Hubert and colleagues, in Prague, who received me in his lab for one month and participated on the CR studies of Blo t 12. This PhD thesis was mainly funded by Colciencias (Project code 110748925155, Nº 384-2009), who also gave me a scholarship during my studies. Other institutions, University of Cartagena, Fundación para el desarrollo de la investigación Banco de la República, Fundemeb, also contributed with grants for these investigations.. 11.
(12) Chapter 1. General Introduction Allergy is a worldwide health problem, affecting about 25% of human population. For unknown reasons, it has increased during the last decades in several areas of the planet [1], reaching epidemic proportions. ISAAC studies have shown that in several areas of Latin America (Peru, Costa Rica, Brazil, Paraguay, Uruguay, and Panama) asthma prevalence is as high as described for UK, Australia, and New Zealand [2, 3]. In Colombia, the epidemiological surveys suggest that prevalence of atopic diseases has increased in the last decade. In 2010, disease rates were 12% for asthma and 32% for allergic rhinitis. Wheezing in childhood is another related problem, with a national prevalence of 25% in children younger than 5 years old [4]. Management of allergy is difficult; treatment is frequently inefficient, even in developed countries. The use of medicaments that only offer symptomatic relief is widespread. In contrast, administration of allergen specific immunotherapy (SIT) is less common, albeit being the only option able to modify the natural course of allergic diseases. Prophylaxis is not possible yet. The tropics, a wide area of the planet where two thirds of humans inhabit, have particular conditions that promote allergy development. Its climate, warm and humid, favors mite growth and diversity of house dust acarofauna, which includes potent allergenic sources such as Blomia tropicalis and Dermatophagoides pteronyssinus. Most of its countries are underdeveloped and helminth infections are endemic. The predominance of African ancestry may also promote stronger IgE responses [5]. In addition, socio-demographical transitions [6], especially an accelerated and unorganized urbanism, migrations and health service problems difficult disease management. Basic scientific research may contribute to ameliorate these problems and probably its impact on the tropics will be more relevant because the knowledge about its allergenic sources is still scarce. The characterization of local allergens would aid to develop better reagents for diagnosis and treatment and the identification of environmental risk factors for IgE sensitization will help to determine the most appropriate prophylaxis measures. The Institute for Immunological Research, in the University of Cartagena, has a long tradition in the study of the allergy, doing major contributions to the knowledge 12.
(13) about Blomia tropicalis, which together with Dermatophagoides pteronyssinus are the most important allergen sources in the tropics. This doctoral thesis aimed to understand more aspects about the great allergenic potential of B. tropicalis through the characterization of purified allergens and the evaluation of their clinical impact.. 1.. IgE responses and allergy Type I hypersensitivity reactions, also named allergy, are characterized by the. effect of specific IgE against molecules, commonly proteins from the environment, which, after antigen recognition elicit antibody- and cellular- mechanisms driving a distinct type of inflammation. A phase of sensitization occurs first; allergens are presented to naïve CD4+ T cells, which differentiate into allergen-specific Th2 cells. These lymphocytes orchestrate allergic inflammation, cooperating with B cells by promoting IgE class-switching and inducing proliferation of various cell populations that express FcRI, a high affinity receptor for the IgE (i.e. mast cells, eosinophils and basophils). Allergen exposition, in sensitized individuals, results in a rapid effector response, mediated by IgE antibodies, that after its recognition activates immediate reactions, such as cell degranulation and release of pro-inflammatory mediators (histamine, TNF- and others). IgE-mediated cell activation also triggers the synthesis of lipid mediators (i.e. prostaglandins and leukotrienes) and transcription of genes, among them, those coding for Th2 cytokines (IL-4, IL-5 and IL-13) that perpetuate allergic inflammation. IgE responses can be clinically irrelevant or, on the contrary, underlie different allergic conditions, such as asthma, rhinitis and eczema. About 25% of humans suffer from any allergy. Atopy is the genetic predisposition to become sensitized and produce IgE antibodies in response to ordinary exposure to allergens [7].. 1.1.. Allergens An allergen is any substance capable of inducing specific IgE production and. effector immune response mediated by these antibodies [8]. Allergens are a heterogeneous group of proteins that do not share any structural motif or a general. 13.
(14) biological mechanism related to allergenicity [9]. However, there are some allergens with intrinsic biological properties that promote IgE sensitization [10]. 1.1.1. Isoallergens Isoallergens is a term used to describe two related allergens with more than 67% of similarity in their sequence [6]. When only few numbers of variations are present, they could be also named as isoforms. Allergen polymorphisms could influence their allergenicity and their prevalence often varies among different environments [11, 12]. Therefore, identification of allergen variants should be followed by an evaluation of their IgE binding properties, especially, if they have a potential use as clinical reagents for allergy diagnosis or SIT. 1.1.2. House dust mite allergens Allergens derived from house dust mites (HDM) are the most important cause of IgE sensitization in the world, but especially in the tropics. Although HDM allergy is not a problem restricted to this geographical area [13], the rates of sensitization, as well as the intensity of the IgE responses, are greater than in other latitudes [14]. This may be related to the climatic conditions, which are favorable for mite growth, but other factors, such as genetic background of the population and the co-exposure to helminths should be considered [15, 16]. Indoor levels of mite allergens remain high during the whole year in contrast to other regions such as Mediterranean Europe where mite growth has maximum peaks in the beginnings of autumn and a sharp decrease during the winter period [17]. Species from the Dermatophagoides genus (D. pteronyssinus and D. farinae) has a wide distribution in the planet, including temperate and tropical climates. Moreover, there are geographically restricted species, such as B. tropicalis, a potent source of allergen in the tropics. 1.1.2.1.1. The genus Blomia Blomia belongs to the Echimyopodidae family. Three species have been identified in the house dust: B. tropicalis, B. kulagini and B. tjibodas. B. kulagini has been found in north-western Spain with an alpine climate and also in Egypt [18]; B. tjibodas has been reported in southern Chile and Germany [19], and it is an IgE 14.
(15) sensitizing source for German farmers [20]. Most research is focused on Blomia tropicalis because it is extensively dwelling in homes from tropical and subtropical regions. The fact that B. tjibodas IgE-reactive German farmers were also positive to B. tropicalis, even though there was not natural exposure to this species [21], suggest there is an important CR between this two closely related species. In the case of B. kulagini, the high degree of CR with B. tropicalis has been demonstrated experimentally [22]. 1.1.2.1.1.1.. Blomia tropicalis. Blomia tropicalis, previously recognized only as a storage mite, was first described by Van Bronswijk et al (1974) in house dust of tropical places [23]. In tropical countries, it habits in more than 90% of urban homes [24-26]. In subtropical regions, B. tropicalis is less frequent, about 30% of analyzed houses [27]. In Cartagena, Colombia D. pteronyssinus represents 37% of total mite population in the house dust, meanwhile Blomia tropicalis accounts for 40.1%. Although D. pteronyssinus is also a clinically relevant allergenic source, allergens derived from Blomia tropicalis are more specific of the tropical region. In several countries of Latin America [14, 28-31], Asia [32-34] and Africa [35] it has been reported that B. tropicalis is an important cause of allergic sensitization and a risk factor for asthma development. Since the first descriptions of its allergenic relevance, there has been a considerable advance in the isolation of its allergenic components, addressed by research groups applying advanced genomic and proteomic approaches. From one dimensional electrophoresis separation, there have been identified 25 IgE binding components with sera from Colombian patients; some of them are already produced as purified recombinant proteins and are officially accepted as allergens [36, 37], the rest are poorly characterized, but there are evidence of in vitro IgE binding and homology to known allergens from other sources (Table 1.1). Screening cDNA libraries by clone sequencing, Chew FT found 18 homologous proteins from the 21current known HDM groups and 16 potential new allergens with homology to others from a source different to mites, mainly panallergens [38].. 15.
(16) Table 1.1 Blomia tropicalis allergens Allergen MW (kDa) IgE binding Biochemical Activity Blo t 1. 25. 61-92%. Cystein Protease. Blo t 2. 14. 7%. Lipid binding protein. Blo t 3. 24-31. 4.7-51%. Trypsine. Blo t 4. 57. 7.5-62%. α-Amilase. Blo t 5. 14-17. 10-100%. Unknown. Blo t 6. 25. 11%. Chimotrypsine. Blo t 8. 26. 80.2%. Glutathione-S-transferase. Blo t 9. 30. ND. Serine protease. Blo t 10. 33-37. 10-29%. Tropomyosin. Blo t 11. 98-110. 10-86%. Paramyosin. Blo t 12. 14. 25-50%. Chitin binding protein. Blo t 13. 14-15. 13%-50%. Fatty acid binding protein. Blo t 14. 117. ND. Vitellogenin. Blo t 15. 62,5, 98, 105. ND. Chitinase. Blo t 18. 60. ND. Chitinase. Blo t 19. 7. 3%. Antimicrobial peptide. Blo t 20. ND. ND. Arginin kinase. Blo t 21. 13.2. 57.9%. Unknown. *ND: Not described.. 1.1.1.2.1.1.1. Cross-reactivity with other allergen sources The IgE CR between B. tropicalis and other HDMs is variable among the species and although usually decreases as the distance in their phylogenetically relationship rises; it also depends on the pattern of exposition of those individuals whose sera are used for inhibition studies (Table 1.2). As mentioned, CR within allergenic species from Blomia genus is almost complete [22]. CR studies with other closely related mite species, members of the Glycyphagoidea super-family, has only been published in regard to L. destructor [39, 40], an important allergenic storage mite. Puerta et al., using serum pool from Colombian patients, found 82% of inhibition to L. destructor extract by B. tropicalis [39]. Johansson et al. detected that in the sera of L. destructor sensitized Swedish barners, L. destructor inhibited the IgE binding to 10 bands of the B. tropicalis extract [40]. Likewise, when inhibition studies with serum from Brazilian allergic patients were performed, B. tropicalis only inhibited IgE binding to 4 bands from L. 16.
(17) destructor extract. Suidasia menadensis is another mite found in house dust from the tropics, although in lower levels and frequency than B. tropicalis and D. pteronyssinus [41]. It has been reported an important degree of CR between B. tropicalis and this mite; B. tropicalis inhibited IgE binding to S. menadensis in solid phase (87.6%). Inversely, S. menadensis inhibited only 32% of IgE reactivity to B. tropicalis. This pattern of inhibition indicates that the main IgE antibodies are directed against B. tropicalis (primary sensitizer) and it is an illustrative situation when the detection of a high CR is dependent on the predominance in exposition to one antigen source. CR between D. pteronyssinus and B. tropicalis is low to moderate [42]. At the level of purified allergens, there are some highly cross-reactive groups, such as tropomyosins, whose protein sequences are also conserved in other mites and invertebrates, including helminths; others with a low-moderate CR [43] and speciesspecific allergens. Most house dust mite allergen groups have been organized around Dermatophagoides spp. allergens. The identification of homologous in B. tropicalis is more recent in the timeline and their CR characterization should continue for a better evaluation of this phenomenon. Table 1.2 Cross-reactivity of B. tropicalis with other mites Source. Percent of IgE inhibition by B. tropicalis. Reference. Blomia kulagini. 100. Cardona et al. [22]. Suidasia menadensis. 87.2. Puerta el al. [41]. Lepidoglyphus destructor. 83. Johansson et al [40]. Dermatophagoides pteronyssinus. 40. Chew et al.. Blomia tropicalis also share allergenic epitopes with Ascaris spp. Analysis of this CR by Acevedo et al. showed that Blomia tropicalis and D. pteronyssinus inhibited 83.3% and 79% of IgE- binding to Ascaris, while Ascaris inhibited 58.3% and 79.3% to B. tropicalis and D. pteronyssinus, respectively. Tropomyosin [44] and Glutathione-S17.
(18) Transferase (GST) were identified as IgE cross-reactive groups. In addition to its potential impact on asthma pathogenesis, Ascaris infection and mite allergy diagnosis relying on the determination of specific IgE could be affected by this CR [16, 45]. 1.1.1.2.1.1.2. Species-specific allergens Various B. tropicalis allergens have been proposed to be species-specific. According to Kuo et al results, Blo t 5 and Der p 5 are not cross-reactive molecules [46]; however, Caraballo et al found that IgE binding to Der p 5 can be inhibited by BtM, an allergenic carboxy-terminal fragment of Blo t 5 [43]. Cheong et al cloned Blo t 1, a cystein protease with 34% of sequence similarity to Der p 1. Poor correlation between the specific IgE levels to these allergens was the only clue about their lack of CR [47]. The allergen Blo t 12 is another potential specific-marker of B. tropicalis. No homologous proteins have been described in the genus Dermatophagoides, other important allergen source in tropical countries, suggesting that it is a potential speciesspecific allergen; hence, it may be very useful in component-resolved diagnosis to identify B. tropicalis sensitization. 1.1.1.2.1.1.2.1. Blo t 12 Blo t 12 (Blo t 12.0101) was first identified by IgE immunoscreening in a Blomia tropicalis cDNA library constructed from mites collected in Cartagena [48], showing an IgE binding frequency of 50% when was tested in 32 individual sera by plaque assay. The analysis of its primary sequence revealed that this allergen has some degree of similarity to some chitin binding proteins. It contains a 90 amino acid domain, with key residues that confers the ability to bind this carbohydrate; however, this biological activity has not been demonstrated experimentally.. 1.2.. Adjuvants. 1.2.1. Chitin Important allergens sources such as mites, fungi and parasites contain chitin, the second most abundant biopolymer in nature. This carbohydrate seems to modulate immune response in mammals, especially, those of allergic type [49-52]. The first 18.
(19) finding about a promoting effect of chitin in allergic responses was published by Reese et al, who demonstrated that its nasal administration induce an inflammatory response in mice, characterized by basophil and eosinophil infiltration, a hallmark of allergic responses [53]. This effect, which was mediated by LTB4 released from activated macrophages, was not observed when using transgenic mice over expressing functional chitinases. Other interesting publications have found important results about chitin [4951]. Intermediate size particles are highly immunogenic and pro-inflammatory, when they are administered with OVA; it is a potent adjuvant of allergic responses, similar to alum [51]. However, it also induced concomitantly other type of immune responses (Th1 and Th17), thus, it is considered a multifaceted adjuvant. In this regard, neutrophil infiltration in the lungs is also predominant when chitin is administered [50]. In other animal models, small chitin particles (<10 µm) has been found to promote Th1 response development against the sensitizing allergen [54, 55].. 1.3. Risk factors for allergy and asthma The causes of asthma and other allergic diseases remain unknown. Genetic and. epidemiological studies suggest that for these multifactorial diseases the expression of different phenotypes depend on complex interactions between susceptibility genes and the environment [56]. This is reflected in the wide differences in prevalence and natural history of allergic diseases around the world [57]. 1.3.1 Genetics Asthma, allergic inflammation and IgE responses are inherited conditions, with unique and shared genetic determinants. More than 1.000 studies about the relationship of genetic variants and allergy susceptibility have been published [58]; however, disease prediction or clinical classification, based on the identification of individual genetic variants or combinations, is not possible yet. In spite that atopic phenotypes run in families, there are not known genetic variations that contribute substantially to their heritability. Several approaches (candidate genes [59], positional cloning [60, 61], genome wide associations [62, 63]) have been conducted to identify genetic risk factors for these conditions. Most susceptibility variants can be classified into these functional categories: epithelial barrier function [64], environmental sensing and signaling [65] 19.
(20) [66], Th2 responses and tissue response (repair, oxidative stress[67]). As in other complex diseases, few genetic associations with asthma/allergy have been replicated in several populations [68]. During the last years it has been a matter of great interest the epigenetic mechanisms determining asthma phenotypes and supporting the relationships between genomes and environments in this disease [69]. 1.3.2. Environment It is well known that environmental exposition to several factors influence allergy and asthma development [70]. Some risk factors seem to be universal (allergen sensitization, tobacco exposure [71, 72], air pollution [73-75]), it means, that its association with disease presentation or worsening is commonly replicated in different studies. For others, their effects on asthma and allergy are not clear (viral infections [76], helminthiasis [77-79]). Interestingly, some protective factors detected in developed countries, such as poor hygienic conditions, do not confer protection in deprived and overcrowded communities, where a high prevalence of asthma and early infections concur [6, 80, 81]. 1.3.2.1.. Helminth infections. Immune response against helminths share many features with that elicited by allergens in atopic subjects [82]. A Th2-polarized response, with high levels of total and specific IgE to nematode antigens, is induced in most of the exposed individuals. However, parasites also contain products with immunosuppressive properties [83]. The balance among these the two mentioned types of responses depends on several factors (nematode species, intensity of the infestation, host genetic background). Mild infections seem to promote allergic manifestations [78], in contrast to heavy infestation that reduce atopy presentation and of other related traits [79] [84]. Some helminths antigens cross-reacts with HDM allergens [44], confounding allergy diagnosis in infected populations. In the tropics, Ascaris sensitization is high and more frequent in atopic individuals. Due to the CR, it is unknown how many cases of sensitization truly correspond to HDM or nematode antigens; moreover, the biological relevance of this phenomenon on the inception of allergy in the tropics is not completely understood [85]. Birth cohort studies, exploring HDM and Ascaris sensitization with species20.
(21) specific and cross-reactive components, from early age, contribute enormously to solve these interrogants.. 1.4.. Allergy Diagnosis. Diagnosis of allergy is based on the clinical evaluation by a physician, and then, corroborated by in vivo or in vitro tests that determine IgE sensitization. Skin prick test is the most common and reliable diagnostic tool used by the allergist, but also, in vitro specific IgE determination is frequently used and under special clinical conditions (skin diseases, uncooperative patients, patients with high risk of anaphylaxis upon allergen exposure) is the first-line diagnostic option. Most currently used methods for IgE serology are based on the same biochemical principle: immobilization of the allergen in a solid phase, which is incubated with the serum or plasma sample, and then, detection by anti-human IgE coupled to an enzyme that permits signal generation and readout (i.e. by spectrophotometry, fluorometry or chemiluminiscence). Organ challenges are mostly used to define food and drug hypersensitivity [86]. Ex vivo tests, such as basophil activation assays [87], are also available, but it is more common its application on allergy research. Optimization of these procedures is an ongoing task, since adverse effects with in vivo testing can be avoided, especially in those patients with high risk of anaphylaxis. 1.4.1. Component resolved diagnosis IgE sensitization has been usually explored with natural extracts, a complex mixture of proteins from the allergen source that contain allergenic and non-allergenic molecules. Standardization of natural extracts, to ensure a consistent composition of batches, has been always problematic; concentration of allergens is variable and affected by different factors [88]. Some allergens are highly susceptible to degradation or not easily extracted, occurring false negatives when the sensitizing allergen is not represented in the complete extract. When extracts are used for diagnosis, the cause of poli-sensitization to related-sources (co-sensitization or CR) cannot be ascertained in all cases.. With the molecular cloning of many allergen genes and its production as. recombinant proteins [89], it is possible to further refine diagnosis at the component level (Component resolved diagnosis, CRD). CRD allows a more precise definition of 21.
(22) IgE sensitization [90] and, thus, a better selection of those molecules for SIT to which a patient is actually sensitized. Advantages of this strategy have been widely discussed in several reviews [91]. Component-resolved diagnostic tests include species-specific marker allergens to diagnose the genuine sensitization to a given source and also crossreactive molecules. Purified allergens can be natural or recombinant molecules. 1.4.2. Evaluation of recombinant allergens for diagnostic purposes Production of allergens as recombinant proteins has been very useful for allergy research and clinics. It allows obtaining pure molecules in substantial quantities, a difficult task to achieve from natural sources. Cloning of allergens lets primary sequence identification and its classification into homology-based groups [38]. Molecular characterization is essential, especially if the recombinant allergen is intended for clinical use. Its resemblance to the natural counterpart must be assessed from the physicochemical, structural, and biological point of view. Immunological characterization is mandatory and it goes beyond IgE serology studies to know about its epidemiological relevance in a given population. CR with other allergens must be evaluated; it gives useful information for considering its inclusion in allergen batteries for CRD due to its high impact on clinical decisions for immunotherapy and allergen avoidance [92]. Its biological activity to induce IgE-mediated cell degranulation should be confirmed in vivo (skin prick tests) or ex vivo (basophil activation or histamine release assays). Epitope mapping provides also very valuable data [93]; it is expected that allergy diagnosis can be further refined to the epitope level, and in turn, the specificity of IT. On the other hand, identification of antigenic sites might be applied to create hypoallergenic engineered molecules for immunotherapy. Physico-chemical properties of the recombinant protein are also evaluated [94] (post-translational modifications, aggregation behavior and stability) due to its influence on the quality as pharmaceutical product.. 1.5. Treatment Allergies are difficult-to-treat conditions, with a limited number of therapeutic options, mostly offering symptomatic relief (corticosteroids, B2 agonists, anti-leukotrienes). SIT, introduced in 1901 by Noon, is still the only treatment capable to modify the natural 22.
(23) history of atopic diseases. Mechanisms of action are partially understood, but include the induction of allergen-specific IgG4 and regulatory T cells [95, 96]. Although it has been demonstrated its effectiveness as a treatment for allergic rhinitis, asthma [97] and atopic dermatitis [98], safety and efficacy of SIT can be improved. SIT is usually performed with natural extracts. Since more allergens, than those required for desensitization, are administered, novel sensitizations can be induced [99, 100]. The allergenic content of extracts is difficult to standardize, especially because each patient can be sensitized to different allergen components. CRD and tailored immunotherapy aims for a more specific treatment, it means, administering only the precise components the patient needs to. With its production as a recombinant allergen, the difficultness to obtain purified allergens from the natural source is overcome. Currently, there is one recombinant allergen (Bet v 1) available for sublingual SIT, show good results. However, other options for treatment are genetically engineered allergen vaccines (hypo-allergens, hybrid or fusion proteins) where allergen sequence is modified in order to increase safety and/or efficacy of vaccination. Some of these molecules are under clinical trial evaluation [101].. 23.
(24) Hypothesis Characterization of purified allergens from B. tropicalis, including speciesspecific and cross-reactive molecules, improves the understanding of IgE sensitization and other allergy-related phenotypes in the tropics.. 24.
(25) Thesis aims To overall aim of the current doctoral thesis was to gain a further insight into various aspects related to Blomia tropicalis allergenicity – of current interest in Allergology research – through the production of its allergens as recombinant molecules and their immunological and biological characterization. In Chapter 3: Immunological and biological characterization of group 12 allergens from Blomia tropicalis the allergen Blo t 12 was characterized at the immunological and biological level. Aspects such as IgE reactivity, isoform diversity, usefulness as a species-specific marker of B. tropicalis sensitization and the biological impact of its chitin-binding activity on allergenicity were evaluated. One manuscript [36] has already been published from these results and another is in preparation. In Chapter 4: Identification of novel Blomia tropicalis allergens the aim was to isolate new allergens from B. tropicalis, obtained by PCR screening of a B. tropicalis cDNA library, and to describe their frequency of IgE sensitization in our population. Part of this data were presented in the most important international meetings on Allergy research (AAAAI 2010 and EAACI 2010 annual congresses) and were published in indexed journals in the form of abstracts. In Chapter 5: Understanding the early immune response to B. tropicalis allergens and its clinical impact in children from the tropics, in a birth cohort from children born in Cartagena, a tropical city in Colombia, presentation of atopy-related phenotypes (wheezing and eczema) and the evolution of IgE responses were evaluated during the first three years of life. IgE determination to the HDM species, B. tropicalis and D. pteronyssinus, as well as to the nematode Ascaris spp. was performed to have an overall understanding of the dynamics of sensitization in early infancy. Moreover, sensitization to B. tropicalis purified allergens and to other from Ascaris spp. was evaluated to precise some aspects and interrelationships between these sources that can only be ascertained by using individual allergen components. One original publication [102], a submitted manuscript and a draft in preparation were derived from these results.. 25.
(26) Chapter 2.. Material and methods. 2.1. Subjects Serum and other biological samples that were used for evaluation of human immune responses to B. tropicalis allergens and other atopy-related traits (i.e. asthma, wheezing) were obtained from allergic patients or healthy subjects, belonging to any of the following epidemiological research programs of our Institution, all of them approved by Ethics Committees: Candidate genes for asthma and atopy: The epidemiological relevance of B. tropicalis purified allergens as IgE sensitizers was evaluated in B. tropicalis allergic/asthmatic patients, belonging to a larger database of subjects recruited in an asthma case-control study (Grant numbers 331-2004 and 0932007, funded by Colciencias), approved by the University of Cartagena Ethic Committee. Asthma was defined according to the Global Initiative for Asthma (GINA) criteria, using a standardized questionnaire tested previously in patients with a history of physician-diagnosed asthma [4]. The diagnosis was confirmed by a physician belonging to the research staff, sustained on a clear clinical history with clinical symptoms. Sensitization to B. tropicalis was confirmed by ELISA, as described previously [103]. FRAAT (Factores de Riesgo para Asma y Atopia en el Trópico) cohort: A birth cohort of 326 children from Cartagena, Colombia was recruited between 2007 and 2008 [104]. We created a community based birth cohort for a prospective follow up and collection of epidemiological data and biological samples. The majority of study participants belonged to the poorest communes and shared environmental conditions. The Ethic Committee of the “Fundación Santa Fe de Bogotá”, Bogotá-Colombia, approved this study (CCEI-282-206). We explored at different time-points (between 0 and 42 months) during child life the evolution of IgE responses to B. tropicalis and other allergenic sources and its relationship with atopic-related phenotypes. Demographic details of this cohort were fully described in the publication #2 of this doctoral thesis [104]. The program was funded by Colciencias (Grant 325-2006). 26.
(27) Influence of Ascaris infection and/or sensitization on asthma severity (The ASA cohort): It is a well-characterized cohort of asthmatic patients (n=300) from Cartagena, Colombia. Asthma was defined according to the GINA criteria, using a standardized questionnaire tested previously in patients with a history of physician-diagnosed asthma. The diagnosis was confirmed by a physician belonging to the research staff, sustained on a clear clinical history with clinical symptoms as described previously. Patients also were evaluated by a complete clinical protocol that included: espirometry, skin prick tests and IgE serology using ImmunoCap and ELISA. Funded by Colciencias, Grant 602-2009 and approved by the University of Cartagena Ethic Committee.. 2.2. Allergen obtention 2.2.1. Allergenic Extracts Blomia tropicalis and Dermatophagoides pteronyssinus mite extracts were prepared as described here. Lyophilized mites were resuspended 1:20 in PBS pH 7.4 and incubated ON at 4 °C with continuous stirring. After centrifugation for 30 min at 6.000 r.p.m., the supernatant was filtered through 0.8, 0.45 and 0.2 m filters. Extracts were dialyzed against water in a dialysis tube with a 3.4 kDa pore and then lyophilized and stored. Protein concentration was determined by Bradford method. Other extracts prepared from arthropod species of agricultural interest were kindly supplied by Dr. KrizkovaKudlikova and Dr. J. Hubert [105] (Crop Research Institute; Praga, Czhec Republic).. 2.2.2. Blo t 12 allergen group 2.2.2.1.. The cDNA coding for Blo t 12 isoallergens. The cDNA coding for Blo t 12.0101 was isolated by IgE immunoscreening from a B. tropicalis cDNA library constructed with mites collected in Cartagena, Colombia, as described by Puerta et al [5]. Blo t 12.0102 was isolated from a cDNA library 27.
(28) constructed from mites collected in Singapore, and was kindly gift by Dr. YK Chua (University of Singapore, Singapore). 2.2.2.1.1.. Allergen expression in Pichia pastoris. 2.2.2.1.1.1.. Cloning and expression. Subcloning of Blo t 12.0101 into pPIC9 vector for its expression in Pichia pastoris was accomplished by Dr. Puerta as fully described in the publication #1 of this thesis [36]. The recombinant pBlo t 12.0102 was also inserted in this same vector by Dr. Chua´s research group in Singapore.. For protein expression, transformants were. selected by the slow growing phenotype (Mut -) on the minimum methanol (MM) plates. In order to identify the high expression clones, an individual colony was inoculated in 50 ml of buffered glycerol-complex medium (BMGY, 1% yeast extract, 2% peptone, 1.34% yeast nitrogen base with ammonium sulfate, 1% glycerol, 0.4 mg/l biotin, and 0.1 M potassium phosphate, pH 6.0) and grown at 30º C in a rotary-shaking incubator at 250 rpm. The cells were harvested by centrifuging at 1500 g for 5 min at room temperature when the OD600 nm reached 2.0 - 6.0. The cell pellet was resuspended in 10ml of buffered methanol-complex medium (BMMY, replacing the glycerol in BMGY with 0.5% methanol) for induction of the recombinant expression. The recombinant protein Blo t 12 was harvested after 24 hours of induction. It was secreted into the medium. Protein purification was done by anion-exchange chromatography.. 2.2.2.1.2.. Production in E. coli expression system and purification. A commercial service for synthesis and subcloning of Blo t 12.0101 and Blo t 12.0102 codon-optimized sequences – into two different vectors: pET32a+ (as a his tagged-thioredoxin fusion protein) or pET45b+ (as his-tagged protein) – was ordered to Genscript (Piscataway, USA). Plasmids were transformed into Origami (DE3) cells by electroporation. Competent cells were prepared by following the manual instructions. The plasmid (5 ng) was incubated on ice with competent cells for one minute. Then, the plasmid-cell reaction was added to an electroporation cell and received an electric pulse. 28.
(29) Rapidly, one milliliter of SOC medium was added to the cell, transferred to a 14 mL non-conical Falcon™ tube and incubated for one hour at 37° C. The transformation reaction was then plated onto LB agar plates, supplemented with ampicillin (100 µg/mL) as selective antibiotic, and incubated ON at 37° C. Next day, individual colonies were picked and grown in LBA medium (10 mL) ON at the same temperature. For induction of protein expression, the overnight culture was first diluted 1:20 in LBA and incubated at 37°C until reaching mid-log phase (OD600 0.5), which usually lasted 34 hours. At this point, five milliliters of the culture was transferred to a new tube (noninduced control) and to the rest of culture it was added IPTG at 1 mM final concentration. Induction was done for 5 hours at 37°C. Protein expression was evaluated by 5-15% discontinuous SDS-PAGE under reducing conditions. Five hundred microliters of non-induced and induced cultures were centrifuged at maximum speed for 1 minute, supernatants were decanted and pellets resuspended in 80 μL of Laemmli buffer, heated at 95°C and loaded (10 μL) onto the polyacrylamide gel. A successful protein expression experiment is generally observed as a protein band present in the induced-, but not in the non-induced- culture The his-tagged fusion proteins were purified from the E. coli lysate in native conditions. Briefly, the induced culture was resuspended in native binding buffer (NBB) pH 8.0 (500 mM NaCl 50 mM NaH2PO4, pH 8.0) and incubated with lysozyme (1 mg/mL) for 30 min on ice, and then sonicated 6 times. The lysate was incubated with a Ni-NTA resin for one hour, washed with 20 mM imidazole - NBB, and eluted with 250 mM imidazole in NBB buffer. 2.2.2.2.. Natural Blo t 12. Two different affinity columns were prepared to purify natural Blo t 12; one with polyclonal (pAb) serum from a pBlo t 12.0101 immunized rabbit and the other with a mixture of two anti-Blo t 12 monoclonal antibodies (mAbs, 3B11 and 1A6). The pAb serum (5 mL) was incubated with 1 mL of Protein A-Sepharose 4B Fast Flow beads for one hour at RT in an orbital shaker. In the case of the mAb affinity column, one milligram of each antibody was incubated with 1 mL of Protein A-Sepharose 4B Fast Flow. The following steps were similar for both columns. After centrifugation and 29.
(30) supernatant recovery, beads were washed with PBS pH 7.5 and then twice with 0.2 M sodium borate pH 9.0. To covalently couple antibodies to the matrix, fifty two milligrams of dimethyl pimelimidate dyhidrochloride (20 mM final concentration) were added to the beads and incubated for 30 minutes at RT. Later, the resin was precipitated by centrifugation and washed with ethanolamine 0.2 M pH 8.0 twice and then incubated for 2 hours with this same buffer to stop the coupling reaction. Finally, beads were washed in PBS. For nBlo t 12 purification the affinity column was prewashed with glycine 100 mM pH 3.0 to remove non-covalent bound antibodies to protein A-beads. B. tropicalis extract was added to the column and incubated on ice for 2 hours in an orbital shaker. After recovery of flow throw, the resin was washed 6 times with PBS pH 7.5. Elution of antigens from the resin was done with 4 mL 100 mM glycine HCl pH 2.5, collected in 1 mL fractions, using tubes with 400 uL Tris 1 M pH 8.0 to neutralize the pH. The eluted fractions were dialyzed against water and lyophilized for protein concentration.. 2.2.3. Gluthathione S transferase from B. tropicalis (Blo t 8) and other sources 2.2.3.1.. Cloning, expression and purification of recombinant Blo t 8. Blo t 8 coding gene was amplified from a cDNA library of B. tropicalis constructed from local mites isolated in urban homes from Cartagena, Colombia. For amplification, primers 5’CACC- ATG GCA CCA TTG AAG ATT G 3’ (forward) and 5’ TTA TTC TTT GGC CCA ACG ATG G 3’ (reverse) were designed according to a reported nucleotide B. tropicalis GST sequence (gi37958148). This fragment was amplified using Taq polymerase and purified with Qiaquick PCR purification kit. For cloning the amplified fragment into pET100 vector it was necessary to produce blunt ended amplicons. Thus, 45 ng of the amplified DNA were polished in a 10 uL reaction containing 2.5 U of Pfu polymerase and 1 mM dNTPs in an incubation step of 30 minutes at 72°C. Nucleotide sequences of cloned fragments were analyzed (Qiagen Genomic Services, Germany) from two different plasmids. For expression, Blo t 8/pET100 plasmid was transformed into BL21 (DE3) Competent Cells following the 30.
(31) protocol described in the manual. For protein expression, an overnight culture the clone was diluted 1:20 and after reaching mid-log phase (OD600: 0.5), IPTG was added to a final concentration of 1 mM. The his-tagged Blo t 8 was purified from the E. coli lysate under native conditions, as previously described for Blo t 12 recombinants. 2.2.3.2.. Natural glutathione-S transferase. Natural glutathione-S transferase from B. tropicalis was purified by affinity chromatography using Glutathione Sepharose 4B. Four milligrams of the protein extract were incubated with 1 mL glutathione beads for 90 minutes in a rotor. After centrifugation at 500 g for 5 minutes, the flow throw was collected, and beads were washes four times with PBS. After decanting the final wash, the resin was incubated for 10 minutes with 50 mM Tris pH 8.0, 10 mM reduced glutathione at room temperature. The beads were precipitated by centrifugation, and 1 mL eluate was harvested each time. Three more elution steps were done.. 2.2.4. Blo t 5 Blo t 5 coding gene was amplified from a cDNA library of B. tropicalis constructed from local mites isolated in urban homes from Cartagena, Colombia. For the amplification of its coding region, primers 5’CAC CAT GAA GTT CGC CAT CGT TC (forward) and 5’ CCT TAT TGG GTT TGA ATA TCC TTC ACT 3’ (reverse) were designed according to the Blo t 5 nucleotide sequence (gi4204916), previously reported by Arruda K et al. The amplification reaction was prepared as described in Table 2.1. Table 2.1 Polymerase chain reaction for amplification of Blo t 5 Reagent. [ ] stock Vol.. dH2O. 13.2. Enzyme buffer. 10X. 2.5. DNTPs. 10 mM. 0.8. Primer F*. 25 pm/uL. 3.0. Primer R*. 25 pm/uL. 3.0. Pfu polymerase. 0.5. DNA (cDNA library). 2. Total (uL). 23.0 uL. 31.
(32) After verifying the amplification of the expected fragment by electrophoresis in 1% agarose gel. Amplification reaction was cleaned using the QuiaQuick PCR purification kit and then, cloned into a pET100 vector as described above for Blo t 8. The protocol for protein expression was similar to those used above. The protein was purified from the bacterial lysate by Ni-NTA affinity chromatography under natural conditions.. 2.2.5. Ubiquitin from B. tropicalis The cDNA gene coding for ubiquitin was isolated by PCR using specificprimers, whose design was based on a B. tropicalis EST entry, with homology to the ubiquitin family. The amplification reaction was purified with QuiaQuick PCR purification kit and cloned into the pET100 vector following the guidelines recommended in the manual. Three microliters of the cloning reaction were used for transformation of Competent TOP 10’ Cells. Plates were incubated ON at 37°C. At the next day, it was observed a good number of colonies in each plate (around 50-70 colonies). Seven of these colonies were picked up and analyzed by PCR. Two clones with different DNA fragment sizes were sequenced for identification of the correct insert. There was found that the clone with the expected sequence coded for two copies of ubiquitin (poli-ubiquitin), as normally occurs in eukaryotes. Since E. coli does not have enzymes to break the polyprotein into monomers; based on the obtained poliubiquitin sequence, it was ordered the synthesis of a sequence with just one copy of ubiquitin (Genscript, USA) and its subcloning into pET45b+ vector. Both plasmids were transformed onto BL21 (DE3) chemically competent cells for protein expression. The protocol for protein expression was similar to that described above for other allergens. The protein was purified from the bacterial lysate by Ni-NTA affinity chromatography under natural conditions.. 2.2.6. Other recombinant allergens Asc s 1 (ABA-1) and Asc l 3 were produced in our laboratory as previously described [44, 106]. Der p 2 and Der p 8 gene synthesis and subcloning into pET45b+ 32.
(33) were ordered to Genscript™ (Piscataway, USA). Transformation into Origami (DE3) cells was done by electroporation. A GST-sigma like sequence from Ascaris suum was also synthesized and subcloned into pQE30 by Genscript™. The plasmid was transformed onto M15 competent cells by electroporation in our laboratories. Protein expression protocol was similar to that described for other allergens before. All allergens were soluble products, except Der p 2, that required denaturation with urea 8M before protein purification by the conventional Ni-NTA purification protocol. However, it could be eluted under native conditions.. 2.3. Obtention of other biological samples 2.3.1. Polyclonal antibodies Production of anti-Blo t 12 polyclonal antibodies (pAbs) was ordered to Vivotecnia (Madrid, Spain). Two New Zealand rabbits were immunized with pBlo t 12.0101 in a 2-week interval. Immunization success was monitored by ELISA. The final bleeding from each was used for allergen characterization experiments. 2.3.1.1.. IgG purification. For some downstream applications IgG was purified from the complete serum using protein A-Sepharose. For 2 mL of serum it was used 1 mL of the resin. Antibodies were eluted with 0.1 M Glycine HCl pH 2.5 and dialyzed against PBS overnight. IgG reactivity was tested by ELISA, before and after purification.. 2.3.2. Monoclonal antibodies Monoclonal antibodies were produced by Dr. Martin Himly in the Christian Doppler laboratory for allergy research (University of Salzburg, Salzburg, Austria). Two mice were immunized with alum-adsorbed deglycosylated pBlo t 12.0101 in a 2-week interval. After hibridoma fusion, cells were grown for 9-10 days in selection medium (37°C, 7% CO2), and the supernatant from different wells were tested for antibody reactivity to Blo t 12 using ELISA. Single clones were obtained by a limiting dilution protocol. Subtype classification (IgG1, IgG2a, IgG2b and IgG3) was done by ELISA. 33.
(34) with specific anti-mouse IgG antibodies. All the obtained mAbs were from the IgG1 subtype. 2.3.2.1.. IgG Purification. Monoclonal antibodies were precipitated with (NH4)2 SO4, and purified using a protein G column. The cells were harvested by centrifugation at 3000 g for 15 min at 4°C. The supernatant was transferred into Erlenmeyer flasks and neutralized using a 1 M TrisHCl pH 8.0 until the medium color turned pink. The mAb was precipitated in a final concentration of 50% saturated (NH4)2 SO4 at 0°C. After (NH4)2 SO4 was grinded and added bit by bit every minute into the stirring Erlenmeyer flask, the suspension was centrifuged at 15,000 g for 20 min at 4°C. The pellet was resuspended in 50% saturated (NH4)2 SO4 and centrifuged again at 15,000 g for 20 min at 4°C. This step was repeated once. The obtained pellet was dissolved in PBS pH 7.4 about 1/10 of initial volume. For further purification, a 2 ml protein G column was used. The column was washed with 30 mL PBS pH 7.4. After the antibody was loaded on the column, the flow through was stored at 4°C until further analysis and the matrix was washed again with 30 mL PBS pH 7.4. Elution was performed with 5 ml of 50 mM glycine pH 2.5 in a reaction tube filled with 700 µl 1 M Tris HCl pH 8 to neutralize the solution. The column was cleaned with PBS pH 7.4 and stored at 4°C in PBS pH 7.4 and 0.05 % NaN 3 to avoid contamination. Antibodies were dialyzed 3 times against PBS pH7.4 (MWCO: 6-8. kDa) and analyzed with UV detection at 280 nm and SDS-PAGE.. 2.4. Physico-chemical characterization of proteins 2.4.1. SDS-PAGE Proteins were separated by SDS-PAGE, mostly under reducing conditions. Discontinuous polyacrylamide gels (5-15%) were prepared according to the MiniPROTEAN® Tetra Cell instruction manual (Bio-Rad). For reducing conditions, samples were treated as follows: Laemmli buffer (with β-mercaptoethanol) was prepared 2X and added in 1:1 proportion, heated at 95°C for 5 minutes, centrifuged by 34.
(35) 15 seconds and loaded immediately onto the gel wells. SDS-PAGE was run at 200 VDC until the front dye reached the lower border of the gel (by approximately 45 min). When gels were stained with Coomasie blue, they were incubated for 30 min in a horizontal shaker with this solution, and then in Destain solution (1:4:5; acid acetic, methanol, water) for 2 hours or ON. Silver staining was especially used to visualize few amounts of loaded samples; it was performed according to the instructions of the kit.. 2.4.2. Two dimensional electrophoresis Proteins of B. tropicalis extract were precipitated using the ReadyPrep 2-D Cleanup kit (Bio-Rad, Calif., USA). The pellet was reconstituted in rehydration buffer (8 M urea, 4% CHAPS, 0.0002% bromophenol blue, 50 mM DTT, 0.2 BioLyte Carrier ampholytes, pH 3-10) by shaking at room temperature for 2 hours. Isoelectric focusing was performed using a 7 cm long immobilized gradient (from pH 3 to 10) strip (3-10 NL ReadyStrip™ IPG Strip, BioRad, Calif., USA). One-hundred and thirty micrograms of B. tropicalis extract were used for strip rehydration. Strips were then equilibrated in 2 buffers containing 6M urea 0.375 M tris pH8.8, 2% SDS with 2% DTT or 2.5% iodoacetamide, respectively. Isoelectric focusing was performed at 50mA/strip, 20 ºC as follows: step 1: 250 V for 250 V/hr, step 2: 4000 V for 2 hr and step 3: 4000 volts for 10.000 V/hr. Second dimension separation was done in 15% acrylamide gels. Two replicas of the separation were done, one for gel staining and another for PVDF electro transference and further western blot.. 2.4.3. Glycosylation detection PVDF-electrotransferred proteins were incubated in the dark for 20 minutes in a solution of 10 mM sodium metaperiodate dissolved in 100 mM acetate buffer, pH 5.5. The membrane was rinsed twice in PBS and washed three times for 10 minutes with PBS. Then, it was incubated for 60 minutes at RT with 0.125 mM biotin hydrazide (diluted 1:5000 in 100 mM acetate buffer pH 5.5). After washing, the membrane was blocked with 5% milk in PBS for 60 minutes. Then, three washes were done and streptavidine-horseradish peroxidase (1:5000 diluted in PBS) was added and incubated for 30 minutes.. After washing again 3 times, membranes are exposed to ECL™. chemiluminiscence reagents. Images were obtained in a CCD camera. 35.
(36) 2.4.4. Deglycosylation procedures 2.4.4.1.. Metaperiodate oxidation. PVDF-electrotransferred proteins were incubated in the dark for 20 minutes in a solution of 10 mM sodium metaperiodate dissolved in 100 mM acetate buffer, pH 5.5. The membrane was rinsed twice in PBS and washed three times for 10 minutes with PBS. After this treatment, Western blot protocol is performed as fully described below. 2.4.4.2.. PNGase F treatment. pBlo t 12.0101 was treated with PNGase F under native and denaturing conditions. For native conditions, 4 µg of the allergen was diluted in reaction buffer (50 mM sodium phosphate buffer containing 1% NP-40) and incubated with 2000 U of PNGase F for 3 h at 37°C. For denaturing conditions, the allergen was first heated for 10 minutes at 100°C with 0.5% SDS and 1% β-mercaptoethanol prior to addition of reaction buffer and PNGase F at 37°C. 2.4.4.3.. Chemical method with trifluorometasulphonic acid (TFMS). Pre-cooled 10% anisole in TFMS solution (100 uL) was added to 0.3 mg of lyophilized pBlo t 12.0101 or 1 mg of RNAse B (Glycoprotein standard as control). Protein samples were gently shaken for 3-5 minutes until dissolved and incubated for 3 hours at RT. In a methanol-dry ice bath, 60% Pyridine Solution and TFMS-treated samples were pre-cooled. Immediately after adding a pH indicator solution (0.2% Bromophenol Blue), inside the ice bath, the pre-cooled 60% Pyridine Solution was added, dropwise, to sample reaction vials until their color turned to blue, taking care to mix and cooling the reaction vial between drops. For chemical removal, proteins were purified in NAP-5 columns with a Sephadex G-25 resin.. 2.4.5. SECTDA High-performance size-exclusion chromatography (HPSEC) was performed using a 7.8 · 300 mm TSKgel-G2000SWXL column (Tosoh-Bioscience, Stuttgart, Germany) on a HP1100 system (Hewlett-Packard) equipped with a built-in UV detector 36.
(37) and online coupled with a right-angle light scattering, refractive index and viscosity detector array (TDA302; Viscotek, Houston, TX, USA). Samples were analyzed in duplicates using OmniSec4.2 TM. The protein amount was determined from the refractive index signal. Detector was calibrated with BSA.. 2.4.6. LC MS/MS Tryptic peptides were separated by reversed phase capillary high-performance liquid chromatography (HPLC, Nanoease Symmetry 300TM trap column and Nanoease Atlantis dC18TM separating column; Waters, Milford, MA, USA) directly coupled to an ElectroSpray ionization-quadrupole-time of flight mass spectrometer (Q-Tof Ultima Global; Waters). Data acquisition and instrument control was done with the Masslynx software V4.1 (Waters). Peptides were eluted with an acetonitrile gradient (Solvent A 0.1%v/v formic acid / 5% v/v acetonitrile, solvent B 0.1%v/v formic acid / 95% v/v acetonitrile; 5–45% B) and directly subjected to ionization and mass spectrometry. Data were acquired in the data-directed analysis mode in the mass range from 350 to 1900. Fragmentation time of the peptides was 4 s per ion, four ions were fragmented simultaneously. Peptide fragmentation data were acquired in the mass range from 50 to 1900. Survey and fragment spectra were analyzed using the software Proteinlynx Global Server version 2.2.5 (Waters) with automatic and manual data validation. For sequence identification, Swiss-Prot and TrEMBL database were used.. 2.5. Immunochemical procedures 2.5.1. Total IgE determination Determination of total IgE in humans was determined with two different methods.. “Candidate genes for asthma”, total serum levels. were quantified by. duplicate using a commercial enzyme-linked immunosorbent assay (ELISA) kit (RIDASCREEN® Total IgE; R-Biopharm, Darmstadt, Germany), following manual recommendations. In those subjects belonging to any of the two other epidemiological programs, total IgE was measured by ImmunoCAP (Phadia). In section 2.8, it will be fully described those methodological aspects regarding ImmunoCAP determinations, both for total and specific IgE. 37.
Figure
![Table 2.1 Polymerase chain reaction for amplification of Blo t 5 Reagent [ ] stock Vol](https://thumb-us.123doks.com/thumbv2/123dok_es/3463542.615337/31.893.312.582.850.1083/table-polymerase-chain-reaction-amplification-blo-reagent-stock.webp)


+7


Documento similar
Thus emerges the possibility that in Pozo Moro there was a monument of this type, in which our piece served as the block supporting the Egyptian or gorge cornice as typically found
No obstante, como esta enfermedad afecta a cada persona de manera diferente, no todas las opciones de cuidado y tratamiento pueden ser apropiadas para cada individuo.. La forma
The expansionary monetary policy measures have had a negative impact on net interest margins both via the reduction in interest rates and –less powerfully- the flattening of the
Jointly estimate this entry game with several outcome equations (fees/rates, credit limits) for bank accounts, credit cards and lines of credit. Use simulation methods to
In our sample, 2890 deals were issued by less reputable underwriters (i.e. a weighted syndication underwriting reputation share below the share of the 7 th largest underwriter
The aim of this study was to determine the prevalence of late fetal mortality and risk factors for cesarean birth in women with a dead fetus of 28 or more weeks of gestation in
The aim of this study was to evaluate retrospectively the sensitivity of three different serological tests used in real clinical practice for the screening and diagnosis of
The Dwellers in the Garden of Allah 109... The Dwellers in the Garden of Allah
