Directional migration of neural crest cells in vivo is regulated by Syndecan 4/Rac1 and non canonical Wnt signaling/RhoA
10
0
0
Texto completo
(2) convergence of Syn4 and PCP signaling through the regulation of small GTPases contributes to the directional migration of neural crest cells. MATERIALS AND METHODS Xenopus and zebrafish embryos, micromanipulation and graft experiments. Xenopus embryos were obtained and dissections carried out as previously described (Mancilla and Mayor, 1996). Embryos were staged according to Nieuwkoop and Faber (Nieuwkoop and Faber, 1967). Zebrafish strains were maintained and bred according to standard procedures (Westerfield, 2000). Transgenic sox10:egfp (Carney et al., 2006) embryos were obtained by crossing heterozygous adults. Xenopus NC grafts were carried out as described by De Calisto et al. (De Calisto et al., 2005). Zebrafish cell transplants were performed according to Westerfield (Westerfield, 2000); sox10:egfp donor embryos were injected at the one- or two-cell stage with a mixture of tetramethylrhodamine dextran (RDX) (1 ng/nl; Molecular Probes) and either control or syn4 morpholino oligonucleotides (MOs). At the sphere stage, single or small groups of around 10 donor cells were transplanted into the apical region of unlabelled wild-type host embryos using an oil-filled manual injector (Sutter Instrument Company). Embryos were cultured until 12 somites and observed using time-lapse microscopy (Leica DM5500). Whole-mount in situ hybridization and cartilage staining. In situ hybridization was carried out according to Harland (Harland, 1991) using digoxigenin-labelled antisense RNA probes (Roche Diagnostics). Probes used were: Xenopus syn4 (Munoz et al., 2006); and zebrafish syn4, snail2 (Mayor et al., 1995), fli (Meyer et al., 1995), foxd3 (Kelsh et al., 2000) and crestin (Luo et al., 2001). For cartilage staining, 5-dpf zebrafish were stained according to Barrallo-Gimeno et al. (Barrallo-Gimeno et al., 2004). RNA synthesis and morpholino microinjection. cDNA was linearized and RNA was synthesized using the mMessage mMachine Kit (Ambion), according to the manufacturer’s instructions. mRNA and MOs were co-injected into Xenopus embryos with fluorescein dextran (FDX, Molecular Probes) at the eight- or 32-cell stage (Aybar et al., 2003). For zebrafish microinjection, 4 nl was injected at the one- or two-cell stage. The mRNA constructs used were: Xenopus syn4 (Munoz et al., 2006); and zebrafish syn4, DshDEP+ and DshΔN (Tada and Smith, 2000), and mutant syn4. Two translation-blocking MOs against zebrafish syn4 were designed over the 5⬘UTR region: syn4 MO1, 5⬘CGGACAACTTTATTCACTCGGGCTA3⬘; and syn4 MO2, 5⬘GAGAAG(ATG)TTGAAAGTTTACCTCA3⬘. As both MOs produced the same phenotype, we used mainly syn4 MO1 (called syn4 MO), except in some experiments where syn4 MO2 or a mixture of both MOs was used, as indicated in the text and figure legends. A standard control MO was used: 5⬘CCTCTTACCTCAGTTACAATTTATA3⬘. Injection of this control MO into wild-type zebrafish embryos caused no defective phenotype. Two translation-blocking MOs against Xenopus syn4 were used: syn4 MO1, 5⬘GCACAAACAGCAGGGTCGGACTCAT3⬘; and syn4 MO2, 5⬘CTAAAAGCAGCAGGAGGCGATTCAT3⬘ (Munoz et al., 2006). Throughout this work, a 1:1 mixture of both MOs called syn4 MO was used. A 5-base mismatched MO against Xenopus syn4 was used as a control (5⬘GCAGAAAGATCAGCGTCCGACTGAT3⬘). The other MO used was directed against wnt5a (Lele et al., 2001). Unless stated otherwise, 6 ng of MO was used for zebrafish and 8 ng for Xenopus. For the mutation in the PKCα-binding site of Syn4 (called Syn4*), a mutation was introduced in the PIP2-binding site that enables interaction with PKCα. Amino acid residues Y185KK were changed to LQQ using PCR with mutated primers. According to Horowitz et al., this mutation reduces the affinity of PIP2 binding to Syn4 (Horowitz et al., 1999). We observed that this mutant has the same activity as wild-type Syn4 in a neural plate induction assay (our unpublished results). Time-lapse microscopy. sox10:egfp was used to analyze NC migration in vivo (Carney et al., 2006). Embryos were processed as described by Westerfield (Westerfield, 2000). Each embryo was staged according to the number of somites and only. Development 135 (10) embryos with equal numbers of somites were compared. The embryos were dechorionated, inserted into a drop of 0.20% agarose in embryo medium (Westerfield, 2000) and mounted in a custom-built chamber. Control and experimental embryos were mounted side-by-side in the same chamber. A compound (Leica DM5500) or a confocal (Leica SP2-DMRE) microscope was used for time-lapse imaging. Digital images were typically collected at 30 to 90 second intervals for a period of between 1 and 14 hours. We performed z-stack in preliminary experiments to establish how deep the NC migrates in the embryo. After 6- to 8-hour time-lapse imaging of 20-somite embryos, we found that cephalic NC cells migrate between 500 and 800 μm in the anteroposterior axis, between 40 and 60 μm in the dorsoventral axis, and between 7 and 9 μm in the periphery-center axis. Consequently, for tracking analysis, we can assume that most of the cell migration is performed in two dimensions; the third dimension (in the z-axis when the embryo has a lateral orientation) can be neglected. Sequences of images were quantitatively analyzed using the public domain program NIH ImageJ (developed at the US National Institutes of Health) and Matlab (MathWorks). Tracking of individual cells was used to calculate velocity (total distance traveled divided by time), persistence (defined as the ratio between the linear distance from the initial to the final point and the total length of the migratory path) and the angle of migration (with respect to its previous position). The shape of individual cells was analyzed using NIH ImageJ. Thresholds were fixed at the same value for control and syn4 MO-injected cells. The outline/analyze particles function was used to draw the contour of each cell at different time points, which were overlapped maintaining the original XY positions. Two independent methods were used to analyze cell protrusions. For the first method, we defined Cell extension (CE) as the new positive area between two consecutives frames (separated by the shortest time of 1 minute in the time-lapse analysis). During the course of one minute, the body (and centroid) of the cell does not move a significant distance and most of the new area generated corresponds to lamellipodia extension. Note, fillopodia were not considered in this analysis as they move faster and the intensity of fluorescence is weaker. Using ImageJ, we subtracted two consecutives frames, in a manner that the new growing area was shown in red and the unchanged area in white (Fig. 6C,H,M). The centroid (defined as the average of the x and y coordinates of all the cell pixels) was calculated and a vector between the centroid (x) and the center of the red area was drawn (arrow in Fig. 6N). These vectorial data were used to analyze the distribution of CE orientation under different conditions. As a second method to estimate cell protrusion, we measured the Cell Smoothness (CS), defined as the ratio between the perimeter of an ideal ellipse-shaped cell and the actual perimeter of the cell. The ellipse was the best-fit ellipse and we used the standard builtin ImageJ function. This value gives us an unbiased measure of how folded a cell is (i.e. how many protrusions a cell has). P-values were obtained using a one-way analysis of variance (ANOVA). All statistical analyses and their graphical illustrations were performed on Matlab, using both built-in functions and customized scripts (available from the authors on request). Fluorescence (Förster) resonance energy transfer (FRET). Plasmid DNA encoding FRET probes [Raichu-Rac, Raichu-Cdc42 (Itoh et al., 2002) and RhoA biosensor (Pertz et al., 2006)] was injected directly into Xenopus embryos at the eight-cell stage and NCs were dissected at stage 15. For in vitro analysis, NC cells were cultured on fibronectin, as described by Alfandari et al. (Alfandari et al., 2003), and fixed with 4% PFA after 5-7 hours migration. For the in vivo analysis, injected neural crests were grafted into wild-type hosts. Embryos were fixed in MEMFA at stage 26, and 12 μm cryostat sections were taken. Samples for FRET analysis were imaged using a Zeiss lSM 510 META laser scanning confocal microscope and a 63⫻ Plan Apochromat NA 1.4 Ph3 oil objective. The CFP and YFP channels were excited using the 405nm blue diode laser and the 514-nm argon line, respectively. The two emission channels were split using a 545-nm dichroic mirror, which was followed by a 475-525 nm bandpass filter for CFP and a 530 nm longpass filter for YFP. Pinholes were opened to give a depth of focus of 3 mm for each channel. Scanning was performed on a line-by-line basis with the zoom level set to two. The gain for each channel was set to approximately 75% of dynamic range (12-bit, 4096 gray levels) and offsets set such that. DEVELOPMENT. 1772 RESEARCH ARTICLE.
(3) Directional migration of neural crest backgrounds were zero. The time-lapse mode was used to collect one prebleach image for each channel before bleaching with 50 scans of the 514 nm argon laser line at maximum power (to bleach YFP). A second post-bleach image was then collected for each channel. Pre- and post-bleach CFP and YFP images were imported into Mathematica 5.2 for processing. Briefly, images were smoothed using a 3⫻3 box mean filter, background subtracted and post-bleach images fade compensated. A FRET efficiency ratio map over the whole cell was calculated using the following formula: (CFPpostbleach–CFPprebleach)/CFPpostbleach. Ratio values were then extracted from pixels falling inside the bleach region, as well as an equal-sized region outside of the bleach region, and the mean ratio was determined for each region and plotted on a histogram. The non-bleach ratio was then subtracted from the bleach region ratio to give a final value for the FRET efficiency ratio. Data from images were used only if YFP bleaching efficiency was greater than 70%.. RESEARCH ARTICLE 1773. NC markers twist and fli (Fig. 1J-L). The early expression of syn4 in Xenopus does not delineate the NC as precisely as do the NC markers (Fig. 1G,J), which suggests that syn4 is also expressed in cells adjacent to the migrating NC. This highly localized expression of syn4 prompted us to analyze its function in NC development. Two morpholino antisense oligonucleotides (MO1, MO2) were developed to inhibit zebrafish syn4. We tested the efficiency of MO1 by analyzing its ability to reduce the fluorescence of a Syn4-GFP fusion protein (Fig. 2A-C).. Fig. 1. syn4 is expressed in the migrating NC. (A-L) Lateral views of zebrafish (A-F) and Xenopus (G-L) embryos. Anterior is to the left. (A,D) 12- to 14-somite embryo. (B,E) 20-somite embryo; (C,F) higher magnification of the trunk region in B,E. (A-C) syn4 expression; (D) sox10 expression; (E,F) crestin expression. Note that the expression of syn4 in the migrating NC cannot be distinguished from the expression of the NC markers. (G,J) Stage 26 embryo. (H,K) Stage 30 embryo. (I,L) Cephalic region of a stage 35 embryo. (G-I) syn4 expression. (J) twist expression. (K,L) fli expression. Note the expression of syn4 in the migrating cephalic NC.. Fig. 2. Syn4 is required for NC development but not for NC induction. (A-C) Efficiency of the syn4 MO. Zebrafish embryos were injected with 250 pg of syn4-egfp mRNA containing the MO-binding site (A). Fluorescence was significantly decreased by co-injection of 6 ng syn4 MO (B) and was totally abolished with 15 ng MO (C), demonstrating that the MO is able to efficiently inhibit Syn4. (D,E,G,H) Ventral view of zebrafish embryos showing cartilage development, analyzed by Alcian Blue staining (D,G) or cartilage fluorescence in the sox10:egfp line (E,H). (D,E) Control MO; (G) 6 ng of syn4 MO1; (H) 6 ng of syn4 MO2. (F,I) Lateral view of zebrafish embryos showing melanocytes. (F) Control MO; (I) syn4 MO. (J-O) Syn4 is not required for NC induction. (J) syn4 MO was co-injected with FDX into one blastomere of a two-cell stage Xenopus embryo and the expression of snail2 was analyzed at stage 18, before NC migration. No effect on the expression of snail2 was observed (96%, n=42). (K,L) Zebrafish embryos were injected with control MO (K) or syn4 MO (L), and the expression of the premigratory NC marker foxd3 was analyzed. No effect on the expression of foxd3 was produced by injection of syn4 MO. (M) syn4 MO was injected into one-cell stage Xenopus embryos, and at the blastula stage animal caps were dissected and conjugated with dorsolateral marginal zone (DLMZ), which is know to induce NC. The expression of snail2 was analyzed at the equivalent of stage 18. (N) Conjugates of DLMZ with control animal caps show a strong induction of snail2 (100%, n=15). (O) Conjugates of DLMZ with syn4-MO injected animal caps also show a strong induction of snail2 (100%, n=10).. DEVELOPMENT. RESULTS Syn4 is expressed in the NC and is required for NC development The expression of zebrafish and Xenopus syn4 was compared with that of specific neural crest markers. In both species, syn4 is expressed in the NC as soon as the cells start to migrate (Fig. 1A,G). In zebrafish, the migrating NC can be recognized at 20 hpf as disperse cells in the head and as streams of cells migrating through the somites in the trunk (Fig. 1B,C). This pattern of expression is indistinguishable from that of the NC marker crestin (Fig. 1E,F). Visualization of trunk NC is more difficult in Xenopus, but a similar pattern of expression of syn4 was observed in the migrating cephalic NC (Fig. 1G-I), where NC cells were identified with the migratory.
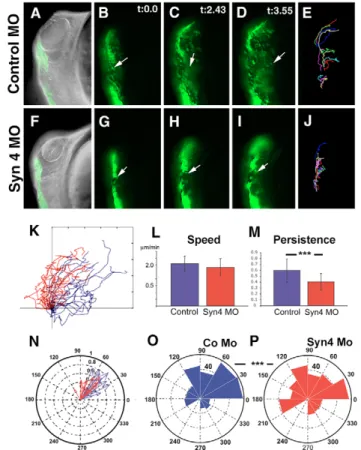
(4) 1774 RESEARCH ARTICLE. Development 135 (10). Injection of syn4 MO1 or syn4 MO2 into zebrafish produces a dramatic reduction of neural crest derivatives, including cartilage (Fig. 2D,E,G,H; see also Fig. S1 in the supplementary material) and melanocytes (Fig. 2F,I; Fig. S1 in the supplementary material). We ruled out a possible role for Syn4 in NC specification by analyzing the expression of early NC markers. No effect on the expression of NC markers was seen in Xenopus (Fig. 2J) or zebrafish (Fig. 2K,L) embryos injected with syn4 MOs. In addition, when either control ectoderm, or ectoderm injected with syn4 MO, was combined with dorsolateral mesoderm to test for induction of the NC, no difference was observed (Fig. 2M-O).. Fig. 3. Syn4 is required for NC migration. (A-D) Lateral view of Xenopus cephalic NC at stage 24, analyzed by the expression of snail2. Arrows indicate streams of migrating NC. (A) 8 ng control MO; (B) 8 ng syn4 MO; (C) 100 pg syn4 mRNA; (D) 8 ng syn4 MO and 100 pg syn4 mRNA. (E) Xenopus embryos were injected with 8 ng of syn4 MO together with 0, 25, 50 or 100 pg of syn4 mRNA (1st to 4th bar), 50 or 100 pg of syn4 mRNA only (5th and 6th bar), or 8 ng syn4 MO with 0 or 150 pg of syn4 mRNA mutated in the PKCα-binding site (Syn4*, 7th and 8th bar). NC migration was analyzed by the expression of snail2 at stage 24, as shown in A. Embryos were scored as a normal migration, mild or strong inhibition. Co-injection of syn4 mRNA rescues the inhibition of NC migration produced by the syn4 MO (1st to 4th bar), but no rescue is observed with Syn4 mutated in the PKCα-binding site (Syn4*, 7th and 8th bar). (F-I) Lateral view of zebrafish at 20 somites. Trunk NC migration was analyzed by the expression of crestin. Dorsal to the top; anterior to the left. (F) Control MO (6 ng); (G) syn4 MO (6 ng); (H) syn4 mRNA (250 pg); (I) syn4 MO and syn4 mRNA. (J) NC migration was analyzed by the expression of crestin when the embryo had 20 somites. The number of streams of NC migrating through the somites was counted. Co-injection of syn4 mRNA rescues the reduction in the number of streams of NC produced by syn4 MO.. whether present in the grafted NC or in the host (Fig. 4K-P). These results suggest that Syn4 is required autonomously in the NC to control its migration, but that an interaction with other NC cells expressing syn4 is also required. Syn4 controls the directionality of NC migration and the orientation of cell protrusions As the migration of NC cells is a complex process involving an early delamination step followed by active cell migration, we explored which step is affected by syn4 MO. We used the sox10:egfp zebrafish transgenic line to visualize migrating NC cells (Carney et al., 2006). The movement of individual cephalic NC cells was followed (Fig. 5A-D; similar results were seen with trunk NC, data not shown) and their migration path was tracked (Fig. 5E). A strong inhibition of the migration of NC cells in the syn4 MO-injected embryos was. DEVELOPMENT. Syn4 is required for NC migration Next, we analyzed whether Syn4 is involved in NC migration. Migration of cephalic neural crest can be recognized in Xenopus as three streams of cells (Fig. 3A), whereas the migrating trunk NC can be visualized in zebrafish as streams of cells in the somites (Fig. 3F). Injection of syn4 MO or mRNA leads to a strong inhibition of cephalic and trunk NC migration (Fig. 3B,C,G,H). Co-injection of syn4 mRNA, which does not contain the MO-binding site, together with the MO can rescue NC migration, demonstrating that the MO specifically targets syn4 (Fig. 3D,E,I,J). Importantly, however, overexpression of syn4 carrying a mutation in the PKCα-binding site does not rescue NC migration in syn4-MO-injected embryos (Fig. 3E, two last columns), which is different to what has been reported for the effect of this mutation in cells cultured in vitro (Bass et al., 2007). Our results show that syn4 MO affects NC migration; however, it is also possible that the MO interferes with NC migration in a noncell-autonomous manner, as it is known, for example, that syn4 MO affects convergent extension of mesoderm (Munoz et al., 2006) (L.M. and R.M., unpublished). Two experiments were performed to analyze this possibility. First, we injected zebrafish embryos with a MO against has2, the synthesizing enzyme of Hyaluronan, which has been described to perturb convergent extension (Bakkers et al., 2004). Injection of the has2 MO produced a strong phenotype in convergent extension, as previously described, but no difference in the migration of NC between control and has2 MO-injected embryos was observed (see Fig. S2A,B in the supplementary material). A second set of experiments were performed to show that syn4 MO inhibits cell migration in a cell-autonomous manner. Grafts of fluorescein dextran (FDX)- or syn4 5-base mismatched MO (syn4 5mm MO)-injected Xenopus NC into control embryos (Fig. 4A) show normal migration (Fig. 4B,C; uninjected, 87% grafts migrated, n=15; syn4 5mm MO, 75% grafts migrated, n=12); however, grafts of NC injected with syn4 MO exhibit a complete inhibition of migration (Fig. 4D; 0% grafts migrated, n=15). This result suggests that Syn4 is required in a cell-autonomous manner for NC migration. However, the NC graft contains a large number of cells that could affect each other in a non-cell-autonomous manner; therefore, true cell-autonomy can only be examined by grafting single cells. As it is technically difficult to do this in Xenopus, we used zebrafish embryos for this experiment, using a transgenic line that expresses GFP only in NC cells (sox10:egfp) (Carney et al., 2006). We grafted either NC cells injected with the syn4 MO into wild-type embryos (Fig. 4E) or wild-type NC cells into embryos injected with the MO (Fig. 4F). Fig. 4G-N shows the GFP-positive cells after 4 hours of migration. The average distance traveled in 4 hours by several grafts is shown in Fig. 4O,P. The control MO did not inhibit NC migration (Fig. 4O,P; compare position at time 0, indicated by the black arrow in Fig. 4G-J with the position 4 hours later, white arrow in Fig. 4H,J). However, syn4 MO had a significant effect on NC migration,.
(5) Fig. 4. Syn4 is required for NC migration in a cell- and non-cellautonomous manner. (A-D⬘) Xenopus NC grafts. (A) Embryos were injected at the one-cell stage with 8 ng of syn4 MO and FDX; at stage 16, the NC were dissected, grafted into a normal host and NC migration was analyzed by looking at the fluorescence. (B,B’) Control showing normal NC migration (87% of migration, n=15). (C,C’) syn4 5-base mismatch morpholino (syn4 5mm MO)-injected embryo, showing normal NC migration (75% of migration, n=12). (D,D’) syn4 MO-injected embryo showing inhibition of NC migration (0% of migration, n=15). (E-P) Zebrafish graft embryos. (E) sox10:egfp embryos were co-injected with RDX and control or syn4 MO; cells taken from these embryos were grafted into wild-type embryos and NC migration was analyzed. (F) sox10:egfp embryos were injected with RDX; cells taken from these embryos were grafted into wild-type embryos previously injected with control or syn4 MO and NC migration was analyzed. (G-N) GFP-expressing cells were overlapped on DIC image. Black arrow indicates the initial position of the NC; white arrow indicates the position of the NC after 4 hours. (G-J) Control MO; (K-N). syn4 MO. (O) Average distance traveled for the grafted cells in 4 hours in experiment shown in E. (P) Average distance traveled for the grafted cells in 4 hours in experiment shown in F. **P<0.005.. observed (Fig. 5F-I; see also Fig. S3 in the supplementary material); the cells were motile, but their overall migration was reduced, as shown by the cell tracks (Fig. 4J). We confirmed that these effects were not due to a delay in cell migration by analyzing embryos at later stages of development (see Movie 1 in the supplementary material). Moreover, these data suggest that delamination and cell motility are not inhibited, as cells can migrate as individuals. Tracks of individual cells (Fig. 5K) showed no significant difference in the velocity of migration between control and syn4 MO cells (Fig. 5L; P=0.2276, n=15). However, the directionality of migration [measured as persistence (the linear displacement of the cell divided by the total distance traveled)] was significantly affected by the syn4 MO (Fig. 5M; P=0.0049, n=15). The distribution of angles of migration for each individual cell at each time point also. RESEARCH ARTICLE 1775. Fig. 5. Syn4 controls the persistence of NC migration. A sox10:egfp zebrafish transgenic line was used to analyze NC migration in vivo. (A-D,F-I) Time lapse of embryos at 16 hpf carried out for 4 hours, three frames (t=0.0 min, t=2.43 min and t=3.55 min) are shown; first frame is also overlapped with a DIC image. Dorsal to the left; anterior to the top. Arrow indicates an individual cell as an example. (E,J) Trajectories of 4 hours of migration. (A-E) Control MO; (F-J) syn4 MO. (K) Trajectories of cells from different experiments. Blue, control MO; red, syn4 MO. (L) Velocity of migration. (M) Persistence of migration. (N) Angle of migration for each individual cell. Blue, control MO; red, syn4 MO. (O,P) Rose plot showing the distribution of angles of each time point during the 4 hours of migration. The area of each bin represents the number of cells moving in that direction. (O) Control MO; (P) syn4 MO. ***P<0.005.. demonstrated a significant difference between control MO (Fig. 5N,O) and syn4 MO (Fig. 5N,P; P=0.0044, n=665) cells. Taken together, these results indicate that the syn4 MO affects NC migration by interfering with the directionality of migration. As far as we know, this is the first time that a specific effect on the directional migration of NC cells has been described during development. As persistence of migration usually depends on the orientation of cell protrusions (Ridley et al., 2003), we analyzed whether cell protrusions are affected by the syn4 MO. In Fig. 6A,B, the NC cells migrating around the optic vesicle (mandibular stream) are shown at two time points. Strikingly, the cell morphologies observed in control MO- (Fig. 6A,B,D; Movie S2 in the supplementary material) and syn4 MO- (Fig. 6F,G,I; Movie S3 in the supplementary material) injected cells are very different; control cells are elongated along the axis of migration, whereas syn4 MO-injected cells are more rounded. In order to quantify these differences, we measured two different parameters. First, we measured cell smoothness (CS; defined as the ratio between the perimeter of an ideal ellipse-shaped. DEVELOPMENT. Directional migration of neural crest.
(6) 1776 RESEARCH ARTICLE. Development 135 (10). cell and the actual perimeter of the cell, which gives us an unbiased measure of how folded a cell is, i.e. how many protrusions a cell has). A significant difference in CS was observed between the control and syn4 MO (Fig. 6K,L; P<0.0005, n=59). A second parameter related to cell protrusions that we call cell extension (CE) was also measured (Fig. 6M). We define CE as the new positive area between two consecutives frames (separated by 1 minute). During the course of a minute, the body (and centroid) of the cell does not move a significant distance and careful comparison of the morphology of the cell between consecutive frames strongly suggests that CE corresponds to cell protrusions, such as lamellipodia (Fig. 6C,M). However, fillopodia cannot be observed, as they move faster and the intensity of fluorescence is weaker. Comparison with control and syn4 MO-injected NC cells cultured in vitro, where the lamellipodia can be easily identified, strongly suggest that our CE corresponds to lamellipodia (Fig. 6C-E). Most CEs are formed at the anterior edge of control cells (Fig. 6C), whereas equivalent CEs are found all over the cell in embryos injected with the syn4 MO (Fig. 6H). We measured the orientation. of CE by calculating the direction of a vector drawn from the centroid of the cell to the centroid of the CE (Fig. 6N). A significant difference in the orientation of the CE was found between control and syn4 MO cells (Fig. 6O,P; P<0.005, n=180). In conclusion, syn4 MO is required for the polarized formation of CEs. Interestingly, we have previously shown that the inhibition of PCP signaling in vitro in Xenopus NC cells leads to the formation of long cell protrusions all over the cells (De Calisto et al., 2005), reminiscent of the phenotype observed here for syn4 MO. In order to confirm this finding in vivo, we carried out a similar analysis of CE in zebrafish. First, we had to test that non-canonical Wnt signaling is also required for NC migration in zebrafish embryos, as this has only been shown in Xenopus. Three different treatments that specifically affect PCP signaling were used and migration of trunk neural crest was analyzed (Fig. 6S). Embryos injected with a dominant-negative form of Dishevelled (Dsh) specific for the PCP pathway (DshDep+), or with a MO that has been shown to specifically inhibit wnt5 (Kilian et al., 2003; Lele et al., 2001) (Fig. 6S-V), and the PCP mutant tri (trilobite, also known as strabismus;. DEVELOPMENT. Fig. 6. Syn4 and PCP signaling control the orientation of cell protrusions. (A,B,F,G) Time-lapse analysis of the mandibular NC stream of a sox10:egfp embryo at 18 hpf for 30 minutes. The initial and final frames are shown. Arrow indicates the expected direction of migration based on the orientation of the embryo. Cell extensions are shown in C and H in red. (D,I) Outline of individual cells at different times (minutes). (E,J) NC cells cultured in vitro, expressing membrane GFP. (A-E) Control MO; (F-J) syn4 MO. Scale bars: 25 μm in A,F; 10 μm in D,E,I,J. (K,L) Quantification of cell smoothness (CS) of NC cells. (K) Box-plot showing the distribution of CS values for control and syn4 MO-injected cells. A significant difference was observed (P<0.005). (L) Histogram of CS for control and syn4-MO injected cells. (M,N) Analysis of CE. (M) Two consecutives frames were subtracted, in a manner that the new growing area is shown in red and the unchanged area in white. A vector between the centroid of the cell and the centroid of the red area was drawn (arrow in N). (O-R) Rose plots showing the orientation of CE. (O) Control MO; (P) syn4 MO; (Q) control embryo; (R) embryo injected with DshDep+. Note the difference in scale. Scale bar: 20 μm; ***P<0.005. (S-V) Non-canonical Wnt signaling is required for zebrafish neural crest migration. Lateral views of dorsal neural tubes of 20-somite zebrafish embryos are shown after crestin staining by in situ hybridization. Dorsal to the top; anterior to the left. (S) Control; (T) 200 pg of DshDep+ mRNA; (U) 3 ng of wnt5 MO. (V) Percentage of inhibition in trunk NC migration. White, no inhibition; yellow, mild inhibition; red, strong inhibition..
(7) Directional migration of neural crest. RESEARCH ARTICLE 1777. significant difference in the orientation of CE was observed compared with control NC cells (Fig. 6Q,R; P<0.0005, n=101). Taken together, our results show that both the activity of Syn4 and PCP signaling are required to restrict the formation of CEs to the anterior edge of the cell in vivo. As the inhibition of Syn4 and PCP signaling produce a similar NC phenotype, we investigated whether there was an interaction between these two signals by performing a genetic interaction study in zebrafish embryos. syn4 MO was co-injected with a MO specific for wnt5 (Kilian et al., 2003; Lele et al., 2001). When 1 ng of syn4 or wnt5 MO was injected into wild-type embryos only a mild inhibition of NC migration was observed (Fig. 7B,F); however, coinjection of both MOs together produced a much stronger NC phenotype (Fig. 7G,H). An equivalent experiment, with similar results, was performed with the tri mutant (Fig. 7A,C,D). These results indicate that Syn4 interacts genetically with the PCP signaling pathway. This genetic interaction could be compatible with either a hierarchical relationship between Syn4 and Dsh, or an interaction between two parallel pathways.. Fig. 7C) showed defects in NC migration, although the tri mutant exhibited a milder NC phenotype than those caused by the other two treatments. These results show that in zebrafish, as in Xenopus (De Calisto et al., 2005), PCP signaling is required for NC migration. Next, we used the sox10:egfp transgenic line to analyze the orientation of CE after Dsh inhibition by injection of DshDep+. A. Syn4 and PCP signaling control the localized activity of Rac and RhoA It has been observed in many in vitro studies of cell migration that cell polarity and the formation of cell protrusions are dependent on the activity of members of the small Rho GTPase family (Jaffe and Hall, 2005). To analyze the activity of GTPases in the NC in vitro and in vivo, we used fluorescence resonance energy transfer (FRET) biosensors for Cdc42, Rac and RhoA (Itoh et al., 2002; Pertz et al., 2006). The inhibition of Syn4 leads to a fivefold increase in Rac activity (Fig. 8A-C). No significant effect on the activity or localization of Cdc42 or RhoA was seen between control and syn4 MO-injected cells (Fig. 8A). Therefore, Syn4 inhibits Rac activity in the NC cell migrating in vitro. Next, we investigated whether Dsh could also play a role in GTPase signaling. The activation of Cdc42, Rac and RhoA was compared among control NC cells and cells from embryos injected with DshΔn or DshDep+ (Fig. 8D-F). The activation or inhibition of Fig. 8. FRET analysis of Cdc42, Rac and RhoA activity in NC migrating in vitro after modification of Syn4 and PCP signaling. Embryos were injected with the probes for Cdc42, Rac and RhoA. Neural crest was dissected, cultured in vitro and FRET analysis performed. (A) FRET efficiency for Cdc42, Rac and RhoA in control or syn4 MO-injected NC cells. (B) Rac FRET efficiency for control NC. Arrow indicates the direction of migration, determined by time-lapse analysis of cell behavior immediately before fixation. (C) Rac FRET efficiency for syn4 MO NC. (D) FRET efficiency for Cdc42, Rac and RhoA in control or cells injected with 1 ng DshΔn or 1 ng DshDep+ (Dep+). (E) RhoA FRET efficiency for control NC. Arrow indicates the direction of migration. (F) RhoA FRET efficiency for DshDep+-injected NC. (G) FRET analysis for RhoA and Rac was performed after treatment with the RhoA inhibitor Y27632 or the Rac inhibitor NSC23766. (H) Rac FRET efficiency for control NC. Arrow indicates the direction of migration. (I) Rac FRET efficiency for the cell treated with Y27632. ***P<0.005; **P<0.01. Scale bar: 10 μm.. DEVELOPMENT. Fig. 7. Interaction between Syn4 and PCP signaling. Zebrafish genetic interaction experiment. Lateral views of dorsal neural tubes of 20-somite zebrafish embryos are shown after crestin staining by in situ hybridization. Dorsal to the top; anterior to the left. (A) Wild-type embryo. (B) Wild-type embryo injected with 1 ng of syn4 MO. (C) tri mutant. (D) tri mutant injected with 1 ng of syn4 MO. (E) Percentage of inhibition of NC migration. White, no inhibition; yellow, mild inhibition; red, strong inhibition. (F) Wild-type embryo injected with 1 ng of wnt5 MO. (G) Wild-type embryo co-injected with 1 ng of wnt5 MO and 1 ng of syn4 MO. (H) Percentage of inhibition of trunk NC migration..
(8) Development 135 (10). Dsh had no significant effect on the activity of Cdc42 or Rac (Fig. 8D). However, the activation of Dsh led to a significant increase in RhoA activity, whereas the inhibition of Dsh produced a significant decrease in RhoA activity (Fig. 8D-F). Thus, Dsh-PCP promotes RhoA activity in NC migration in vitro. Crosstalk between Rac and RhoA has been described in a number of different cell types. We wished to discover whether a similar feedback loop was present in the NC cells. Cells were treated with Y27632 to specifically inhibit the RhoA effector Rock (Uehata et al., 1997), or with NSC23766 to inhibit Rac activity (Gao et al., 2004), and the activity of Rac and RhoA was analyzed by FRET. The inhibition of Rock led to a significant increase in Rac activation (Fig. 8G-I), suggesting that RhoA (Rock) can act as an inhibitor of Rac activity in the NC cells. In addition, the inhibition of Rock produced an increase in cell protrusions in different directions, whereas the inhibition of Rac reduced the number of cell protrusions (not shown). These measurements of small Rho GTPase activity were performed in NC cells cultured on fibronectin in vitro. A growing number of reports suggest that there are important differences in the migration of cells cultured in two-dimensional (2D) versus 3D matrices (Even-Ram and Yamada, 2005), and that those differences could be even bigger when cell migration is analyzed in vivo, so we decided to perform FRET analysis of NC cells migrating in the. embryo. To our knowledge, this is the first time that small GTPase activity has been observed in vivo using FRET. DNA coding the FRET probes for RhoA and Rac was injected in blastomeres fated to become NC cells. At the early neurula stages, the NCs were dissected from the injected Xenopus embryos and grafted into control hosts. NC cells could be identified by the fluorescence of membrane-RFP, which was co-injected with each probe. During migration the embryos were fixed and sectioned, and FRET analysis was performed. Fig. 9A-D shows the migrating NC, and in Fig. 9A⬘D⬘ cells expressing the biosensors can be seen. Examples of FRET efficiency for individual cells migrating in vivo are shown in Fig. 9E-H. A clear increase in Rac activity is observed in syn4 MO cells (Fig. 9I), whereas an inhibition of RhoA is observed after Dsh inhibition (Fig. 9J). This confirms our in vitro observations, indicating that, in terms of Rho GTPase regulation, there is no apparent difference between the 2D in vitro and in vivo migration of NC cells. Taken together, our results indicate that Syn4 acts as an inhibitor of Rac and that the Dsh-PCP pathway promotes the activity of RhoA. In addition, activation of RhoA by PCP signaling may also result in Rac inhibition via the inhibitory activity of Rock upon Rac. These data all support a model whereby the Syn4 and PCP activities converge to polarize the formation of cell protrusions, restricting them to the front of the cell. More specifically, they control the levels of Rac, by both a Rac-Syn4 and a RhoA-PCP dependent pathway.. Fig. 9. FRET analysis in vivo for Rac and RhoA after modification of Syn4 and PCP signaling. Embryos were injected with the FRET probes for Rac and RhoA and membrane-RFP. Before migration, the NCs were grafted into wild-type host embryos. NC migration was observed in vivo and then the embryos were fixed, sectioned and processed for FRET analysis. (A-D) Overlay of membrane-RFP and bright-field images. Dotted circle indicates the neural tube; arrow, direction of migration. (A’-D’) Fluorescence from the FRET probes. Arrow indicates the selected cells shown in E-H. (E-H) Examples of FRET efficiency. Arrow indicates the direction of migration. (A,A’,E) Rac probe in cells injected with control MO. (B,B’,F) Rac probe in cells injected with syn4 MO. (C,C’,G) RhoA probe in cells injected with control MO. (D,D’,H) RhoA probe in cells injected with DshDep+. (I) FRET efficiency for Rac. (J) FRET efficiency for RhoA. ***P<0.005. Scale bar: 10 μm.. DISCUSSION Here, we reveal a crucial role for Syn4 in the migration of NC cells in vivo during embryo development, and its interaction with PCP signaling. Our main conclusions are that: (1) syn4 is expressed almost exclusively in the NC; (2) Syn4 and PCP signaling control the directional migration of NC cells by regulating the polarized formation of cell protrusions; and (3) Syn4 inhibits Rac, whereas Dsh promotes RhoA activity in the NC cell. Thus, Syn4 and PCP signaling work in a coordinated manner to control the directionality of NC migration both in vitro and in vivo, by regulating cell polarity and the cytoskeletal machinery that controls the formation of cell protrusions. Cdc42 has been shown to be active at the front of migrating cells and it has been suggested that this may be required for cell polarity (Etienne-Manneville and Hall, 2002). However, more recent studies show no significant effects of loss of Cdc42 upon cell polarity [either by genetic ablation or siRNA targeting (Czuchra et al., 2005; Pankov et al., 2005)]. Our data demonstrate that the inhibition of Syn4 or PCP has no effect on the activation status of Cdc42, despite having a profound effect upon cell polarity and directed migration. This would suggest that in NC migration, Cdc42 is not the primary GTPase regulating polarization and protrusion formation. Rac activation at the front of a cell has also been shown to be a key event for directional migration (Grande-Garcia et al., 2005; Nishiya et al., 2005). Several factors control the localized activity of Rac, such as specific guanine nucleotide-exchange factors (GEFs) that are delivered to the front of the cell in a PI3K-dependent manner (Welch et al., 2003), and the formation of lipid rafts (del Pozo et al., 2004). Once Rac is active, numerous feedback loops help to maintain directional protrusions (Ridley et al., 2003). We have shown here that Syn4 contributes to the inhibition of Rac, as an antisense MO against syn4 increases the levels of Rac in the entire cell, leading to loss of cell polarity similar to that seen in other cells types in vitro (Bass et al., 2007; Saoncella et al., 2004). Bass and colleagues showed that the regulation of Rac levels by Syn4 contributes to a persistent migration in vitro, with Syn4-null fibroblasts showing an activation of Rac around the cell periphery. DEVELOPMENT. 1778 RESEARCH ARTICLE.
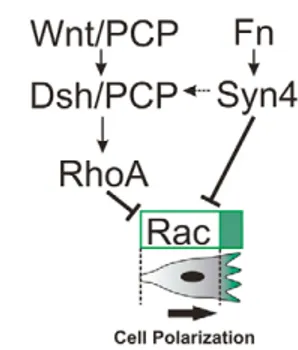
(9) (Bass et al., 2007), similar to what we have observed in the NC. However, there are some notable differences between their results and those shown here, primarily that they demonstrate that Syn4 stimulates a wave of Rac activation upon initial cell spreading, whereas we only observed a negative regulation of Rac by Syn4. Additionally, Bass et al. showed that Syn4 containing a mutation in the PKCα-binding site was able to rescue persistent migration in vitro, whereas we were unable to rescue the embryonic phenotype of the syn4 MO with this same mutant. Thus, our results support the previous notion that the PKCα-binding site is essential for Syn4 function (Alexopoulou et al., 2007). The differences between our results and those of Bass et al. (Bass et al., 2007) could be due to the added complexity of migration in an in vivo environment, or to an intrinsic difference between NC cells and fibroblasts. Differences in cell migration in vivo and in vitro have been widely documented. A number of research groups have now begun to switch to 3D models, which provide a better representation of the microenvironment of living tissues (Even-Ram and Yamada, 2005). There are some key differences between cell migration in two and three dimensions. For example, αvβ3 integrin is not detected in 3Dmatrix adhesion, and focal adhesion kinase (FAK) is less phosphorylated at residue Y397 in fibroblasts in a 3D matrix than it is in those on a 2D substrate (Cukierman et al., 2001). It has been suggested that Syn4 plays no role in migration in vivo, as, despite its role in vitro, the disruption of Syn4 in mice causes only a relatively minor and specific defect in wound healing (Echtermeyer et al., 2001). However, here, we have demonstrated a clear role for Syn4 in controlling cell migration in vivo. The minor phenotype in mice could be due to redundancy between syndecans, with Syn1 possibly being able to compensate for the lack of Syn4 activity. Interestingly, Syn1 has not been found in zebrafish (R.M., unpublished). A double Syn4/Syn1 mouse knock-out would be able to clarify this point. Unlike with Syn4, no significant effect on Rac activity was observed after modifying PCP signaling in our study, consistent with the role of Rock on convergent extension (Marlow et al., 2002). This is paradoxical, because we show that PCP signaling promotes RhoA activation and that RhoA, via Rock, inhibits the activity of Rac in NC cells. One possible explanation is that a residual amount of RhoA remaining after Dsh inhibition is sufficient to maintain the normal Rac level. It has been demonstrated that RhoA, Rac1 and Cdc42 all act downstream of PCP signaling (Choi and Han, 2002; Habas et al., 2003; Penzo-Mendez et al., 2003). Convergent extension in Xenopus and zebrafish are dependent on RhoA/Rac activity, controlled by PCP signaling (Habas et al., 2003; Habas et al., 2001; Tahinci and Symes, 2003). Our results show that RhoA, but not Rac, is dependent on PCP signaling. Interestingly, a triple deletion of the three Rac genes in Drosophila, Rac1, Rac2 and Mtl, fails to cause PCP defects (Adler, 2002; Hakeda-Suzuki et al., 2002), suggesting that Rac signaling is not essential for the PCP pathway. One open question is: how exactly does Syn4 interact with PCP signaling to control NC migration? Our results clearly indicate that Syn4 and PCP activate two parallel pathways that lead to the inhibition of Rac activity and the activation of RhoA, respectively (Fig. 10). However, we also show that RhoA inhibits Rac activity in the NC. Thus, both pathways ultimately have the same effect of decreasing the overall levels of Rac, either directly or indirectly, which is necessary for the polarized formation of cell protrusions and for maintaining persistent migration (Pankov et al., 2005). The requirement for precise levels of Rac signaling for persistent migration may explain why both inhibition and overexpression of. RESEARCH ARTICLE 1779. Fig. 10. Model of NC polarization by Wnt/PCP and Syn4. Noncanonical Wnt signaling (Wnt/Dsh/PCP) activates RhoA, which in turn inhibits Rac activity, whereas Syn4 (activated by Fibronectin, Fn) inhibits Rac activity directly. The concerted activation of these parallel pathways leads to the inhibition of Rac (green) at the back of the cell, with the consequent formation of cell protrusions at the front of the cell and directional migration (thick arrow). There is also evidence of an interaction between Syn4 and Dsh (broken arrow).. Syn4 produce an inhibition of migration, as has been previously shown for the PCP signaling pathway (De Calisto et al., 2005; Wallingford et al., 2000). It has recently been shown that Syn4 interacts with PCP signaling during convergent extension of the mesoderm (Munoz et al., 2006). They propose a direct interaction of Syn4 with Dsh and Frz7. Thus, it is possible that, in addition to this interaction between Syn4 and the Wnt receptor, each of these molecules could lead to the activation of parallel pathways that control the activity of small GTPases, as we have shown here. Chemotaxis has been suggested as one of the mechanisms to explain the directional migration of NC cells; however, there is no sound evidence for this proposal. Moreover, persistent directional migration occurs in vitro in the absence of chemoattractants. Instead, interactions between the extracellular matrix, integrins, and the levels of Rac and Syn4 can control persistent migration (Bass et al., 2007; Choma et al., 2004; Pankov et al., 2005; White et al., 2007). Here, we provide evidence that a similar mechanism regulates the migration of NC cells in vivo. Syn4 and PCP signaling in the NC act on RhoA and Rac to maintain the balance of Rac required for the formation of directional cell protrusions, which results in a persistent, directional migration. We thank M. Tada for useful comments and reagents during the course of this work. We also thank C. Stern for comments on the manuscript, R. Kelsh for the sox10:egfp transgenic line, M. Matsuda for the Cdc42 and Rac FRET probes, and K. Hahn for the RhoA FRET probe. This investigation was supported by grants from the MRC and BBSRC. H.K.M. and C.C.-F. are MRC and Boehringer Ingelheim Fonds PhD scholarship holders, respectively. Supplementary material Supplementary material for this article is available at http://dev.biologists.org/cgi/content/full/135/10/1771/DC1 References Adler, P. N. (2002). Planar signaling and morphogenesis in Drosophila. Dev. Cell. 2, 525-535. Alexopoulou, A. N., Multhaupt, H. A. and Couchman, J. R. (2007). Syndecans in wound healing, inflammation and vascular biology. Int. J. Biochem. Cell Biol. 39, 505-528. Alfandari, D., Cousin, H., Gaultier, A., Hoffstrom, B. G. and DeSimone, D. W. (2003). Integrin α5β1 supports the migration of Xenopus cranial neural crest on fibronectin. Dev. Biol. 260, 449-464. Aybar, M. J., Nieto, M. A. and Mayor, R. (2003). Snail precedes slug in the genetic cascade required for the specification and migration of the Xenopus neural crest. Development 130, 483-494.. DEVELOPMENT. Directional migration of neural crest.
(10) Bakkers, J., Kramer, C., Pothof, J., Quaedvlieg, N. E., Spaink, H. P. and Hammerschmidt, M. (2004). Has2 is required upstream of Rac1 to govern dorsal migration of lateral cells during zebrafish gastrulation. Development 131, 525-537. Barrallo-Gimeno, A., Holzschuh, J., Driever, W. and Knapik, E. W. (2004). Neural crest survival and differentiation in zebrafish depends on mont blanc/tfap2a gene function. Development 131, 1463-1477. Bass, M. D., Roach, K. A., Morgan, M. R., Mostafavi-Pour, Z., Schoen, T., Muramatsu, T., Mayer, U., Ballestrem, C., Spatz, J. P. and Humphries, M. J. (2007). Syndecan-4-dependent Rac1 regulation determines directional migration in response to the extracellular matrix. J. Cell Biol. 177, 527-538. Carney, T. J., Dutton, K. A., Greenhill, E., Delfino-Machin, M., Dufourcq, P., Blader, P. and Kelsh, R. N. (2006). A direct role for Sox10 in specification of neural crest-derived sensory neurons. Development 133, 4619-4630. Choi, S. C. and Han, J. K. (2002). Xenopus Cdc42 regulates convergent extension movements during gastrulation through Wnt/Ca2+ signaling pathway. Dev. Biol. 244, 342-357. Choma, D. P., Pumiglia, K. and DiPersio, C. M. (2004). Integrin α3β1 directs the stabilization of a polarized lamellipodium in epithelial cells through activation of Rac1. J. Cell Sci. 117, 3947-3959. Cukierman, E., Pankov, R., Stevens, D. R. and Yamada, K. M. (2001). Taking cell-matrix adhesions to the third dimension. Science 294, 1708-1712. Czuchra, A., Wu, X., Meyer, H., van Hengel, J., Schroeder, T., Geffers, R., Rottner, K. and Brakebusch, C. (2005). Cdc42 is not essential for filopodium formation, directed migration, cell polarization, and mitosis in fibroblastoid cells. Mol. Biol. Cell 16, 4473-4484. De Calisto, J., Araya, C., Marchant, L., Riaz, C. F. and Mayor, R. (2005). Essential role of non-canonical Wnt signalling in neural crest migration. Development 132, 2587-2597. del Pozo, M. A., Alderson, N. B., Kiosses, W. B., Chiang, H. H., Anderson, R. G. and Schwartz, M. A. (2004). Integrins regulate Rac targeting by internalization of membrane domains. Science 303, 839-842. Echtermeyer, F., Streit, M., Wilcox-Adelman, S., Saoncella, S., Denhez, F., Detmar, M. and Goetinck, P. (2001). Delayed wound repair and impaired angiogenesis in mice lacking syndecan-4. J. Clin. Invest. 107, R9-R14. Etienne-Manneville, S. and Hall, A. (2002). Rho GTPases in cell biology. Nature 420, 629-635. Even-Ram, S. and Yamada, K. M. (2005). Cell migration in 3D matrix. Curr. Opin. Cell Biol. 17, 524-532. Gao, Y., Dickerson, J. B., Guo, F., Zheng, J. and Zheng, Y. (2004). Rational design and characterization of a Rac GTPase-specific small molecule inhibitor. Proc. Natl. Acad. Sci. USA 101, 7618-7623. Grande-Garcia, A., Echarri, A. and Del Pozo, M. A. (2005). Integrin regulation of membrane domain trafficking and Rac targeting. Biochem. Soc. Trans. 33, 609-613. Habas, R., Dawid, I. B. and He, X. (2003). Coactivation of Rac and Rho by Wnt/Frizzled signaling is required for vertebrate gastrulation. Genes Dev. 17, 295-309. Habas, R., Kato, Y. and He, X. (2001). Wnt/Frizzled activation of Rho regulates vertebrate gastrulation and requires a novel Formin homology protein Daam1. Cell 107, 843-854. Hakeda-Suzuki, S., Ng, J., Tzu, J., Dietzl, G., Sun, Y., Harms, M., Nardine, T., Luo, L. and Dickson, B. J. (2002). Rac function and regulation during Drosophila development. Nature 416, 438-442. Harland, R. M. (1991). In situ hybridization: an improved whole-mount method for Xenopus embryos. Methods Cell Biol. 36, 685-695. Itoh, R. E., Kurokawa, K., Ohba, Y., Yoshizaki, H., Mochizuki, N. and Matsuda, M. (2002). Activation of Rac and Cdc42 video imaged by fluorescent resonance energy transfer-based single-molecule probes in the membrane of living cells. Mol. Cell. Biol. 22, 6582-6591. Jaffe, A. B. and Hall, A. (2005). Rho GTPases: biochemistry and biology. Annu. Rev. Cell Dev. Biol. 21, 247-269. Kelsh, R. N., Dutton, K., Medlin, J. and Eisen, J. S. (2000). Expression of zebrafish fkd6 in neural crest-derived glia. Mech. Dev. 93, 161-164. Kilian, B., Mansukoski, H., Barbosa, F. C., Ulrich, F., Tada, M. and Heisenberg, C. P. (2003). The role of Ppt/Wnt5 in regulating cell shape and movement during zebrafish gastrulation. Mech. Dev. 120, 467-476. Kuriyama, S. and Mayor, R. (2008). Molecular analysis of neural crest migration. Philos. Trans. R. Soc. Lond. B Biol. Sci. 363, 1349-1362.. Development 135 (10) Lauffenburger, D. A. and Horwitz, A. F. (1996). Cell migration: a physically integrated molecular process. Cell 84, 359-369. LeDouarin, N. M. and Kalcheim, C. (1999). The Neural Crest, 2nd edn. Cambridge: Cambridge University Press. Lele, Z., Bakkers, J. and Hammerschmidt, M. (2001). Morpholino phenocopies of the swirl, snailhouse, somitabun, minifin, silberblick, and pipetail mutations. Genesis 30, 190-194. Luo, R., An, M., Arduini, B. L. and Henion, P. D. (2001). Specific pan-neural crest expression of zebrafish Crestin throughout embryonic development. Dev. Dyn. 220, 169-174. Mancilla, A. and Mayor, R. (1996). Neural crest formation in Xenopus laevis: mechanisms of Xslug induction. Dev. Biol. 177, 580-589. Marlow, F., Topczewski, J., Sepich, D. and Solnica-Krezel, L. (2002). Zebrafish Rho kinase 2 acts downstream of Wnt11 to mediate cell polarity and effective convergence and extension movements. Curr. Biol. 12, 876-884. Mayor, R., Morgan, R. and Sargent, M. G. (1995). Induction of the prospective neural crest of Xenopus. Development 121, 767-777. Meyer, D., Stiegler, P., Hindelang, C., Mager, A. M. and Remy, P. (1995). Whole-mount in situ hybridization reveals the expression of the Xl-Fli gene in several lineages of migrating cells in Xenopus embryos. Int. J. Dev. Biol. 39, 909919. Munoz, R., Moreno, M., Oliva, C., Orbenes, C. and Larrain, J. (2006). Syndecan-4 regulates non-canonical Wnt signalling and is essential for convergent and extension movements in Xenopus embryos. Nat. Cell Biol. 8, 492-500. Nieuwkoop, P. D. and Faber, J. (1967). Normal Table of Xenopus laevis (Doudin). Amsterdam: Elsevier-North Holland Publishing. Nishiya, N., Kiosses, W. B., Han, J. and Ginsberg, M. H. (2005). An alpha4 integrin-paxillin-Arf-GAP complex restricts Rac activation to the leading edge of migrating cells. Nat. Cell. Biol. 7, 343-352. Pankov, R., Endo, Y., Even-Ram, S., Araki, M., Clark, K., Cukierman, E., Matsumoto, K. and Yamada, K. M. (2005). A Rac switch regulates random versus directionally persistent cell migration. J. Cell Biol. 170, 793-802. Penzo-Mendez, A., Umbhauer, M., Djiane, A., Boucaut, J. C. and Riou, J. F. (2003). Activation of Gβγ signaling downstream of Wnt-11/Xfz7 regulates Cdc42 activity during Xenopus gastrulation. Dev. Biol. 257, 302-314. Pertz, O., Hodgson, L., Klemke, R. L. and Hahn, K. M. (2006). Spatiotemporal dynamics of RhoA activity in migrating cells. Nature 440, 1069-1072. Pollard, T. D. and Borisy, G. G. (2003). Cellular motility driven by assembly and disassembly of actin filaments. Cell 112, 453-465. Ridley, A. J., Schwartz, M. A., Burridge, K., Firtel, R. A., Ginsberg, M. H., Borisy, G., Parsons, J. T. and Horwitz, A. R. (2003). Cell migration: integrating signals from front to back. Science 302, 1704-1709. Saoncella, S., Calautti, E., Neveu, W. and Goetinck, P. F. (2004). Syndecan-4 regulates ATF-2 transcriptional activity in a Rac1-dependent manner. J. Biol. Chem. 279, 47172-47176. Sheetz, M. P., Felsenfeld, D., Galbraith, C. G. and Choquet, D. (1999). Cell migration as a five-step cycle. Biochem. Soc. Symp. 65, 233-243. Tada, M. and Smith, J. C. (2000). Xwnt11 is a target of Xenopus Brachyury: regulation of gastrulation movements via Dishevelled, but not through the canonical Wnt pathway. Development 127, 2227-2238. Tahinci, E. and Symes, K. (2003). Distinct functions of Rho and Rac are required for convergent extension during Xenopus gastrulation. Dev. Biol. 259, 318-335. Teddy, J. M. and Kulesa, P. M. (2004). In vivo evidence for short- and long-range cell communication in cranial neural crest cells. Development 131, 6141-6151. Uehata, M., Ishizaki, T., Satoh, H., Ono, T., Kawahara, T., Morishita, T., Tamakawa, H., Yamagami, K., Inui, J., Maekawa, M. and Narumiya, S. (1997). Calcium sensitization of smooth muscle mediated by a Rho-associated protein kinase in hypertension. Nature 389, 990-994. Wallingford, J. B., Rowning, B. A., Vogeli, K. M., Rothbacher, U., Fraser, S. E. and Harland, R. M. (2000). Dishevelled controls cell polarity during Xenopus gastrulation. Nature 405, 81-85. Welch, H. C., Coadwell, W. J., Stephens, L. R. and Hawkins, P. T. (2003). Phosphoinositide 3-kinase-dependent activation of Rac. FEBS Lett. 546, 93-97. Westerfield, M. (2000). The Zebrafish Book. A guide for the laboratory use of zebrafish (Danio rerio). 4th edn. Eugene, OR: University of Oregon Press. White, D. P., Caswell, P. T. and Norman, J. C. (2007). αvβ3 and α5β1 integrin recycling pathways dictate downstream Rho kinase signaling to regulate persistent cell migration. J. Cell Biol. 177, 515-525.. DEVELOPMENT. 1780 RESEARCH ARTICLE.
(11)
Figure


+2
Documento similar
SECTION 3 - The role of RINGO proteins in the brain 123 RingoA mRNA is expressed in neural stem cells and proliferating progenitor cells 123 Analysis of neural stem cells
In the previous sections we have shown how astronomical alignments and solar hierophanies – with a common interest in the solstices − were substantiated in the
URI specifically localizes and inhibits WNT/ catenin signaling pathway in stem-cell-like label retaining (LR) cells, essential for organ regeneration following IR
Remarkably, mutation of all four Ser/Thr residues (P4m) of the epitope produced a protein that showed no shift in mobility in response to either Wnt3a or Wnt5a signaling
To better characterize the molecular basis of this inhibitory effect of TGF  signaling on chondrogenesis, we have analyzed by qPCR changes in the expression of Sox9 and Aggrecan,
After the Spanish withdrawal from the territory in 1975, Morocco waged a brutal military campaign against the Polisario, and large numbers of people fled to refugee camps, where
In the “big picture” perspective of the recent years that we have described in Brazil, Spain, Portugal and Puerto Rico there are some similarities and important differences,
Smaller quantal size and faster kinetics of single exocytotic events in chromaffin cells from the APP/PS1 mouse model of Alzheimer’s disease.. Calcium signaling and exocytosis
