GRADO EN INGENIERÍA DE TECNOLOGÍAS Y
SERVICIOS DE TELECOMUNICACIÓN
TRABAJO FIN DE GRADO
DESIGN AND MANUFACTURING OF INTEGRATED DEVICES
FOR OPTICAL WAVEGUIDES IN VISIBLE SPECTRUM
DISEÑO Y FABRICACIÓN DE DISPOSITIVOS INTEGRADOS DE
GUÍAS DE ONDA EN ESPECTRO VISIBLE
TRABAJO FIN DE GRADO
TÍTULO:
DISEÑO Y FABRICACIÓN DE DISPOSITIVOS
INTEGRADOS DE GUÍAS DE ONDA EN ESPECTRO
VISIBLE
AUTOR:
D. Fernando José Gordo Quiroga
TUTOR:
D. Manuel Caño
PONENTE:
D. Morten A. Geday
DEPARTAMENTO: Departamento de Tecnología Fotónica y
Bioingeniería
TRIBUNAL:
Presidente:
D. José Manuel Otón Sánchez
Vocal:
Dña. Marta Clement Lorenzo
Secretario:
D. Patxi Xabier Quintana Arregui
Suplente:
Dña. Jimena Olivares Roza
FECHA DE LECTURA: ___________________________
UNIVERSIDAD POLITÉCNICA DE MADRID
ESCUELA TÉCNICA SUPERIOR
DE INGENIEROS DE TELECOMUNICACIÓN
GRADO EN INGENIERÍA DE TECNOLOGÍAS Y
SERVICIOS DE TELECOMUNICACIÓN
TRABAJO FIN DE GRADO
DESIGN AND MANUFACTURING OF INTEGRATED OPTICAL
DEVICES IN VISIBLE SPECTRUM
DISEÑO Y FABRICACIÓN DE DISPOSITIVOS INTEGRADOS DE
GUÍAS DE ONDA EN ESPECTRO VISIBLE
Index
Abstract
.……..…….……….……….…………..……….……….……….……….……….……….……….………. 1
Resumen ………..… 2
1.
Introduction .………….….……….……….……….……….……….……….……….……….…… 3
1.1. Introduction to Optical Waveguides
1.1.1. Reflection and Refraction
1.1.2. Planar Optical Waveguide
1.1.3. Guided Modes
1.2. Optical Integrated Devices
1.2.1. Directional Coupler
1.2.2. Multimode Interference (MMI) Devices
1.2.3. Mach-Zehnder Interferometer
1.2.4. Ring Resonators
1.3. Objectives
2.
Manufacturing Procedure ……….………..………. 15
2.1. Simulation
2.2. Mask Design
2.3.
Materials
2.3.1. Substrate 1: ITO Glass
2.3.2.
Substrate 2: SiO
22.3.3. Core: SU-8 and Cyclopentanone
2.4. Chip Fabrication Process
2.4.1. Substrate Preparation
2.4.2. Spinning
2.4.3. Mask Aligning
2.4.4. Photo-resist Removal
3.
Experimental Setup ………..………….………...……… 28
3.1. Dark Room Equipment
3.1.1. He-Ne Laser
3.1.2. Micro- and Nano-Positioner
3.1.3. Digital Microscope
3.2. Characterization Method
4.
Results …………..………..……….……….. 31
Abstract
In this project we aim at addressing the study of the full manufacturing process
of a photonic integrated circuit, from the initial stage of components design to
the tests required to ensure its proper functioning. Its most innovative aspect
compared to the existing technology is that the wavelength used belongs to the
visible light spectrum. Thus the dimensions of the waveguides have to be
significantly reduced. For this reason, the analysis of new manufacturing
protocols, using new materials and new techniques, is required. In addition, the
current methods will be also modified in order to be optimized for our scenario.
In a first step, design and simulation of the desired devices were conducted so
that a set of different configurations can be approached. After that, the
integration of the maximum number of these configurations was settled in a
chromium mask design. This mask was then used in the photolithography
process to harden SU-8 photoresist over a silicon substrate. Good fabrication
results were obtained, being able to reach waveguides structures of 0.5 µm thick
and 1.5 µm wide. The final chips were characterized in a dark room with two
different laser input and proper light guidance was demonstrated as well as
output switching.
Resumen
En este proyecto se aborda el estudio del proceso completo de fabricación de un
circuito integrado fotónico, desde la etapa inicial de diseño de los componentes
hasta la comprobación de su correcto funcionamiento. El aspecto más novedoso
con respecto a la tecnología existente es que la longitud de onda de la luz
empleada pertenece al espectro visible, lo que provoca que las dimensiones de
las guías de onda empleadas se reduzcan notablemente en comparación a las
usadas en la actualidad. Por este motivo será necesario un estudio de protocolos
de fabricación, con nuevos materiales y técnicas, además de la optimización de
los existentes con el fin de conseguir nuestros objetivos particulares. En un
principio, se diseñó y simuló los distintos dispositivos ópticos de manera que se
obtuvo un conjunto de posibles dimensiones y configuraciones. Después se
integraron el mayor número de estos dispositivos en una máscara de cromo
para fotolitografía. Esta máscara se usó para fabricar guías de onda en fotoresina
SU-8 sobre un sustrato de silicio. Se obtuvieron buenos resultados en la
fabricación de las mimas, siendo capaces de reducir el espesor de las guías de
onda hasta los 0.5 µm y el ancho hasta los 1.5 µm. Los chips finalizados se
caracterizaron mediante dos fuentes de luz láser distintas y se demostró el
correcto guiado de la luz en su interior así como la conmutación de las salidas.
1 Introduction
1.1 Introduction to Optical Waveguides
An Optical Waveguide is defined as any structure able to confine light from one point to another and preserve desirable properties along the propagation way. It is important to note that we refer not only to the light that is visible by humans but also a wider range of the spectrum including infrared and ultraviolet wavelengths. The basic structure in photonic integrated circuits is the planar optical waveguide and this is the reason why we focused this introductory discussion in this particularly geometry. To better understand how light remains inside these guides some physical properties must be explained.
1.1.1 Reflection and Refraction
Let us consider a monochromatic light (single wavelength) that impinges onto a plane boundary surface between two media. While one part of this light is reflected, the other is refracted into the second medium. If we assume this media have different permeability and permittivity, the velocities of the light waves will be different in each medium. These velocities are directly related to the refractive indices and the incident angle and the refraction angle by Snell’s Law of Refraction. The reflection angle is always equal to the incident angle [1][2].
This can be written in terms of the refractive index i.e. the ratio between the velocity of light in vacuum and the velocity of light in a particular medium.
v
2=
1
μ ε
n=
c
v
sin
θ
1sin
θ
2=
v
1v
2n
1sin
θ
1=n
2sin
θ
2If the incident light originates in a higher refractive index media at a certain angle greater than a critical angle, all the light is reflected back into the incident medium. This optical phenomenon is known as total internal reflection (TIR). To calculate the critical angle the refractive angle must be parallel to the interface, then:
sinθ2=1
θ
c=
arcsin
(
n
2n
1)
Once we assume light can be totally reflected into the desired medium we can place two interfaces symmetrically along the propagation axis thus we finally get a three layer structure or slabs (core and two claddings) within which light is indefinitely bounced. This phenomenon can also be achieved by rotating the simple structure around a revolution axis placed at the edge of the core getting a circular waveguide as a result. These waveguides are commonly known as optical fibers and despite they have been widely used in communications industries, they are not suitable for integrated circuits manufacturing. This is the reason why this work focuses on the first one.
1.1.2 Planar Optical Waveguide
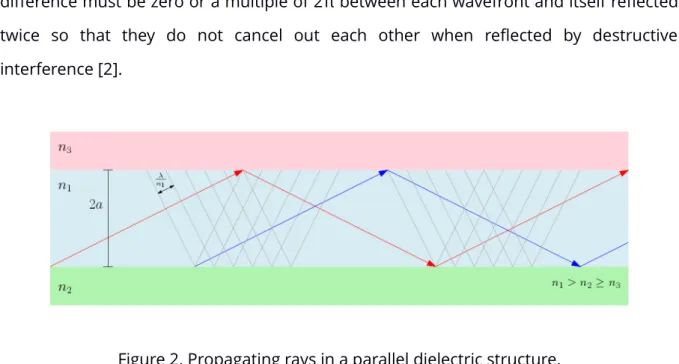
As we have seen, the internal angle of incidence must not exceed the acceptance angle in order to achieve TIR but also must fulfill the phase-matching criterion. Phase difference must be zero or a multiple of 2π between each wavefront and itself reflected twice so that they do not cancel out each other when reflected by destructive interference [2].
Figure 2. Propagating rays in a parallel dielectric structure.
Each angle complying with this rule is defining a certain propagation mode so the total possible modes are discrete since possible angles are discrete. The mode that has the minimum angle is called fundamental mode. Larger angles allow higher order modes that are able to propagate or not depending on the refractive indexes, layers geometry and light wavelength. Normalized frequency ν was defined so that waveguides could be treated irrespective of their structure. When ν < π (m=1) only the fundamental mode travels along the guide while the other higher-order modes are cut off and this is called single mode waveguides[3].
ν
=k n
1a
√
2
Δn v
=
2
π d
λ
√
n
12
− n
2 2λ
c=
2
π
ν
Ca n
1√
2
Δ n
Depending on the input light frequency, some modes propagate while others not. That means some of them confine most of power inside the core while others spread it through the cladding. Actually note that even in guided modes some light leaks out the interface between media, as shown in the figure below. This leaking field is known as
evanescent wave [1], and even though it decreases exponentially very quickly with distance away from boundary, it could be crucial in integrated circuits because of other surrounding structures are very close.
Figure 4. Evanescent field in a slab waveguide [3].
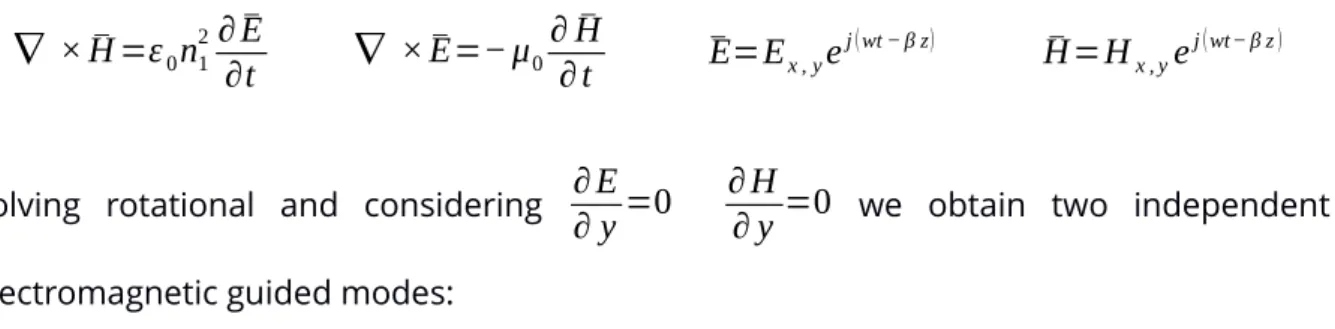
1.1.3 Guided Modes
∇
×
H
¯
=ε
0n
1 2∂
E
¯
∂t
∇
×
E=− μ
¯
0∂
H
¯
∂ t
¯
E=
E
x , ye
j(wt − β z)H
¯
=H
x , ye
j(wt− β z)Solving rotational and considering
∂ E
∂ y
=
0
∂ H
∂ y
=
0
we obtain two independentelectromagnetic guided modes:
TE Mode (Transverse Electric), since the electric field lies in the plane that is perpendicular to the propagation direction.
∂
2E
y∂ x
2+
(
k
2
n
2− β
2)
E
y
=
0
H
x=−
β
ωμ
0Ey
Hz= jωμ0
∂ Ey
∂ x Ex=Ez=Hy=0
TM Mode (Transverse Magnetic), since the magnetic field lies in the plane that is perpendicular to the propagation direction.
∂
2H
y∂ x
2+
(
k
2
n
2− β
2)
H
y
=
0
E
x=
β
ω ε
0n
2Hy
E
z=
− j
ω ε
0n
2∂ H
y∂ x
Hx=Hz=Ey=0Although many analytical and numerical techniques, such as the perturbation method analysis, have being stated for three-dimensional rectangular waveguides modeling, most of them are not reliable when non-linear behaviors exist. A common solution called the beam propagation method (BMP) consist on reducing the space under study until the fields in it could be approximated as a scalar wave and then solve the field distribution in slices along the propagation direction.
1.2 Optical Integrated Devices
In this section the operating principles of several optical devices are presented. These were chosen because industry has already produced reliable optical switches and combiners in different settings. Moreover, all of them can be manufactured by silicon layer build-up protocols with common optoelectronic fabrication equipment in a clean room. The aim of this work is to test them under new conditions and, if good results are obtained, integrate them in more complex circuitry structures.
1.2.1 Directional Coupler
This device is composed of two single-mode waveguides placed close to each other. When the distance between them is small enough, light propagating through one of them is coupled into the other due to the evanescent field excitation. It should be noticed that mode coupling occurs not only in the straight region but also in the curved region. Therefore, the coupling length is an effective straight coupling length that includes the entire mode-coupling effect in the straight and curved coupling regions [2].
L
e=
L
s+
2
R
cos
−1(
1
−
d
c− d
2
R+
w
)
Le: effective coupling length
Ls: straight coupler length
R: bend radius
d: gap between waveguides
dc: gap between waveguides where light starts to couple in the bent region
When the two waveguides are supposed to be identical all the light is transferred after some propagation distance called coupling length Lc. At twice this coupling length, the power is coupled back to the original waveguide by the same process. Thus, the optical power can be transferred periodically from one waveguide to the other. This allows to reach any power ratio at the output by changing lights propagation properties across the coupling region and[5][6].
Figure 7. Periodic coupling when L increases.
The mode analysis of the two waveguides cannot be considered single-mode anymore because this geometry has its own set of propagation modes. It is usually solved by a superposition of two (even and odd) fundamental modes of the individual waveguides, each with its own propagation constant. Then the power exchange is defined by the coupling constant K that depends on the waveguide geometry, distance between the two waveguides and the effective coupling length [2].
L
b=
π
β
even− β
oddK=
sin
2
(
π
1.2.2 Multimode Interference (MMI) Devices
This device uses the interference of normal modes so that input field is reproduced in single or multiple images (self-imaging) [7] at periodic intervals along the propagation direction. Although two normal modes are sufficient to implement common switching elements, improvements are possible if higher-order modes are utilized[8].
Figure 8. Multimode Interferometer (1x1).
For a multimode waveguide with width W, thickness 2d and refractive index n, the propagation constants of the low-order normal modes can be approximated by
β
m=
√
(
2
π n
λ
)
2
−
(
(
m
+
1
)
π
W
)
2
being m the mode number
Then the propagation constant difference between the fundamental mode and other higher-order mode and the beat length of the two lowest modes can be expressed like:
β
0− β
m=
π λ
4
nW
2m
(
m+
2
)
β
0− β
1=
3
4
π λ
4
nW
2L
π=
π
β
0− β
1=
Single-mode waveguides are connected to the multimode waveguide acting as inputs and outputs and two different configurations can be depicted according to the input position [6][7]:
Symmetric interference 1xN MMI Paired interference 2xN MMI
A single input is centered in x = 0 and only even modes are excited (c = 0 for v = 1,3,5,…)
Input can be positioned either in x=W/6 or x =-W/6. Some modes are excited (c = 0 for v = 2,5,8,…)
N self-images are generated at
distances:
L=
3
4
p L
πN
N self-images are generated at
distances:
L=
p L
πN
1.2.3 Mach-Zehnder Interferometer
This device could be considered as two coupling structures connected by two single-mode waveguides with a phase-shift interference area between them. Light beam is split by the first coupling structure into two separated branches that must not interact between each other until they are combined again by the second coupling structure. The typical power division ratio used in both coupling structures is 3 dB.
Figure 9. Schematic top-view of a Mach-Zehnder interferometer.
If these two branches are identical, the input power must be halved in each output waveguide. Since these branches are designed in order to cause intentionally a relative phase shift between fields that travels through them, the combined power in the second coupler is modulated and hence the output power ratio changes [5].
Δ ϕ=
2
π
λ
effd
P
out=P
i(
1
+
cos
(
Δϕ
)
)
=P
i(
1
+
cos
(
2
π
λ
effd
)
)
It is seen that light can be switched from one port to the other by changing the phase shift ΔФ = Δ(d*n) from zero to π. This could be accomplished by enlarging the optical length d or using a different material with higher nef in the phase tuning region of one
of the two branches so the light propagates at different velocities in each one of them.
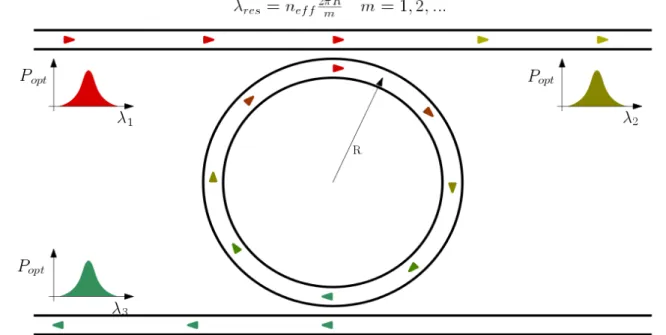
1.2.4 Ring Resonator
An optical ring resonator is a coupled structure in which one or more waveguides are closed on themselves forming a loop and others act as input or output ports. The light coming from the input waveguide can be transmitted inside the ring either by directional coupler through the evanescent field or by MMI couplers. Circulating light is constructively interfered inside the resonating cavity before coupled again into the output waveguide or into other resonators. The result is a filter in which light is amplified or neglected (notch filter) at some wavelength depending on the ring circumference length. This is because resonance only occurs when the optical path length of the ring is a whole number of times the coupled light wavelength[10].
Figure 10. Basic configuration of a single ring resonator structure.
1.3 Objectives
The main objectives of this work are listed below:
Preliminary study of the technologies used so far and its physical principles.
Virtual modeling simulation at desired wavelengths (543.5 nm and 632.8 nm) to obtain the correct dimensions of a prototype device.
Design and optimization of a chromium mask for lithography production which integrates the highest possible number of circuits.
Analysis of an appropriate manufacturing protocol for the simulated prototypes.
Experimental setup deployment for chip characterization and optical measurements and its subsequent optimization under real working conditions.
2 Manufacturing Procedure
In this chapter, the entire process followed to fabricate final working devices is sequentially described. Thus the reader can imagine the routine step by step in the same order it was made.
2.1 Simulation
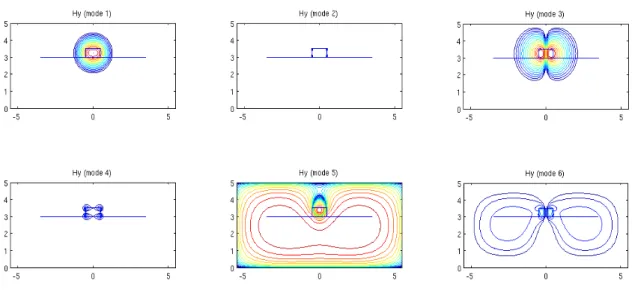
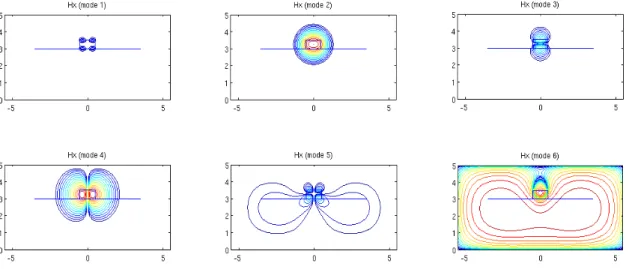
The first step consist on simulate how light propagates through the basic elements taking into account primarily the input light wavelength and the materials refractive indices as main variables. The first one depends on whether the laser we connect is red (632,8 nm) or green (543,5 nm). Then we need to look for the specific refractive index of the chosen materials, treated in a next chapter, since it has dependence relation with the light wavelength. Using 2D mode-solver code running in Matlab® a set of transverse core dimension was obtained. The height and width of the core must only allow a few number of modes to propagate but also be large enough so that the light is able to travel inside at this wavelengths. Best simulation results were obtained for a core width of one micron and height of half a micron at both wavelengths but other aspect ratio were simulated for futures essays.
It can be seen that only exist two guided modes (first and third) while the rest of modes leak the most of power out the core. The same analysis was applied to the magnetic field finding the same two guiding modes at different position (second and fourth). The reason is that magnetic field and electric field are conjugate so the odd electric modes are equivalent to the even magnetic modes and vice versa. Thus we are really analyzing the first three modes in a waveguide instead of six.
Figure 12. First six transverse magnetic modes in a ridge wg at 632,8 nm
These simulations were made for a ridge symmetric waveguide with a 3 micron substrate and a 1.5 micron cladding. Symmetric means that same material was chosen for both substrate and cladding but this is not compulsory, in fact many times air is the option elected in what are called uncovered guides.
Refractive index under green light (λ=543.5 nm)
Refractive index under red light (λ=632.8 nm) Cladding (1.5 micron) 1,46025 1,45078 Core (0.5 micron) 1,6 1,596 Substrate (3 micron) 1,46025 1,45078
To better estimate and take into account more accurate analysis a 3D-physics modeling software COMSOL® was used. Then we realized that small length adjustments should be made in order to fit the good coupling in all our models. Simulation models are shown when equal power distribution at the output is desired.
Figure 13. MMI 1 x 2 modeling simulated by COMSOL®.
d
2.2 Mask Design
The COMSOL® simulations results in several sets of dimensions for each configuration. Some of those combinations are presented:
Interference area width (µm)
MMI 1x2 length red light (µm)
MMI 2x2 length red light (µm)
MMI 1x2 length green light (µm)
MMI 2x2 length green light (µm)
8 84 112 97.5 129.9
10 129.6 173 150.5 200.7 12 184.9 246.8 215 286.8 16 324.9 433 378.7 504.9 20 504 672 588.2 784.4
Effective Coupling Length in Directional Couplers
WG width (µm) Red Light Green Light
dc=0.3 µm dc=0.6 µm dc=0.3 µm dc=0.6 µm
0.6 16 61.7 25.4 141.4
1 98 224.7 85.1 569.5
1.5 131 664.6 242.4 1752.6 2 277.6 1458.7 525 3917.6 *dc is the distance between the two coupling waveguides
Figure 15. First and second mask design in AutoCAD® desktop.
In the second design, chip size was reduced from 2 x 2 cm to 1 x 1 cm, increasing the total number of chips from 16 to 52 in a single mask. This time the mask was intended to be used over a circular silicon wafer so marks were employed at the edge facilitating the alignment process. Also cross-shape guides were located in every chip corner to improve the cutting. Since the number of chips was large, combining different sort of structures in the same chip was no longer needed, even replication of identical chips was performed.
After we decided the location of every device over the mask, we made data tables using Excel® for each particular model (MMI, Mach-Zehnder, Ring, Coupler, Taper) containing the vertex coordinates (x, y) of these figures so that we can later join them and create polygons. Not all these junction were straight lines so we had to carefully design curvatures in which light does not leak out the core. This phenomenon is characterized as bending losses and it occurs when the guide is bent in a small radius. Our curves has a minimum bend radius of 150 microns.
Figure 17. Bending Examples in different angles (90 and 30).
2.3 Materials
This section describes the properties of every material used in our optical devices fabrication, as well as the specific alterations we made to them.
2.3.1 Substrate 1: ITO Glass
Glass is a non-crystalline amorphous solid that is often transparent and has widespread practical, technological, and decorative usage in, for example, window panes, tableware, and optoelectronics. Scientifically, the term "glass" is often defined in a broader sense, encompassing every solid that possesses a solid non-crystalline (that is, amorphous) structure at the atomic scale and that shows a glass transition in the solid state phase transitions.
The glass employed in all the experimental samples and setups is the borosilicate glass Schott BK7, an extremely common crown glass, used in precision lenses. It contains about 10% boric oxide, has good optical and mechanical characteristics, and is resistant to chemical and environmental damage.
Some optical properties of BK-7 are shown:
Extinction coefficient k = 9.7525e-9 Refractive index: n = 1.5163 @ 600 nm
Relative permittivity ϵϵ' = 2.3007" = 2.9585e-8
Absorption
coefficient α = 0.00208 cm-1 Abbe number Vd = 64.17
Chromatic
dispersion dn/dλ = -0.041 µm-1 Group index ng = 1.5414
Group velocity dispersion
All the glasses used in the experimental are coated with ITO on one side as electrical contact. ITO is typically deposited as an oxygen saturated composition with a formulation of 74% In, 18% O2, and 8% Sn by weight [12]. ITO is one of the most widely used transparent conducting oxides because of its electrical conductivity and optical transparency, as well as the ease with which it can be deposited as a thin film. An advantage of ITO is that it can be precisely etched into fine patterns to make small electrodes [13][14].
2.3.2 Substrate 2: SiO
2Silicon dioxide, also known as silica, is a chemical compound, formed as an oxide of silicon that is most commonly found in nature as quartz. SiO2 has been in use by the microelectronic and optical industry and research laboratories for many decades because of its favorable physical and chemical characteristics.
Some optical properties of SiO2 are shown:
Extinction coefficient k = 0 Refractive index: n = 1.473 @ 600nm
Relative permittivity ϵϵ' = 2.1697" = 0
Absorption
coefficient α = 0 cm-1 Chromatic
dispersion dn/dλ = -0.029 µm-1
Group index ng = 1.4904
Group velocity dispersion
GVD = 51.37 fs2/mm D=-237.7 ps/(nm km)
2.3.3 Core: SU-8 and Cyclopentanone
SU-8 is a negative, epoxy based, photoresist designed for MEM’s and other microelectronic applications. When SU-8 is exposed to UV light its molecular chains cross-link, causing the SU-8 to harden. Its two more useful properties are its highly transparency in the visible range and its low viscosity allowing good adherence when spun over other solid surfaces[15]. After exposing and developing, highly cross-linked structure of SU-8 is stable towards chemicals and radiation damage. It has also been employed recently in high (below 500nm) resolution optical waveguide nanostructures [16].
SU-8 is composed of Bisphenol A Novolac epoxy that is dissolved in an organic solvent (which can be gamma-butyrolactone GBL or cyclopentanone CP, depending on the formulation) and up to 10% of mixed Triarysulfonium/Hexafluoroantiminate salt as the photoacid generator [17].
A thickness study is conducted and presented in the results chapter.
2.4 Chip Fabrication Process
In this section all the manufacturing protocols employed in this work are described. In some cases the materials supplier protocols have been modified in order to meet the needed requirements. Although two different substrates have been used, the photolithography procedure does not change.
2.4.1 Substrate Preparation
ITO Glass: only one protocol was performed and it is divided in two stages.
- Glass Cutting: bigger glass panels are cut into 9 x 9 cm pieces with a diamond cutter pen and a rule. During this step it is important to protect your eyes from little glass splinters and also try not to breathe in. The cut must be made over the glass side, facing ITO side down so that it will not be damaged.
- Glass Cleaning: if the glass piece are big, this step can be done by hand using distilled water and acetone. For smaller fragile pieces we use ultrasonic bath and heat during 15 minutes at 50º C, repeating this step twice. An additional bath with distilled water to rinse the glasses is compulsory.
SiO2: two different protocols were considered for substrate preparation as well as
coating deposition after photolithography ending[18].
- Evaporation: this method was applied over a glass substrate to deposit a thin SiO2 film. The system available in the clean room consists in a TELSTAR control
system that allows both manual and automatic modes and an e-beam evaporation machine. The pressure of vacuum chamber, voltage, current, beam position, frequency and amplitude can be fixed by this system. Through increasing the current intensity we can accelerate the coating deposition. The instrument features an electron gun hitting the material causing its evaporation. Then, the molecules or atoms of material deposit on the substrate through condensation [19]. The coating thickness ranges from tens of nanometers to a few microns, depending on evaporation speed and duration. There are two pressure sensors in the vacuum chamber: one is sensitive to pressure higher than 10-4, the other is sensitive to pressure lower than 10-4, so they are used
the evaporation. We realized this technique is not useful for coating thickness larger than one micron because of material cracking if a very slow evaporation speed is not applied.
- Sputtering: we employed this procedure with the same purpose of depositing a thin SiO2 film, but using silicon wafer as a substrate instead of glass. Thicker
stable layers (3 micron and larger) can be accomplished as well as purer coating. Its operating principle is based on the acceleration of ions of gaseous argon plasma that impact on a source material (silicon in our case), called “target”. This material is eroded by this ions bombardment and its particles (either individual atoms, cluster of atoms or molecules) are ejected in all directions until they collide with the substrate sample [20][21].
2.4.2 Spinning
2.4.3 Mask aligning
This stage consist on isolating the photoresist under a direct 400W UV light during 120 seconds exposure. The mask must provide precise shadow to the regions we are not interested in isolate so hard contact between the mask and the substrate is highly advisable. It is important to remember that the photoresist is sensible to UV light in any moment so prevent the samples from natural light before this stage to avoid unexpected isolation is critical.
Figure 19. UV light isolation diagram [22].
2.4.4 Photo-resist Removal
Developing time was rigorously controlled since it is a very sensible parameter for the final result. Otherwise none or both the exposed area and the unexposed area would be removed. In the first row, two pictures obtained when timing is not long enough are shown. It can be noticed that the unexposed SU-8 was not completely removed. On the other hand, the second row pictures show that the photoresist is not hard enough so it breaks or slide, due to an excessive timing:
3 Experimental Setup
Once the fabrication process is finished, chips that are in best condition are picked, seeing their surface through a microscope and avoiding any imperfection or dirt. They are then characterized one by one in a dark room with the suitable instrumentation.
Figure 20. Final chips on glass and silicon substrate. Size changes can be observed.
3.1 Dark Room Equipment
All the setup in the dark room, is situated on an optical table in order to prevent from vibrations and also to keep aligned the optical elements over time. A base of aluminum was designed to elevate the microscope objective and align it to the chip ports and the rest of the setup.
3.1.1 He-Ne Laser
3.1.2 Micro- and Nano-positioner
After we find the focal point of the laser beam, where the light is most concentrated, we have to align our chip to it. These movement is highly accurate so not only micropositioners but also nanopositioners are needed. As the height of the waveguides is half a micron, light variations make the difference between light coupling inside to core or not. A Thorlabs® NanoMax 300 flexure stage is used for 3-axis positioning. It provides 4 mm of coarse travel in a Vernier scale of 10 µm accuracy and 300 µm of fine travel in a Vernier scale of 1 µm accuracy. This resolution and travel range make the stages ideal for optimizing the coupling efficiency into a fiber alignment or waveguide system. The resolution also allows for a clear reference point for absolute positioning within a system. A Newport RSX-2 rotation stage is available to adjust the acceptance angle and thus make the incoming light beam parallel to the waveguides. Besides, a 3-axis piezoelectric controller offered by Thorlabs® is connected to the nanopositioner that ranges 5 µm in repeatable movements of 20 nm.
3.1.3 Digital Microscope
Figure 21. Dark room equipment assembly for the chip characterization.
3.2 Characterization Method
The lasers were utilized as input source of our photonic circuits, pointing the laser beam, previously focused in a microscope objective, to the waveguide taper, which is a spot of about 5x10⁻⁷mm2. The first step for measuring is to align the light source to the edge of
4 Results
The results obtained in this work can be divided in fabrication results and characterization results.
4.1 Fabrication Results
The first objective was to decrease the thickness of the SU-8 layer. This can be made by either changing the solvent composition and concentration, so that the viscosity of SU-8 can be tuned, or increasing the deposition spinning speed. Based on this, a thickness study was conducted over the original SU-8 available, MicroChem® SU-8 2001, designed for 1 micron thickness[24].
It is noted that although the film thickness is reduced when the spinning speed increases, the total variation is not significant. These is because the viscosity of this product is designed to achieve 1µm deposition in a wide range of conditions including the spinning speed. The solution is to dissolve SU-8 in its own solvent so that the viscosity of the total mixture decreases.
Figure 23. Thickness study of the CP concentration impact when 3000rpm is fixed.
The second important objective was to ensure a sufficient aspect ratio of the fabricated devices. If all the manufacturing protocol was conducted in a proper way, 1.5µm wide waveguides can be achieved. In the figure below a 2µm waveguide observed through a microscope with a 2µm minimum scale is shown.
Figure 24. Waveguide of 2µm width in an optical microscope.
In the figures below we note that the resolution was not high enough. The gap between the ring resonator and the waveguide is 300nm and the space between the two output of the MMI is 1µm.
4.2 Characterization Results
The figures below show a straight waveguide input that is divided into two straight outputs by a MMI 1 x 2 and both green and red light is coupled. A clear two light spots can be recognized which means light is successfully guided along the chip. It can also be observed that light intensity in each output is not equal, as expected, but this fact can be solved by carefully adjusting the nanopositioners to optimize the input spot position. Since this spot is so small, temperature variation can induce the misalignment between the source beam and the input port and hence modify the result seen within a couple of minutes so a temperature stabilizer should be considered in the future. There are also some device dimensions, such as the MMI length or the directional couplers gap, that are very sensitive to the thermal variations because of its expansion or contraction cause a shift in the output power ratio.
Since we observed that temperature can modify the optical properties of the chip, a heat source was applied to its surface to verify this phenomenon. Then we proved in a 1 x 2 MMI structure, that was first tuned to the equal output power state, that the light intensity ratio became more unequal over time until only one of the two outputs guided while the other vanished. The chip recovered its initial state some minutes after the heat source was removed.
5 Conclusions and Future Lines
In view of the work accomplished in this project and the results obtained, some conclusions can be drawn.
● Finite Elements Method analysis must be applied to better adjust the dimension
of an optical device previously calculated in a mode solver. Effective refractive indices have to be considered under the specific functioning conditions.
● SU-8 photoresist allows to thin a layer down to 300nm by increasing the spinning
speed as much as possible and working with high percentage of solvent. In this work the thinnest thickness was achieved when 3000rpm and 40% CP concentration was performed.
● Straight and clean waveguides of down to 1.5µm wide can be achieved with SU-8
photoresist. This work suggest that narrower waveguides could be fabricated if a higher resolution mask is used.
● Full fabrication process can be done within three to four ours when optimized. If
the substrate is already prepared, the photolithography process takes around 40 minutes.
● Sputtering has proved to be much more useful than evaporation when more than
0.5µm SiO2 deposition is needed. Both methods last longer than any other stage in
the manufacturing protocol so scheduling correctly saves time in the full process.
● Regarding to the two different substrates utilized, good fabrication results were
obtained in both of them after optimizing the original protocol to each one.
● Light guiding has been successfully demonstrated and the coupling ratio at the
This project opens the possibility of improvement and additional applications can be study in future projects.
● Regarding to the optical switching, the study of a new electric conductor layer
placed over the waveguide cladding can be done. So these electrodes can be controlled to change the optical properties of the integrated devices and thus the coupling or modeinterferance. Liquid crystals can be employed in these new designs to study how they disturb the light traveling through the core.
● The devices designed in this work are likely to be used in chemical and biological
References
1. K. Okamoto,
Fundamentals of Optical Waveguides
, 2nd ed. (Elsevier 2006).
2. D. Marcuse,
Theory of Dielectric Optical Waveguides
, 2nd ed. (AT&T Bell
Laboratories 1991).
3. B.E.A. Saleh, M.C. Teich,
Fundamentals of Photonics
, 2nd ed. (J. Wiley & Sons
2007).
4. M.L. Calvo, V. Lakshminarayanan,
Optical Waveguides: From Theory to Applied
Technologies
, (Taylor & Francis 2007).
5. T.S. El-Bawab,
Optical Switching
, (Springer 2006).
6. J. M. Liu,
Photonic Devices
, (Cambridge 2009).
7. L.B. Soldano, E.C.M. Pennings,
Optical Multi-Mode Interference Devices Based on
Self-Imaging: Principles and Applications
, (Journal of Lightwave Technology 1995).
8. F. Guo, D. Lu, R. Zhang,
A Two-Mode Multiplexer Based On Multimode
Interferometer Coupler and Y-Junction on InP Substrate
, (IEEE Photonics Journal
2016).
9. S. Dante, D. Duval, A.B. González,
Towards a complete Lab-On-Chip system using
integrated Mach-Zehnder Interferometer
, (Óptica pura y aplicada, Sedoptica 2011).
10. D. G. Rabus,
Integrated Ring Resonators
, (Springer 2007).
11. W. Bogaerts, P. de Heyn, T. van Vaerenbergh,
Silicon Microring Resonators
, (Laser
Photonics Rev. 2012).
12. D. Ginley, H. Hosono, D. Paine, Handbook of Transparent Conductors, (Springer
2011).
13. S.Islam, G. Saklayen, F. Rahman,
Investigation on the Optical, Electrical and
Structural Properties of ITO on Glass Substrate
, (International Journal of Scientific &
Technology Research 2014).
14. J.M. Park, Z.J. Wang, D.J. Kwon,
Optoelectronic and Interfacial Properties of ITO on
Borosilicate Glass and PET Substrates with Nano- and Hetero-structural Aspects
,
(The Materials Research Society 2010).
16. S. Ghosh, G.K. Ananthasuresh,
Single-photon-multi-layer-interference lithography for
high-aspect-ratio and three-dimensional SU-8 micro-/nanostructures
, (Nature 2015).
17.
R. White, SU-8 Photoresist Processingh ttp://engineering.tufts.edu/microfab/documents/SOP_SU-8Processing.pdf
18.
The Photoresist Process and its Application to the Semiconductor Industryhttp://wwwcourses.sens.buffalo.edu/ce435/Polymers/Photoresist
19.
Microchem company, Propylene Glycol Monomethyl Ether Acetate,http://www.sigmaaldrich.com/catalog/product/sial/484431?lang=es®ion=ES
![Figure 4. Evanescent field in a slab waveguide [3].](https://thumb-us.123doks.com/thumbv2/123dok_es/6857597.838341/14.892.251.695.395.638/figure-evanescent-field-slab-waveguide.webp)