Several studies in the context of the fi ve-factor model of personality (FFM) have shown that personality changes across the life course. Although these changes take place at different rates, they start in infancy, continue in old age and can have different effects according to sex (McCrae, Martin, & Costa, 2005; Roberts & Mroczek, 2008; Roberts, Walton, & Viechtbauer, 2006; Soto, John, Gosling, & Potter, 2011; Srivastava, John, Gosling, & Potter, 2003; Terracciano, McCrae, Brant, & Costa, 2005). In summary, these studies have mainly reported age-related decreases in Neuroticism and age-related increases in Agreeableness from early adulthood to old age. In the Big Five domains, some of these effects are overall effects while others are specifi c facets of the domain (Soto et al., 2011; Terraciano et al., 2005).
Although these changes have been interpreted in terms of better emotional regulation and increased maturity, Soubelet and Salthouse (2011) recently proposed that they may refl ect the effects of age-related changes in social desirability (SD) on certain personality dimensions, because they rely on self-reported data.
The effects of age-related changes in social desirability have often been reported, and it seems that there is a tendency among elderly people to present themselves favourably, in such a way that they have higher scores on SD than young and middle-aged adults (Dijkstra, Smit, & Comijs, 2001; Ray, 1988; Stoeber, 2001). These effects also seem to be of a considerable magnitude. For instance, Stöber (2001) reported that the scores of his Social Desirability Scale-17 and the Marlow-Crowne Desirability Scale (MCDS; Crowne & Marlow, 1960) increased from 18 to 89 years old, showing differences between the older and younger groups of 1.75 standard deviations.
In order to analyse the possible effects of these age-associated SD changes on age-personality relationships, Soubelet and Salthouse (2011) administered the 50-item version of the International
ISSN 0214 - 9915 CODEN PSOTEG Copyright © 2013 Psicothema www.psicothema.com
How social desirability and acquiescence affect the age-personality
relationship
Andreu Vigil-Colet, Fabia Morales-Vives and Urbano Lorenzo-Seva
Universitat Rovira i Virgili
Abstract
Background: Recent studies have suggested that the age-personality relationship may be partially explained by age-related changes in social desirability. In the present study, we analyze how age affects social desirability and acquiescence, and how they affect the age-personality relationship. Method: We used a specially designed personality test, which provides response bias and personality dimension scores independently of each other. We applied this test to a sample of 3773 individuals aged between 13 and 97 years old (49.69% female) and analyzed the effects of age, sex, and their interactions on response bias and personality dimensions. Results: Age affects social desirability and acquiescence, both of which increase with age, and this increase affects the age-personality relationship, especially for dimensions such as Agreeableness or Conscientiousness. Conclusions: The age-related differences found in self-reported personality measures might be partly attributable to age-related increases in response bias. Furthermore, the high scores of elderly people on response bias measures implies that the results of self-reports that do not incorporate any correction for response bias should be viewed with caution, especially when they are obtained in samples of people over 50 years old.
Keywords: Response bias, fi ve factor model, age.
Resumen
El efecto de la aquiescencia y la deseabilidad social en las relaciones personalidad-edad. Antecedentes: estudios recientes han sugerido que las relaciones entre la personalidad y la edad pueden explicarse parcialmente por incrementos en la deseabilidad social. En el presente estudio analizamos cómo la edad afecta a la deseabilidad social y la aquiescencia, y cómo el control de dichos efectos afecta a la relación entre personalidad y edad. Método: se aplicó un test de personalidad que proporciona puntuaciones independientes en sesgos y contenido a una muestra de 3.773 personas de edades comprendidas entre los 13 y 97 años, analizándose los efectos de la edad y el sexo sobre las dimensiones de personalidad en puntuaciones afectadas/no afectadas por sesgos de respuesta. Resultados: ambos sesgos de respuesta se incrementan con la edad, afectando dicho incremento a la relación entre personalidad y edad, especialmente para dimensiones como amabilidad y responsabilidad. Conclusiones: las relaciones entre edad y personalidad podrían atribuirse parcialmente a los aumentos en sesgos de respuesta relacionados con la edad. Las elevadas puntuaciones de deseabilidad y aquiescencia en la tercera edad implican que los resultados de autoinformes que no incorporan ninguna corrección de sesgos de respuesta deben considerarse con precaución, especialmente en muestras de personas mayores de 50 años.
Palabras clave: sesgos de respuesta, modelo cinco grandes, edad. Psicothema 2013, Vol. 25, No. 3, 342-348
doi: 10.7334/psicothema2012.297
Received: October 25, 2012 • Accepted: April 9, 2013 Corresponding author: Andreu Vigil-Colet Research Center for Behavior Assessment Universitat Rovira i Virgili
Personality Item Pool questionnaire (Goldberg, 1999) and the MCDS to a sample of 1195 adults ranging from 18 to 93 years old. They found that age was negatively related to Neuroticism and positively related to Consciousness and Agreeableness, but these relationships were reduced when SD was controlled and, in the case of Agreeableness, the relationship even disappeared. As a consequence, they concluded that some of these age-related differences in personality and other variables (they also found effects on affect measures) might be attributable to the age-related increases in SD. Soubelet and Salthouse (2011) pointed out that one of the limitations of this study was that it was based on the results obtained using one specifi c SD scale – the MCSD – and, as a consequence, their results may refl ect the effect on the MCSD of the age-related increases in maturity.
Furthermore, there are two main problems of controlling SD by simultaneously administrating an SD scale with the content measure of interest, and then using the SD scale to partial out the SD effects. Firstly, this procedure may remove meaningful variance from the relevant trait and reduce validity coeffi cients (Li & Bagger, 2006; Ones, Vieswesvaran, & Reiss, 1996). And secondly, it is assumed that all items are parallel measures of the trait of interest, which is almost never a true assumption (Leite & Cooper, 2010).
A different approach which may override the limitations of this method was proposed by Ferrando, Lorenzo-Seva, and Chico (2009). It was based on a procedure that can be used to simultaneously control response bias caused by SD and Acquiescence (AC), and which provides bias-free scores on the content variables of interest. That is to say, we can analyse the relationships between variables without having to partial because they are bias-free scores. To this end, the method fi rst identifi es a factor related to SD by using some items that are taken as markers of SD. The inter-marker correlation matrix is then analysed using factor analysis and the corresponding loading values are used to compute the loading values of the content items on the SD factor. The variance explained by the SD factor is then removed, obtaining an inter-item residual correlation matrix without SD effects.
The residual inter-item correlation matrix is now analyzed and the variance due to acquiescent responding is removed from the content items using the procedure developed by Lorenzo-Seva and Ferrando (2009). Once the factor related to AC is available, the variance explained by this factor is removed to obtain a residual inter-item correlation matrix that is free of SD and AC. Finally, a classical exploratory factor analysis is performed on this residual matrix to determine item loadings on content factors.
As a consequence, the application of this procedure at the item calibration level provides three loading estimates for each item: a loading on the content factor that the test intends to measure, and two loadings on two factors identifi ed as SD and AC. This allows individuals’ scores to be obtained free of response bias effects. It should be noted that these SD and AC factors are orthogonal to each other and to the content factors. The consequence of this orthogonality is that, instead of the problem described above when partialling methods are used, the removal of SD and AC bias does not affect the content factors’ valid variance. This method has shown that it is effective at developing new bias-free measures or computing new SD-free scores on previously existing tests (Morales-Vives, Camps, & Lorenzo-Seva, 2013; Vigil-Colet, Ruiz-Pamies, Anguiano-Carrasco, & Lorenzo-Seva, 2012). It has also recently been used by Vigil-Colet, Morales-Vives, Camps,
Tous, and Lorenzo-Seva (2013) to develop a personality test based on the FFM, which provides SD-and AC-free scores for the fi ve FFM domains and for SD and AC.
As far as AC is concerned, it should be noted that SD is not the only response bias that shows age-related changes. Although there is less research on the effects of age on AC, it seems that adolescents and elderly people show higher levels of AC than young and middle-aged adults, and adolescents also show greater variability in AC (Meisenberg & Williams, 2008; Soto, John, Gosling, & Potter, 2008).
Taking all this into account the present study has two main purposes. First we shall analyse the effects of age on SD and AC, to determine if this response bias increases with age. Secondly, we will try to replicate the fi ndings described by Salthouse and Soubelet (2011), who propose that the personality-age relationship found in some dimensions of personality may be partially explained by the effects of age-related changes on response bias. To do this we will use the method described above to study the effects of ageing on personality dimension scores with and without response bias correction.
Furthermore, taking into account that studies such as the one by Soto et al. (2011) have proposed that men and women may show different patterns of age-related personality changes, we will also attempt to determine whether the effects of response bias on the age-personality relationships are equivalent for men and women.
Method
Participants
The sample consisted of 3,773 adults, 49.69% female, ranging from 13 to 95 years of age (M = 32.28, SD =15.32). A total of 39.5% of the sample were high school and university students, 35.3% were in work and 25.2% were unemployed/retired. The distribution of ages, sex and academic level is summarized in Table 1.
Instruments
The participants completed the Overall Personality Assessment Scales (OPERAS; Vigil-Colet et al. 2013). This test used the method developed by Ferrando et al. (2009) and gives SD- and AC-free scores with good reliability and temporal stability for the factors Extraversion (EX), Emotional Stability (ES), Conscientiousness
Table 1
Number of participants tabulated for age, sex and academic level
Sex Academic level
Age group Women Men Elementary Medium Higher
13-18 461 303 003 669 088
19-29 725 484 127 415 667
30-40 238 501 142 302 295
41-51 240 376 186 259 171
52-62 114 107 089 071 061
(CO), Agreeableness (AG) and Openness to experience (OE) plus SD and AC scores for each individual. It also has good convergent validity with such other widely used personality measures. In the sample used for the present research the factor reliabilities for the
fi ve factors when response biases were removed were: θxx=.88, θxx=.85, θxx=.77, θxx=.71 and θxx=.80. When response biases were not removed, they were θxx=.84, θxx=.91, θxx=.77, θxx=.76 and θxx=.78.
The participants who were more than 60 years old were also tested with the Mini-Mental State Examination (MMSE; Folstein, Folstein & McHugh, 1975). We only administered the personality tests to individuals with scores higher than 23 in the Spanish version of the MMSE (Lobo et al., 1999).
Procedure
Various strategies were used to collect the sample: the test was administered to (a) groups of adolescents in their classroom or during university open-day activities; (b) students at university in their classrooms; (c) workers of different companies; (d) participants during academic university activities for graduates/ adults; and (e) elderly people in their nursing homes and specially-designed university courses.
Data analysis
In order to analyse the effects of age and sex, and their interactions on SD, AC and content scores, we performed multivariate analyses of variance (MANOVA) on the response bias and content factors using age (seven levels) and sex as factors. We also computed the factor scores on the content variables for the factor solution obtained before and after SD and AC effects had been removed. This procedure makes it possible to compare the effects of age and sex on corrected and uncorrected scores. In a second step we analyzed univariate effects of age and sex on all the dependent variables. This approach was preferred because when effect reaches signifi cance in a MANOVA, all the subsequent univariate tests are partially protected against the increase in experimentalwise error rate and no correction needs to be applied to the signifi cance level for the univariate tests. This is especially important when a high number of inference tests are performed at univariate level, which is our case because there are twelve factorial ANOVAs.
Results
The multivariate analysis of variance (MANOVA) of the effects of age group and sex on SD and AC showed that both age, F(12, 7518) = 53.8, p<.001, η2
p = .079, and sex, F(2, 3758) = 18.02, p<.001, η2
p = .009, and their interaction, F(12, 7518) = 8.01, p<.001, η2
p = .013, had signifi cant effects on SD and AC. Taking into account the extremely high statistical power of tests with big samples such the one reported in this study, it is particularly important to take into account measures of effect size when interpreting these results. In this regard, the effect size for interaction and especially for sex may be considered low or very low while only age seems to have a moderate effect on response bias.
With respect to personality dimensions the MANOVA showed age, F(30, 15022) = 11.49; p<.001; η2
p= .018, sex , F(5, 3755) = 16.82; p<.001; η2
p= .022 and age by sex, F(30, 15022) = 3.91;
p<.001; η2
p= .006, effects on them, with low to very low effect sizes. When the same MANOVA was performed on scores without bias correction the effects of sex, F(5, 3755) = 15.53; p<.001; η2
p= .020 and age-by-sex, F(30, 15022) = 4.64; p<.001; η2
p= .007, were almost equivalent, while age showed a greater effect size, F(30, 15022) = 23.63; p<.001; η2
p= .036, which indicates that a considerable amount of the variability in personality dimensions due to age seems to be related to age changes in response bias.
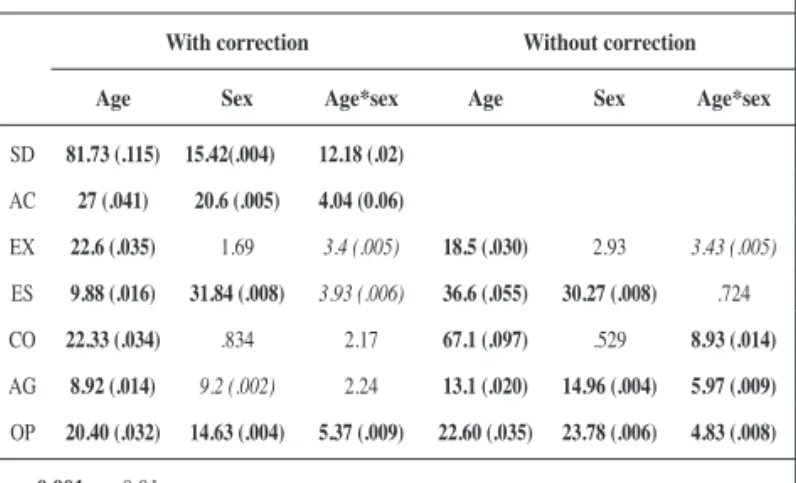
Table 2 shows the results at the univariate level. It should be pointed out that because of the high statistical power of ANOVA in a sample of thousands of individuals we have not taken into account the effects at an α= 0.05 because they are associated with almost negligible effect sizes. As far as the response bias is concerned, the effects of age, sex and their interaction were signifi cant for both SD and AC. Effect size measures showed that age effects are higher for SD than for AC which can be seen in fi gure 1. In the case of AC these increases are almost negligible until individuals are older than 40 years of age. Polynomic contrasts showed that the best fi t for SD was linear, F(1, 3766) = 224.2; p<.001, while for AC it was quadratic, F(1, 3766) = 113.73; p<.001 . As multivariate analysis showed, sex effects were small and, although women had higher SD and AC scores than men, the effect sizes were almost negligible (in the case of AC this was because of an increase in AC in the groups of older women.
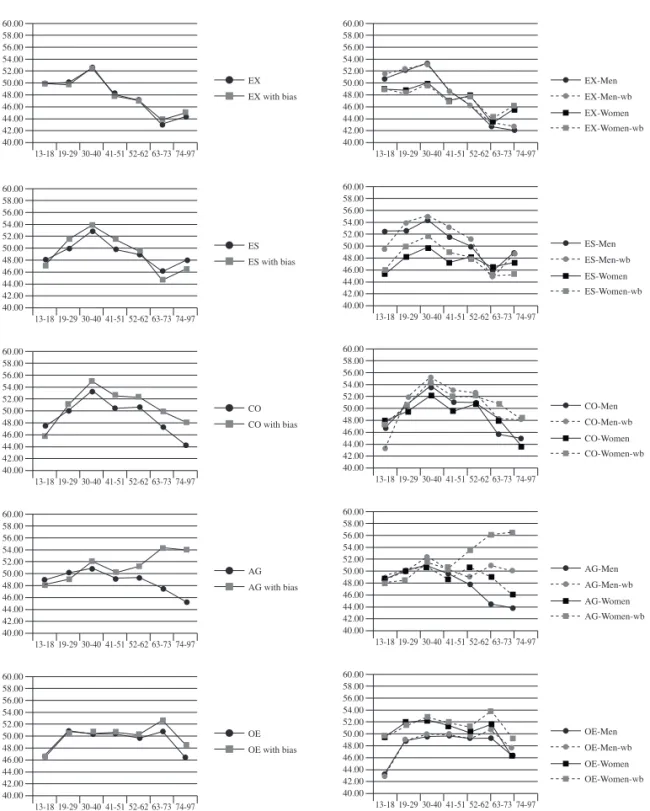
The univariate effects for EX showed that only age had any notable effect on extraversion scores. Figure 2 shows that this effect refl ects a tendency of extraversion to decrease with age for both corrected and uncorrected scores. Polynomic contrasts showed that this tendency was linear for scores with and without response bias, F (5, 3755) = 62.99 and F (5, 3755) = 79,33; p<.01. There is also an age-by-sex interaction which may indicate that men between 13 and 50 years old had higher levels of extraversion. Nevertheless, the effect size of this interaction was quite low.
The effects on ES scores with and without response bias were quite similar: in both cases ES increased with age, peaked at around 30-40 years old and subsequently decreased. Polynomic contrasts showed this quadratic tendency, F(5, 3755) = 63.47 and F(5, 3755) = 67.57; p<.01. It should be pointed out that age had greater effects on ES for uncorrected scores, which may indicate that response bias may be responsible for some of the age-related variability on ES. Sex also had signifi cant effects on ES, with men showing higher scores than women.
Table 2
F values and effect sizes (ηp
2) for univariate effects on scores with and without
removing SD and AC effects
With correction Without correction
Age Sex Age*sex Age Sex Age*sex
SD 81.73 (.115) 15.42(.004) 12.18 (.02)
AC 27 (.041) 20.6 (.005) 4.04 (0.06)
EX 22.6 (.035) 1.69 3.4 (.005) 18.5 (.030) 2.93 3.43 (.005)
ES 9.88 (.016) 31.84 (.008) 3.93 (.006) 36.6 (.055) 30.27 (.008) .724 CO 22.33 (.034) .834 2.17 67.1 (.097) .529 8.93 (.014)
AG 8.92 (.014) 9.2 (.002) 2.24 13.1 (.020) 14.96 (.004) 5.97 (.009)
OP 20.40 (.032) 14.63 (.004) 5.37 (.009) 22.60 (.035) 23.78 (.006) 4.83 (.008)
65.00 60.00 55.00 50.00 45.00 40.00
13-18 19-29 30-40 41-51 52-62 63-73 74-97
65.00 60.00 55.00 50.00 45.00 40.00
13-18 19-29 30-40 41-51 52-62 63-73 74-97
SD-All SD-Men SD-Women AC-All AC-Men AC-Women
Figure 1. Age changes in SD and AC for overall sample and for men and women
60.00 58.00 56.00 54.00 52.00 50.00 48.00 46.00 44.00 42.00 40.00
13-18 19-29 30-40 41-51 52-62 63-73 74-97
EX
EX with bias
60.00 58.00 56.00 54.00 52.00 50.00 48.00 46.00 44.00 42.00 40.00
13-18 19-29 30-40 41-51 52-62 63-73 74-97
EX-Men EX-Men-wb EX-Women EX-Women-wb 60.00 58.00 56.00 54.00 52.00 50.00 48.00 46.00 44.00 42.00 40.00
13-18 19-29 30-40 41-51 52-62 63-73 74-97
ES
ES with bias
60.00 58.00 56.00 54.00 52.00 50.00 48.00 46.00 44.00 42.00 40.00
13-18 19-29 30-40 41-51 52-62 63-73 74-97
ES-Men-wb ES-Men ES-Women ES-Women-wb 60.00 58.00 56.00 54.00 52.00 50.00 48.00 46.00 44.00 42.00 40.00
13-18 19-29 30-40 41-51 52-62 63-73 74-97
CO
CO with bias
60.00 58.00 56.00 54.00 52.00 50.00 48.00 46.00 44.00 42.00 40.00
13-18 19-29 30-40 41-51 52-62 63-73 74-97
CO-Men-wb CO-Men CO-Women CO-Women-wb 60.00 58.00 56.00 54.00 52.00 50.00 48.00 46.00 44.00 42.00 40.00
13-18 19-29 30-40 41-51 52-62 63-73 74-97
AG
AG with bias
60.00 58.00 56.00 54.00 52.00 50.00 48.00 46.00 44.00 42.00 40.00
13-18 19-29 30-40 41-51 52-62 63-73 74-97
AG-Men-wb AG-Men AG-Women AG-Women-wb 60.00 58.00 56.00 54.00 52.00 50.00 48.00 46.00 44.00 42.00 40.00
13-18 19-29 30-40 41-51 52-62 63-73 74-97
OE
OE with bias
60.00 58.00 56.00 54.00 52.00 50.00 48.00 46.00 44.00 42.00 40.00
13-18 19-29 30-40 41-51 52-62 63-73 74-97
OE-Men-wb OE-Men
OE-Women
OE-Women-wb
The effects of age on CO also seem to be moderated by response bias. In this case, after peaking at around 30 to 40 years old, CO decreases with age, but as fi gure 2 shows this decrease is greater for the scores without response bias than for the uncorrected scores. Polynomic contrasts again showed a quadratic tendency, F(5, 3755) =113.6 and F(5, 3755) = 79; p<.01. Sex did not have a signifi cant effect on CO and there was a sex-by-age interaction only for uncorrected scores, which may be due to the low scores of men in the adolescent group.
AG was the personality dimension whose relationship with age was most affected by the correction of response bias. As can be seen in table 2, age had effects on corrected and uncorrected scores, and both were linear, F(5, 3755) = 43.15 and F(5, 3755)= 21.2; p<.01, but, as fi gure 2 shows, when response bias was controlled AG tended to decrease with age. The trend for the uncorrected scores, however, was the opposite. As far as sex is concerned, women showed higher levels of AG than men but this effect was greater for uncorrected scores. There was also a signifi cant age-by-sex interaction for this score refl ecting that sex differences in AG are much greater in the older age groups.
Finally, OE also showed age effects for corrected and uncorrected scores. These relationships were quadratic, F(5, 3755)= 32,67 and F(5, 3755)= 21.3; p<.01. This relationship shows that OE was lower in adolescence and old age, and quite stable throughout adulthood. Sex also had effects on OE, with women having higher scores than men. The difference was greater in adolescence, which is refl ected in the signifi cant age-by-sex interaction.
Finally Table 3 shows the Pearson correlation coeffi cients between the response bias scores and the two scores for each personality dimension. As can be seen, the corrected scores are virtually independent of SD and AC whereas the uncorrected scores show different degrees of relationship with the response bias. In this regard, response bias explained a low-to-moderate percentage of score variance for dimensions such as EX and OP, but considerable amounts of variance for CO, ES and AG (as much as 50% of the variance of AG).
Discussion
The results discussed above showed that, as expected, SD and AC were affected by age and that both response biases shows a tendency to increase with age, especially after 50 years of age. Furthermore, results showed that SD is not the only response bias that needs to be taken into account in research on age-personality
relationships. Although SD is the response bias that is most related to dimensions such as CO, other dimensions such as EE are more affected by AC, while dimensions such as AG are affected by both.
Various explanations have been given for the increases in age-related response bias. Ray (1988), for example, proposed that old age is negatively stereotyped and, therefore, old people try to improve their image by presenting themselves in a favourable way. Stöber (2001), on the other hand, suggested that various values and norms may explain why older people show higher scores on SD. AC may be affected by cognitive skills and motivation, which may explain the lower levels founded in adolescents and the elderly (Krosnick, 1999). Finally, authors such as Krosnick (1999) and Stöber (2001) have proposed that personality dimensions such as AG or CO may be substantial parts of SD and/or AC.
This last explanation is important because, if this is the case, then the differences observed in the age-personality relationships may be due to the fact that when response bias is controlled, the procedure removes the content variance of such personality dimensions as AG or CO. In consequence, the changes observed in the personality-age relationships when response biases are controlled may refl ect a methodological artefact. Nevertheless, the procedure applied in the present research obtains content variable scores, which are orthogonal to SD and AC. This seems to suggest that the above explanation cannot account for the observed changes in the age-personality relationships after controlling response bias. Furthermore, Vigil et al. (2013) have presented evidence of the convergent validity of OPERAS with the BFI and FFPI with and without controlling response bias and, with the exception of CO for the BFI, no differences were found when the validity coeffi cients were compared. Thus, it seems that removing response bias does not have any great effect on the content variance of the personality dimensions. Nevertheless, the results reported above suggest that, under neutral conditions, SD measures refl ect a stable personality trait. Taking this into account, future research should analyse the nature of this trait and its relationships with personality dimensions.
Another important issue is the sex differences observed in response bias. Various studies have pointed out that sex differences in SD are negligible or are only related to the measurement of variables such as food intake or criminal behaviour (Herbert et al., 1997; Paulhus, 1994; Sutton & Farrall, 2005). As far as AC is concerned, the few studies that have found sex differences in it have also showed that the effect sizes are almost inexistent (i.e., Gilman et al., 2008). Nevertheless, most of the studies that have analyzed sex effects on response bias were performed with adolescent or middle-aged adults, while our results seem to show that when old people are taken into account, women tend to show higher levels on both SD and AC.
The changes in the age-personality relationships seem to go in a very similar direction to the ones reported by Soubelet and Salthouse (2011): that is, the relationship observed between age and certain personality dimensions may be partially explained by age-related changes in SD (and, in our case, in SD and AC).
In this regard, the relationship between age and AG was most affected when response bias was controlled. Various studies have shown a positive relationship between age and AG, especially after middle adulthood (Roberts et al., 2006; Srivastava et al., 2003). But in the study by Soubelet and Salthouse (2011), when SD was controlled, this positive relationship disappeared and, in our Table 3
Correlations between response bias and personality dimensions for uncorrected and corrected scores
Social desirability Acquiescence
Uncorrected Corrected Uncorrected Corrected
Extraversion -.074 -.032 -.179 .041
Emotional stability .233 -.031 -.519 .075
Conscientiousness -.469 -.012 -.183 .086
Agreeableness -.349 -.045 -.559 .072
Openness to exp. -.125 -.024 -.211 .029
case, when SD and AC were controlled, the relationship not only disappeared but even reversed its sign. Furthermore, the effect seems to be greater for women than for men, which may be due to women’s higher levels of SD and especially AC after they turn
fi fty.
In the case of CO, both corrected and uncorrected scores showed an increase until middle-age and a decrease thereafter. Nevertheless, it should be taken into account that this decrease was more pronounced when corrected scores were analysed, which shows that old people have lower CO levels than conventional self-reports refl ect.
The relationships between age and EX and OE were almost equivalent for corrected and uncorrected scores, and OE levels were higher only in the older groups for the uncorrected scores. These results are in the same line as the ones reported by Soubelet and Salthouse (2011) when they controlled SD effects.
The results obtained, especially for AG and CO, seem to show that old people are more irresponsible and less agreeable than previous results have shown. These results are coherent with the data recently reported by Morales-Vives and Vigil-Colet (2010, 2012), which show that for variables inversely related to AG and CO such as aggression and impulsivity, elderly people score the same as or more than adults.
It should be pointed out that if elderly people have the highest levels of SD and AC, then the results of self-reports that do not incorporate any correction for response bias should be viewed with caution. This point is particularly important if we take into
account that the population of developed countries is getting progressively older and, in consequence, there will be a greater need for psychological assessment specifi cally for this age group.
The present study also has some limitations. The fi rst is the classical problem of cross-sectional studies and the possible effects of different birth cohorts (i.e., different values which may affect SD and/or AC).
The second limitation is that the results reported above were obtained using a specifi c personality test which gives the overall scores of the FFM dimensions but not scores for specifi c facets. A glance at the studies that have analysed age-personality relationships using the FFM reveals that, despite the many similarities in the results, the particular test applied can lead to certain differences. Several studies have also shown that within the same dimension, the effects of age may depend upon the facet analysed (McCrae et al., 2005; Roberts et al., 2006; Soto et al., 2011). In consequence, further research is needed to generalize the results obtained with OPERAS to other tests, and to analyse the effects of controlling SD and AC on the relationships between age and the different facets of personality dimensions using techniques such as the one described above.
Acknowledgments
This research was supported by a grant from the Spanish Ministry of Economy and Competitivity (PSI2011-22683).
References
Crowne, D.P., & Marlowe, D. (1960). A new scale of social desirability independent of psychopathology. Journal of Consulting Psychology, 24, 349-354.
Dijkstra, W., Smit, J.H., & Comijs, H.C. (2001). Using social desirability scales in research among the elderly. Quality & Quantity 35, 107-115. Ferrando, P.J., Lorenzo-Seva, U., & Chico, E. (2009). A general
factor-analytic procedure for assessing response bias in questionnaire measures. Structural Equation Modeling,16, 364-381.
Folstein, M.F., Folstein, S.E., & McHugh, P.R. (1975). Mini-Mental State: A practical method for grading the cognitive state of patients for the clinician. Journal of Psychiatric Research, 12, 189-198.
Gilman, R., Huebner, E.S., Lili, T., Park, N., O’Byrne, J., Sverko, D., Schiff, M., & Langknecht, H. (2008). Cross-national adolescent multidimensional life satisfaction reports: Analyses of mean scores and response style differences. Journal of Youth and Adolescence, 37, 142-154.
Goldberg, L.R. (1999). A broad-bandwidth, public domain, personality inventory measuring the lower-level facets of several fi ve-factor models. In I. Mervielde, I. Deary, F. De Fruyt & F. Ostendorf (Eds.),
Personality psychology in Europe (Vol. 7, pp. 7-28). Tilburg, Tilburg
University Press.
Hebert, J.R., Ma, Y., Clemow, L., Ockene, I.S., Saperia, G., Stanek III, E.J., Merriam, P.A., & Ockene, J.K. (1997). Gender differences in social desirability and social approval bias in dietary self-report. American
Journal of Epidemiology, 146, 1046-1055.
Krosnick, K.A. (1999). Survey research. Annual Review of Psychology, 5,
537-567.
Lobo, P., Saz, P., Marcos, G., Día, J.L., de la Cámara, C., Ventura, T., Morales, F., Fernando, L., Montañes, J.A., & Aznar, S. (1999). Revalidation and norms of the mini-examen cognoscitivo in elderly people. Medicina Clínica, 112, 767-774.
Lorenzo-Seva, U., & Ferrando, P.J. (2009). Acquiescent responding in partially balanced multidimensional scales. British Journal of
Mathematical and Statistical Psychology, 62, 319-326.
Leite, W.L., & Cooper, L.A. (2010). Detecting social desirability bias using factor mixture models. Multivariate Behavioral Research, 45, 271-293. Li, A., & Bagger, J. (2006). Using the BIDR to distinguish the effects of
impression management and self-deception on the criterion validity of personality measures: A meta-analysis. International Journal of Selection & Assessment, 14, 131-141.
McCrae, R.R., Martin, T.A., & Costa, P.T., Jr. (2005). Age trends and age norms for the NEO Personality Inventory-3 in adolescents and adults.
Assessment, 12, 363-373.
Meisenberg, G., & Williams, A. (2008). Are acquiescent and extreme response styles related to low intelligence and education? Personality
and Individual Differences, 44, 1539-1550.
Morales-Vives, F., & Vigil-Colet, A. (2010). Are there sex differences in physical aggression in the elderly? Personality and Individual Differences,49, 659-662.
Morales-Vives, F., & Vigil-Colet, A. (2012). Are old people so gentle? Functional and dysfunctional impulsivity in the elderly. International Psychogeriatrics, 24, 465-471.
Morales-Vives, F., Camps, E., & Lorenzo-Seva, U. (2013). Development and validation of the Psychological Maturity Assessment Scale (PSYMAS).
European Journal of Psychological Assessment, 29, 12-18.
Ones, D.S., Vieswesvaran, C., & Reiss, A.D. (1996). Role of social desirability in personality testing for personnel selection: The red herring. Journal of Applied Psychology, 81, 660-679.
Paulhus, D.L. (1984). Two-component models of socially desirable responding. Journal of Personality and Social Psychology, 46, 598-609. Ray, J.J. (1988). Lie scales and the elderly. Personality and Individual
Differences, 9 , 417-418.
Roberts, B.W., & Mroczek, D. (2008). Personality trait change in adulthood.
Current Directions in Psychological Science, 17, 31-35.
Soto, C.J., John, O.P., Gosling, S.D., & Potter, J. (2008). The developmental psychometrics of Big Five self-reports: Acquiescence, factor structure, coherence, and differentiation from ages 10 to 20. Journal of Personality
and Social Psychology, 94, 718-737.
Soto, C.J., John, O.P., Gosling, S.D., & Potter, J. (2008). The developmental psychometrics of Big Five self-reports: Acquiescence, factor structure, coherence, and differentiation from ages 10 to 20. Journal ofPersonality
and Social Psychology, 94, 718-737.
Soto, C.J., John, O.P., Gosling, S.D., & Potter, J. (2011). Age differences in personality traits from 10 to 65: Big fi ve domains and facets in a large cross-sectional sample. Journal of Personality and Social Psychology, 10, 330-348.
Soubelet, A., & Salthouse, T.A. (2011). Infl uence of social desirability on age differences in self-reports of mood an personality. Journal of Personality, 79, 741-762.
Srivastava, S., John, O.P., Gosling, S.D., & Potter, J. (2003). Development of personality in early and middle adulthood: Set like plaster or
persistent change? Journal of Personality and Social Psychology, 84,
1041-1053.
Stöber, J. (2001). The Social Desirability Scale-17 (SDS-17) Convergent Validity, Discriminant Validity, and Relationship with Age.European
Journal of Psychological Assessment, 17, 222-232.
Sutton, R.M., & Farrall, S. (2005). Gender, socially desirable responding and the fear of crime: Are women really more anxious about crime?
British Journal of Criminology, 45, 212-224.
Terracciano, A., McCrae, R.R., Brant, L.J., & Costa, P.T., Jr. (2005). Hierarchical linear modeling analyses of the NEO-PI-R scale in the Baltimore longitudinal study of aging. Psychology and Aging, 2, 493-506. Vigil-Colet, A., Morales-Vives, F., Camps, E., Tous, J., & Lorenzo-Seva,
U. (2013). Development and validation of the Overall Personality Assessment Scale (OPERAS). Psicothema, 25, 100-106.