Diffuse soil CO
2flux to assess the reliability of CO
2storage
in the Mazarrón-Cañuelas Tertiary Basin (Spain)
Julio Rodrigo-Naharro
a,*,Barbara Nisi
b,Orlando Vaselli
c,d,Matteo Lelli
b,Raul Saldaña
a,Carmen Clemente-Jul
e,Luis Pérez del Villar
aaCentrodeInvestigaciones Energéticas, MedioambientalesyTecnológicas (CIEMAT), Avda. Complutense 40, 28040 Madrid, Spain
bCNR-IGG Institute of Geosciences and Earth Resources, ViaG.Moruzzi1, 56124Pisa, Italy
eDepartment of Earth Sciences, University of Florence, ViaG.La Pira4,50121 Florence, Italy dCNR-IGG Institute ofGeosciences and Earth Resources, ViaG.LaPira 4,50121 Florence, Italy
eDepartment of Chemical Engineering and Fuels, ETS IngenierosdeMinas, Universidad PolitécnicadeMadrid, CjAlenza4,28003 Madrid, Spain
ABSTRACT
In the framework of a global investigation of the Spanish natural analogues of COz storage and leakage, four selected sites from the Mazarrón-Cañuelas Tertiary Basin (Murcia, Spain) were studied for comput-ing the diffuse soil COz flux, by uscomput-ing the accumulation chamber method. The Basin is characterized by the presence of a deep, saline, thermal (~47oC) COz-rich aquifer intersected by two deep geothermal exploration wells named "El Saladillo" (535 m) and "El Reventón" (710 m).
The COz flux data were processed by means of a graphical-statistical method, kriging estimation and sequential Caussian simulation algorithms. The results have allowed conduding that the Tertiary marly cap-rock of this COz-rich aquifer acts as a very effective sealing, preventing any COz leak from this natural COz storage site, being therefore an excellent scenario to guarantee, by analogy, the safety of a COz storage.
1. Introduetion
Carbon dioxide is a greenhouse gas (GHG) that naturally exists in the atmosphere. Anthropogenic activities, especially those re-lated to the power generation from fossil fuels, are causing the in-crease of this gas concentration in the atmosphere since the industrialisation era that began in the early XIX century [1],and it is predicted to increase further. Ihis phenomenon likely contrib-utes to the known and worldwide accepted climate change.
One of the most important options to reduce caz emissions to the atmosphere is the development of Carbon Capture and Storage technologies (CCS), which have been mainly deployed into large industrial emission sources, such as power and cement plants, refineries, steelworks and ceramic industries. Ihese technologies firstly involve the separation of the caz from the rest of the gases emitted by such emission sources. Later on, it is compressed to obtain a concentrated stream of caz. Finally, it is transported and injected into a suitable geological storage formation in a depth greater than 800 m, where caz reaches the supercritical state. Iherefore, the caz deep geological storage represents the last stage
*
Corresponding author. Te!.:+34 913466516;fax:+34913466542.E-mailaddress:[email protected](J.Rodrigo-Naharro).
of CCS technologies and, what is more important, the most interna-tionally accepted method for caz sequestration, in order to mini-mize the effects on the global climatology.
Among the possible deep geological storage formations, deep saline aquifers are apparently the most suitable options, particu-larly in those countries where other options, such as gas and oil de-pleted or quasí depleted reservoirs, as well as non-mining coal
seams, are not viable. In Spain, the estimated capacity of geological caz storage in deep saline aquifers is about 45,000 Mton, according to data from the EU GeoCapacity Project [2].
However, in order to provide robust predictions of the perfor-mance of caz disposal sites at the required timescale (>1000 a), the study of natural caz accumulation sites is required [3,4], since they are powerful tools to understand the long-term behaviour of the caz once injected into the suitable geological formation.
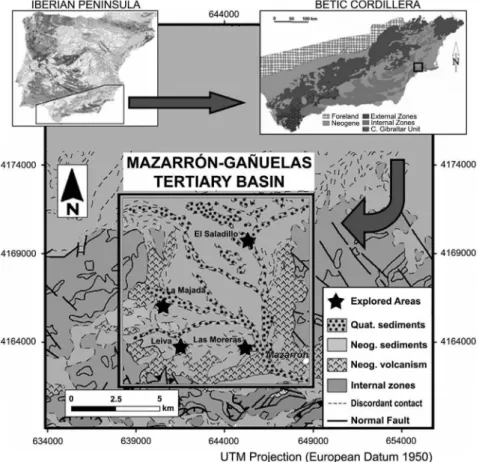
Fig. 2. Location map of the explored sites. Notice the high lineament intersection density existing in these sites.
m ~~~~~-o::::.¡:¡:
649000
I~1;:' 2.5
644000 649000
UTM Projection (European Datum 1950)
644000 639000
639000
Although investigations on natural COz-rich accumulation sys-tems are not yet sufficiently developed, some authors [6,7] have listed the existing COz natural reservoirs worldwide and the exper-imental reactions between COz and the storage formations [8]. Moreover, in the last decade several studies have focused their attention on the evaluation of the safety of a COz geological storage by investigating COz natural analogues [9-17].
In this respect, one of the most important aspects concerning the performance assessment of a deep COz geological repository in a deep saline aquifer is to increase the knowledge on the inter-action among COz and the storage and sealing formations, as well as the physico-mechanical resistance ofthe sealing formation. As a consequence, the measurements of the surticial COz leakage rates are an important tool to evaluate: (i) the efficiency of the afore-mentioned interaction pracesses; (ii) the capacity of the sealing geological formation for the retention of COz; and (iii) the possible effects of the COz released on the enviranment.
For these reasons, this work is focused on the retention capacity of the cap-rack by measuring the diffuse soil COz flux in a selected site, according to: (i) the presence of a deep COz-rich saline aquifer; (ii) the structural geological characteristics; and (iii) the nature of the cap-rack. Ihis site is located in the Mazarrón-Gañuelas Ier-tiary Basin, which it is in the southeast of the Iberian Peninsula, in-side the Internal Zones of the Betic Cordillera (Fig. 1).
Ihe deep COz-rich saline aquifer is hosted in an important mar-ble formation and discovered thraugh geothermal investigations carried out in the 19805 [18]. Ihe cap-rack is formed by Iertiary marls(>500m thick), that avoided the COz leakages until irrigation wells were drilled in the 19605. Ihe over-exploitation of the shal-lowest fresh aquifers caused their contamination by the deep-seated COz. In addition, COz might be released thraugh leakage paths represented by the main faults.
4174000
4169000
4164000
634000 639000 644000 649000 654000
UTM Projection (European Datum 1950)
El Saladillo
i
/.
" T
r
.,..-/ ~ . /""",.'
_..
-.'
+
-4.25 -3.75 -3.25 -2.75 -2.25 -1.75 -1.25-0.75 -0.25 0.25
In CO2Flux (mol m'2day")
10 15
51···
0 . 1 - , - '. . . ._
(b)
9998 95
~ 90
o
~
8070:c
60CIl 50
.o
~ 40
ll. 30
al 20
>
~ 10
'S 5
E
:::l
2
(.,)
1 0.5
~
...
Elté
c.E!o
-
"-ON
o'S
¡¿ 'S 8
Time (s)
Table 1
(a)
50 El Saladillo Location, number of diffuse cO2flux measurements and total explored surface.Explored surface (m2 )
45 Sites Measurements
El Saladillo 187 136000 40
Las Moreras 128 52,700 35
La Majada (1 & 2) 370 125,800
Leiva (1 & 2) 351 209,600 1Il 30
al
1Il 25
CIl
(.,)
20
Fig. 3. Schematic representation of the accumulation chamber method used in the measurements of the diffuse soil CO2flux, modified from [311.
Therefore, though
caz
was detected after drilling wells for irri-gation and geothermal purposes, the main objective of this work was the detection of the possiblecaz
leakages from the deep saline aquifer, in order to:(i) Determine whether the cap-rock (marly formation) is able to act as an effective and efficient geological sealing to
caz.
(ii) Extrapolate the results, by analogy, to predict the long-termbehaviour of the sealing materials of an artificial deep geological
caz
storage.-4.5 -4.0 -3.5 -3.0 -2.5 -2.0 -1.5 -1.0 -0.5 0.0 0.5
In CO2Flux (mol m'
2day")
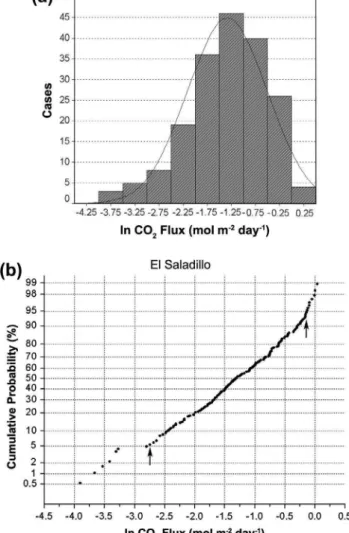
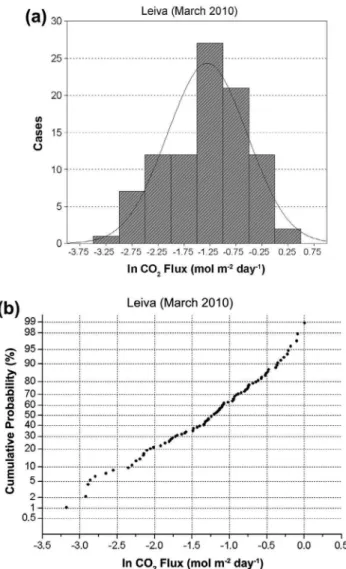
Fig. 4. Histogram (a) and probability plots (b) corresponding to InC02 flux,
expressed in mol m-2day-l, for El Saladillo site. Note the Gaussian distribution of
the measurements population. The inflection points are indicated byarrows.
2. Materials and methods
The diffuse soil
caz
flux was measured in sites previously se-lected according to their geological features, and particularly onthe basis of the density of the lineament intersections since they should likely correspond to preferential leakage paths for the deep-seated
caz
[19,20]. For this purpose, a lineament (probableTable 2
Basic descriptive statistical parameters obtained from CO2flux measurements, expressed in mol m-2day-l and g m-2day-l.
El Saladillo (Sept. 2009) Measurements Average Min Max Standard deviation CO2Flux (mol m-2day-l) 187 0.353 0.020 1.103 0.254
CO2Flux (g m-2day-l) 187 15.53 0.887 48.541 11.188
Las Moreras (September 2009)
CO2Flux (mol m-2day-l) 128 0.261 0.008 0.929 0.195
CO2Flux (g m-2day-l) 128 11.475 0.333 40.874 8.582
La Majada (September 2009)
CO2Flux (mol m-2day-l) 277 0.877 0.007 7.503 0.787
CO2Flux (g m-2day-l) 277 38.584 0.322 330.149 34.635
La Majada (March 2010) CO2Flux (mol
m-2day-l) 93 0.499 0.033 1.425 0.338
CO2Flux (g m-2day-l) 93 21.958 1.469 62.693 14.861
Leiva (September 2009)
CO2Flux (mol m-2day-l) 257 0.394 0.025 1.491 0.238
CO2Flux (g m-2day-l) 257 17.333 1.091 65.597 10.455
Leiva (March 2010)
CO2Flux (mol m-2day-l) 94 0.354 0.042 1.447 0.254
-5.5 -5.0 -4.5 -4.0 -3.5 -3.0 -2.5 -2.0 -1.5 -1.0 -0.5 0.0 0.5
In CO
2Flux (mol m-2day-1)
Fig. 5. Histogram (a) and probability plots (b) corresponding to InC02 Flux,
expressed in mol m-2day-l, for Las Moreras site. Note the Gaussian distribution of
the measurements population. The inflection points are indicated by arrows.
2
La Majada (Sept. 2009)
La Majada (Sept. 2009)
-4 -3 -2 -1 o
In CO2Flux (mol m-2day·1) -5
.
.lf
/
,
I,
1,
~/
.
.
¡'.
(a)
100 90 80 70 60 111 QI 111 50 Cll U 40 30 20 10(b)
99 98 ;? 95 ~ 90~
80:c
70 III 60 .Q o 50..
40 a. Gl 30 .~ 20 'l;j :i 10 E 5 :::l U 2 1 0.5indeed strongly affect the soil
caz
fluxes, since this gas is relatively soluble in water and, therefore, significantly affecting thecaz
flux measurements,caz
flux was performed by means of the accumulation chamber method[24-30],which is characterised by its sensitivity, low cost, fast and simple operability, Though this method was firstly used for agriculture purposes [27-30],in the last twenty years numer-ous studies focused on the diffusecaz
degassing in volcanic and geothermal environments were carried out[31-37],Furthermore, this methodology is also applicable for monitoring gas emissions from landfills[38,39],The equipment used is licensed by West Systems© Company and it includes: (i) an inverted chamber, with known dimensions, equipped with a system to mix the air in the chamber headspace; (ii) an Infra-Red (IR) Spectrophotometer, with a LICORLí-820 sen-sor, (iii) an Analogical-Digital (AD) converter; and (iv) a Palmtop Computer (PC) (Fig, 3), A magnesium perchlorate desiccant trap is inserted between the outlet fitting ofthe accumulation chamber and the inlet of the tube connected to the pump, in order to pre-vent damages to both the pump and the
caz
IR detector by soil humidity,oJ...,_.-,...'-r--...lilf?JJ!2iZ
-5.75 -4.75 -3.75 ·2.75 ·1.75 ·0.75 0.25 1.25 2.25
In CO2flux (mol m'2day·1)
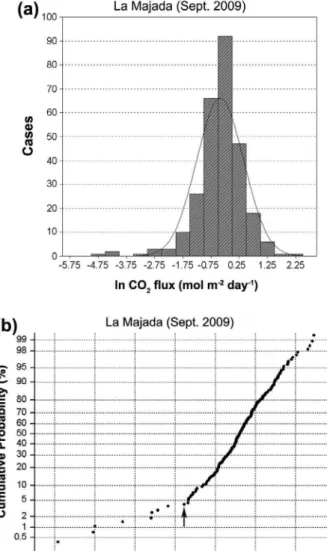
Fig. 6. Histogram (a) and probability plots (b) corresponding to InC02 flux,
expressed in mol m-2
day-" for La Majada site (September 2009). Note the Gaussian distribution of the measurements population. The inflection point is indicated by an arrow.
.
.-,.¡
1
I fr
.J..
.
'
.'
.
(a)
40 Las Moreras35 30 25
'"
Gl
'"
20- ..III U 15-10 5 o
-5.25 -4.25 -3.25 -2.25 -1.25 -0.25
In CO2Flux (mol m-2day-')
Las Moreras
(b)
99 98 ;? 95 ~ 90 >. :5 80:c
70 III 60 .Q o 50..
40 a. Gl 30 > 20 ~ III :i 10 E 5 :::l U 2 1 0.5fractures and/or faults) study on orthophotographs of the site (Spanish Aerial Orthophoto Programme) is shown in Fig, 2, The studied sites, the surface areas and the number of measurements are reported in Table 1. These sites were explored during Septem-ber2009and March2010,
Geologically, Las Moreras, La Majada and Leiva sites are approx-imately located on the contact between the Tertiary materials from the Mazarrón-Gañuelas Basin and the Triassic surrounding moun-tains, whilst El Saladillo site is on the North boundary of the Basin (see Fig, 2), In this site, a deep well (535m) was drilled during
1985 for geothermal exploration, which intersected a deep, high salinity (conductivity ~10mS cm-1
), thermal (~47OC) and
caz-rich aquifer. This aquifer is the only source of the free and dissolved
caz
in the aforementioned Tertiary Basin, According to the ,PC of the freecaz
from El Saladillo and El Reventón wells (-10,15and-0.38, respectively) and the R/Ra (0,71) values (where R is the measured 3Hej4He ratio and Ra is that of the air, Le, 1.39x 10⁻⁶),
the
caz
in this Tertiary Basin seems to be a mixture of: (i) acaz
from thermometamorphic processes affecting deep carbonate for-mations; (ii) biogeniccaz;
and (iii) a deep-seatedcaz
of likely mantle origin[21-23],Leiva (Sept. 2009)
(a)
10090 80 70
Ul 60 -_
... CI> Ul 50 ns
o
40 20 10 0L,...,~_-4.25-3.75 -3.25-2.75-2.25-1.75-1.25-0.75-0.250.25 0.75
In CO
2Flux (mol m·
2day·1) 5i··· J I/l Q)
:Q
15 O20 i··· ';'"
-4.25 -3.75 -3.25 -2.75 -2.25 -1.75 -1.25 -0.75 -0.25 0.25 0.75
In CO
2Flux (mol m-2day")
25
10
(a)
3 0 , - - - ,La Majada (March 2010)(b)
99 98 ~ 95 ~ 90~
80:c
70 III 60 .o O 50...
40 ll. GI 30 > 20 :¡¡ III 3 10 E 5 :::l O 2 1 0.5La Majada (March 2010)
..
I ,",,'
..
'
~,...
..
'.
.'
,." ~.,. ,
(b)
99 98 95 ~ 90 o~
80:c
70 III 60 .o 50 o...
40 ll. 30 GI > 20 :¡¡ III 10 3 E 5 :::l o 2 1 0.5Leiva (Sept. 2009)
, ,1
..
'"
J I J 1 .JI' . f ~,. ...r..
.
'Fig. 7. Histogram (a) and probability plots (b) corresponding to InC02 flux,
expressed in mol m-2day-l, for La Majada site (March 2010). Note the Gaussian
distribution of the measurements population. The inflection point is indicated by an arrow.
-3.5 -3.0 -2.5 -2.0 -1.5 -1.0 -0.5
In CO2Flux (mol m-2day-')
0.0 0.5
-4.0 -3.5 -3.0 -2.5 -2.0 -1.5 -1.0 -0.5 0.0 0.5
In CO2Flux (mol m' 2day")
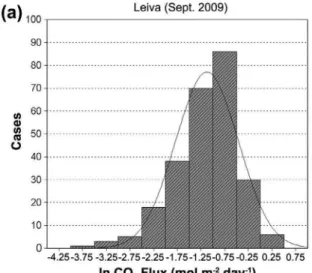
Fig. 8. Histogram (a) and probability plots (b) corresponding to InC02 flux,
expressed in mol m-2day-l, for Leiva site (September 2009). Note the Gaussian
distribution of the measurements population. The inflection points are indicated by arrows.
The method consists of placing the accumulation chamber aboye the soil surface, allowing the accumulation of the gas from soils. Then, the gas is pumped towards the caz IR detector, at an approximate flow rate of 20 mLS-l. Later on, the gas is returned
to the camera, closing the circuito Thus, the disturbances of the gas naturally released from the soil are minimized. Finally, the sig-nal emitted by the IR is transformed by the AD converter and trans-mitted directly to the PC, where it is observed, in real time, the [COz] versus time. Therefore, the flux is derived by obtaining the increase of the [COz] as a function of time, expressed as ppm5-1,
in volume. In order to convert the volumetric concentration into mass concentration units (g m- z day-1 or mol m-z day-1), atmo-spheric pressure and temperature, both obtained during the field-work, and the chamber volume, are taken into account [40].
Computation of the total caz output values was performed on the basis of a graphical-statistical analysis [31,33,41], by using SPSS and ORIGIN codeso This method, commonly used in the treat-ment of geochemical data, consists in the partition of the caz flux values in different log-normal populations. For that, the inflection points were taken into account. On a log-probability plot, a single log-normal population results as a straight line, whilst a curve with an inflection point describes the theoretical distribution of two overlapped log-normal populations. In general, n overlapped
log-normal populations result on a curve characterized by n - 1
inflection points [42]. Consequently, this method allows recognis-ing the different populations from a data seto The necessary param-eters to calculate the total caz flux of each population was determined by using the Sichel method [43]. These parameters include the flux average values of the populations and their corresponding standard deviations.
Itwas used the graphical procedure according to since it allows the determination of the parameters necessary for the calculation of the total caz flux, such as: (i) the estimation of the proportion of each observed population; (ii) the flux average value; and (iii) the standard deviation of each population.
The total caz output associated with each population was ob-tained by multiplying the area ofthe measured site, the proportion of each population and the average caz flux value. The average caz flux values and the central 95% confidence interval of the average, which was used to calculate the uncertainty ofthe total caz output estimated, were calculated by using the Sicheís t-estimator[32,43].
The total caz released from the whole explored area was obtained by adding the contribution of each individual population.
Fig. 9. Histogram (a) and probability plots (b) corresponding to InC02 flux,
expressed in mol m-2day-l, for Leiva site (March 2010). Note the Gaussian
distribution of the measurements population.
(a)
30 ,-- L_ei_V_a_(M_a_r_C_h_2_0_10_) ---,-3.5 -3.0 -2.5 -2.0 -1.5 -1.0 -0.5
In CO2Flux (mol m' 2day")
graphical representation was computed by combining the ArcG1S and Stanford Geostatistical Modeling Software (SGeMS) codeso
Kriging procedure provides a single map of the Best Linear Unbiased Estimator (BLUE) for quantities that vary in space. The estimates are "smoothed" such that low values are overestimated, whilst high values tend to be underestimated. This effect of smoothing is greatest in areas furthest from sample locations. However, the geostatistical simulation avoids some of the restric-tions of kriging, since it does not aim to minimize local error vari-ances. The basic idea ofthis stochastic simulation is the generation of equiprobable representations of the spatial distribution of the simulated values, reproducing the statistical (histogram) and spa-tial (variogram) characteristics ofthe original data[40,41].The dif-ferences among all simulated maps (usually from 100 up to 500
realizations are performed) are used to compute the uncertainty of the
caz
flux estimation. The sGs method was already widely used for the estimation of the soilcaz
degassing at other volcanic systems [33,40,41,45-47].Therefore, a simulated map looks more "realistic" than the map of the statistically "best" estimates, because it reproduces the spa-tial variability from the sample information [48].
Data obtained during the two experimental campaigns were firstly treated by means of a statistical analysis, in order to calcu-late the basic statistic parameters (Table 2).
According to data reported in Table 2, it is worthy to note that
caz
fluxes higher than 1mol m-z
day-l was only sporadically re-corded, La Majada being the site where the highest values were measured.As the
caz
flux data tend to a log-normal distribution, the ln(COz) flux data were processed according to the Sinclair method[42].The log-probability plots allow the identification ofthe differ-ent populations for each explored site by means of the inflection points. For El Saladillo (Fig. 4) and Las Moreras (Fig. 5) sites two inflection points (-0.17 and -2.74and -3.0 and -0.35, respec-tively) were identified and, therefore, three populations were rec-ognized. At La Majada site only one inflection point(-1.74) and two populations were observed in September2009 (Fig. 6). For 3. Results and discussion
0.5 0.0 Leiva (March2010)
-3.75 -3.25 -2.75 -2.25 -1.75 -1.25 -0.75 -0.25 0.25 0.75
In CO2Flux (mol m'2day")
.
...
'
.
..
'
1
F
"
~-. 1
...
,.
...•
-.'
.
20 25
10
5
(/J
~ 15
Cll
U
(b)
9998
_ 95
?fe. 90 ~ 80
:c
70~ 60
2 50
Q. 40
al 30
.~ 20
-.;
:i 10
§
5U 2
1
0.5
Table 3
Estimated parameters of the different populations for each explored site and total CO2output, according to Sinclair method [42] and Sichel's t-estimator [43].
Explored Sites CO2Flux Measurements Proportion CO2Flux average (M,) Total CO2output 95%Confidence interval standard
(Campaign) Populations (%) (mol m-2day-l) (ton day-l) deviation (ton day-l)
El Saladillo 1 13 7.0 0.876 0.365 0.373-0.361 (September 2009) 2 164 87.7 0.312 1.640 1.853-1.481
3 10 5.3 0.036 0.012 0.029-0.007
Total 187 100.0 2.018 2.254-1.849
Las Moreras 1 11 8.6 0.737 0.147 0.161-0.139 (September 2009) 2 111 86.7 0.231 0.466 0.527-0.420
3 6 4.7 0.017 0.002 0.003-0.001
Total 128 100.0 0.615 0.691-0.561
La Majada [1] 1 268 96.8 0.573 2.121 2.424-1.897 (September 2009) 2 9 3.2 0.011 0.001 0.006-0.001
Total 277 100.0 2.122 2.430-1.898
La Majada [2] 1 78 83.9 0.482 0.695 0.806-0.618 (March 2010) 2 15 16.1 0.059 0.016 0.026-0.012
Total 93 100.0 0.712 0.832-0.630
Leiva [1] 1 14 5.4 0.887 0.383 0.394-0.376
(September 2009) 2 213 82.9 0.378 2.481 2.666-2.334
3 30 11.7 0.090 0.083 0.106-0.070
Total 257 100.0 2.947 3.166-2.780
Leiva [2] 1 94 100.0 0.359 0.475 0.572-0.408
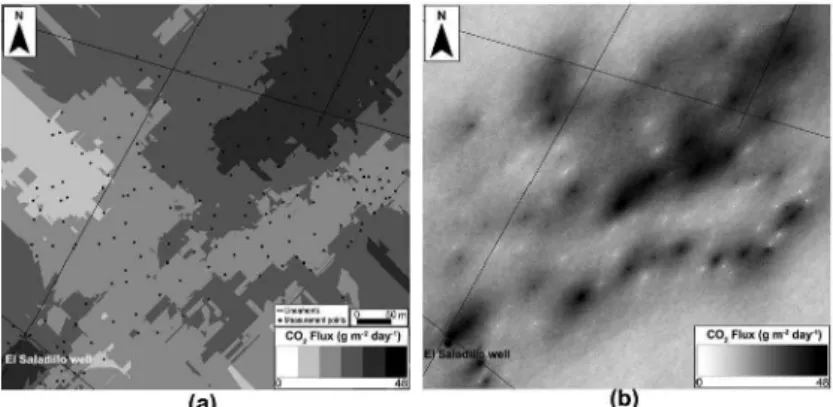
Fig. 10. (a) Surticial distribution of the diffuse soil(02flux, in g m-2day-" for El Saladillo site, by means of a kriging estimation. (b) Sequential Gaussian simulation of the
surticial(02flux.
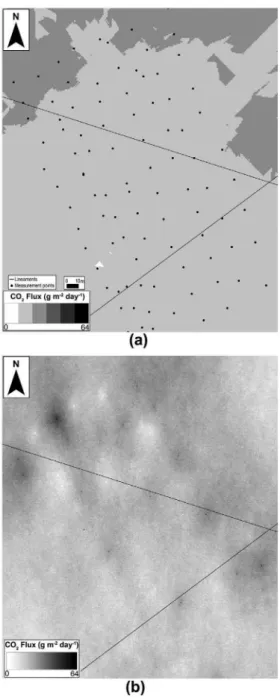
Fig. 11. (a) Surticial distribution of the diffuse soil(02flux, in g m-2day- " for Las Moreras site, by means of a kriging estimation. (b) Sequential Gaussian simulation of the
surticial(02flux.
Fig. 12. (a) Surticial distribution of the diffuse soil(02 flux, in gm-2day-" for La Majada site (Sept. 2009), by means of a kriging estimation. (b) Sequential Gaussian
simulation of the surticial(02flux.
the same site two populations were identified in March 2010 (Fig. 7), being the inflection point at -1.90. Finally, at Leiva site the coexistence of three populations (inflections points at -1.91 and -0.13) were observed in September 2009 (Fig. 8), whilst no individual populations (straight line) were recognized in March 2010 (Fig. 9). The populations that included few data, as it occurred in all the sites, except at Leiva site in March 2010, can be consid-ered negligible when compared to the whole frequency distribu-tion. (onsequently, the main data set can be modelled along with the main population, that it can be evaluated as the "local background of (02Flux". The statistical parameters of the deduced populations are reported in Table 3.
According to Sichel's t-estimator (Mí), the total amount of (02 released towards the surface is estimated to be 2.018, 0.615, 2.122, 0.712, 2.947 and 0.475 ton day-l for El Saladillo, Las Moreras, La Majada (September 2009 and March 2010) and Leiva
(September 2009 and March 2010) sites, respectively. By compar-ing these data with other sites, where (02 output is important, such as in some areas at Tuscany (ltaly) occur (bubbling pools, dry vents and (02soil degassing) [31,32], it can be estimated that the (02 output released from the explored sites is relatively low and similar to the typical biological (02 released from soils [49], which was estimated in approximately 5 g m-2day-l for arid envi-ronments [50]. However, the estimated (02 released from soils at Las Moreras site is about 11.67 g m-2day-l, which is the minimum (02output from the explored sites in this work. This value is more than two times the abovementioned biological (02flux from arid soils. This difference can be explained considering that the studied zone is under semi-arid conditions, where some vegetation is developed.
meth-Fig. 13. (a) Surticial distribution of the diffuse soil CO2flux, in g m-2day-l, forLa
Majada site (March 2010), by means of a kriging estimation. (b) Sequential Gaussian simulation of the surticial CO2flux.
ods [44]. In principie, the relationships between the potential degassing channel (lineaments, faults and/or human perturba-tions) and the
caz
flux values can be established observing thecaz
map produced by both methods. However, no evident relation-ships between lineaments andcaz
flux were observed in any site (Figs. 10-15). The exception is El Saladillo site, where a clear corre-spondence between human perturbation (El Saladillo well) and thecaz
flux values exists (see Fig. 10). Consequently, in undisturbed sites nocaz
leakages were evidenced, suggesting that the Tertiary marly formation, tilling the Mazarrón-Gañuelas Basin, acts as a very effective sealing rock.Finally, when both the kriging estimation and the sequential Gaussian simulation maps are compared, it is observed that they are very similar. Consequently, both methods are valid for the sur-ticial
caz
flux mapping andcaz
quantitication by interpolation/ extrapolation ofthe measured values. Nevertheless, no clear corre-lations between structural discontinuities (lineaments) and highercaz
flux values were observed. On the contrary, close relationship between anthropogenic disturbances and highercaz
fluxes exists in El Saladillo site (see Fig. 10), where a deep exploration well was drilled.4. Conclusions
On the basis of the diffuse soil
caz
degassing surveys carried out in the Mazarrón-Gañuelas Tertiary Basin, some general conclu-sions can be outlined, as follows:Fig.14.(a) Surticial distribution of the diffuse soil CO2flux, in g m-2day-" for
Leiva site (September 2009), by means of a kriging estimation. (b) Sequential Gaussian simulation of the surticial CO2flux.
1. The cap-rock appears to be very efficient as sealing formation, since it does not allow any relevant
caz
leakages towards the surface (up to 2.947 ton day-l). That is, in terms ofcaz
soil flux, the Tertiary marly sedimentary deposits represent an impervi-ous formation through which the escape ofcaz
is not jeopardized.2. Both kriging estimation and sequential Gaussian simulation maps can be applied to the surticial
caz
flux mapping andcaz
quantitication by interpolating/extrapolating the measured values in any similar sedimentary Basin.Acknowledgements
References
[1] MackenzieFr,Lerman A, Ver LMB. Recent past and future ofthe global carbon cycle. Geologic Perspect Glob Climate Change 2001;47:51-82.
[2] Zapatero MA, Suarez 1, Arenillas A, Marina M, CatalinaR,MartinezR.Proyecto europeo geocapacity: assessing european capacity for geological storage of carbon dioxide. Final report; 2009.
[3] PearceJ, Czernichowski-Lauriol 1, Lombardi S, Brune S, Nador A, Baker J, et al. A review of natural CO2 accumulations in europe as analogues for geological
sequestration. Geol Soc, London, Spec Pub 2004;233:29-41.
[4] Haszeldine RS, Quinn O, England G, Wilkinson M, Shipton ZK, Evans JP, et al. Natural geochemical analogues for carbon dioxide storage in deep geological porous reservoirs, a United Kingdom perspective. Oil & Gas Sci Technol - Revue de L'lnstitutFran~aisdu Petrole 2005;60:33-49.
[5] PetitJC. Reasoning by analogy: rational foundation ofnatural analogue studies. Appl Geochem 1992(1):9-12.
[6] Czernichowski-Lauriol 1, Sanjuan B, Rochelle C, Bateman K, Pearce J, Blackwell P. The underground disposal of carbon dioxide. In: Holloway S, editor. Inorganic Geochemistry. Final report of Joule 11 project N CT92-0031; 1996. [7] Pearce JM, Holloway S, Wacker H, Nelis MK, Rochelle C, Bateman K. Natural
occurrences as analogues for the geological disposal of carbon dioxide. Energy Convers Manage 1996;37:6-8.
[8] Pearce JM, Rochelle C. CO2storage: mineral reactions and their influences on
reservoir permeability. Elsevier: A comparison of laboratory and field studies; 1999.
[9] Czernichowski-Lauriol 1, Pauwels H, Vigouroux P, Le Nindre YM. The french carbogaseous province: an illustration of natural processes of CO2generation,
migration, accumulation and leakage. In: Proceedings of greenhouse gas control technologies; 2003; vols. I and 11: 411-6.
[lO] Hawkins DG. No exit: thinking about leakage from geologic carbon storage sites. Energy 2004;29:1571-8.
[11] Beaubien SE, Lombardi S, Ciotoli G, Annuziatellis A, Hatziyannis G, Metaxas A, et al. Potential hazards of CO2 leakage in storage systems-Learning from
natural systems. Greenhouse Gas Control Technol 2005;7:551-60. [12] NordbottenJM, Celia MA, Bachu S, Dahle HK. Semianalytical solution for CO2
leakage through an abandoned well. Environ Sci Technol 2005;39:602-11. [13] Oldenburg CM, Lewicki JI.. On leakage and seepage of CO2 from geologic
storage sites into surface water. Environ Geol 2006;50:691-705.
[14] Riding JB, The lEA. Weyburn CO2monitoring and storage project - integrated
results from Europe. Adv Geol Storage Carbon Dioxide: Int Approach Reduce Anthropogenic Greenhouse Gas Emissions 2006;65:223-30.
[15] LewickiJL, Birkholzer J, Tsang CF. Natural and industrial analogues for leakage of CO2from storage reservoirs: identification of features, events, and processes
and lessons learned. Environ Geol 2007;52:457-67.
[16] Prado-Pérez, AJ. El Sistema Termal de Alicún de las Torres (Granada) como Análogo Natural de Escape de CO2 en forma de DIC: Implicaciones
Paleoclimáticas y como Sumidero de CO2.Ed. Universidad Complutense de
Madrid; 2011. 411 p. <http://eprints.ucm.es/13432/l/T33076.pdf> [accessed dic 2012].
[17] Prado-Pérez AJ, Pérez del Villar 1.. Dedolomitization as an analogue process for assessing the long-term behaviour of a CO2deep geological storage: the alicún
de las torres thermal system (Betic Cordillera, Spain). Chem Geol 2011;289:98-113.
[18] Rodríguez-Estrella T. Hidrogeología de la Región de Murcia. In: Conesa C, editor. El Medio físico de la Región de Murcia. Murcia: Universidad de Murcia; 2006. p. 143-81.
[19] Pérez del Villar L, Pelayo M, Recreo F. Análogos Naturales del Almacenamiento Geológico de CO2(Fundamentos, Ejemplos y Aplicaciones para la Predicción de
Riesgos y la Evaluación del Comportamiento a Largo Plazo). CIEMAT; 2007. [20] Pérez del Villar 1.. Memoria Científico-Técnica del periodo 2008-2009 del
PSE-120000-2008-6 (PSS-120000-2008-31). Línea de Análogos Naturales: Resultados preliminares del estudio de los análogos naturales estudiados en: la región de La Selva (Girona), Valle del Alto Guadalentín (Murcia-Almería), Alicún de las Torres (Granada), Alhama de Aragón-Jaraba (Zaragoza) y Castilla León. CIEMAT; 2009.
[21] Nisi B, Vaselli O, Gimeno MJ, Tassi F, Acero P, Poreda RJ, et al. Effects of deep saline C02-rich waters in the shallow aquifers from the Mazarrón-Gañuelas Tertiary basin (central-southern Spain). In: Proceedings of the 85° Congresso Nazionale; 2010 September 6-8; Pisa, Italy. Societa Geologica Italiana; 2010. Rend. online Soc. Geol. It., 11, p. 186-7.
[22] Nisi B, Vaselli O, Gimeno MJ, Tassi F, Acero P, Rodrigo-Naharro J, et al. Water deterioration of the Mazarrón-Gañuelas aquifer (SE Spain) by deep-seated C02-rich saline waters as evidenced by geochemical and isotopic investigations. In: Proceedings of the 89th SIMP meeting; 2010 September 13-15; Ferrara, Italy. Societa Italiana di Mineralogia e Petrologia; 2010, S2.2-03.
[23] Vaselli O, Nisi B, Tassi F, Rodrigo-Naharro J, Pérez del Villar 1.. Diffuse soil CO2
flux and water and dissolved gas geochemistry in the Gañuelas-Mazarrón area (Guadalentin Valley). Final report; 2010.
[24] Parkinson K. An improved method for measuring soil respiration in the field. J Appl Ecol1981;18:221-8.
[25] Baubron JC, Allard P, Toutain JP. Diffuse volcanic emissions of carbon dioxide from Vulcano Island, Italy. Nature 1990;344:51-3.
[26] Baubron JC, Allard P, Toutain JP. Gas hazard on Vulcano Island. Nature 1991;350:26-7.
(b)
N
Á
4. The COz-rich deep saline aquifer sealed by Tertiary marls repre-sents an excellent geological example to guarantee, by analogy, the long-term COz storage, as long as the site would not anthro-pologically perturbed as it occurs at the Mazarrón-Gañuelas Tertiary Basin.
Fig. 15. (a) Surficial distribution of the diffuse soil CO2flux, in gm-2
day-" for Leiva site (March 2010), by means of a kriging estimation. (b) Sequential Gaussian simulation of the surficial CO2flux.
This work was carried out in the framework of the Project enti-tled:'Tecnologías avanzadasdegeneradón, capturay
[27] Hutchinson Gl., Moiser AR. Improved soil cover method for field measurement ofnitrous fluxes. Soil Sci Soc AmJ 1981;45:311-6.
[28] Chan ASK, Prueger JH, Parkin TB. Comparison of closed-chamber and bowen-ratio methods for determining methane flux from peatland surface. J Environ Qual1998;27:232-9.
[29] Mitra S,Jain MC, Kumar S, Bandyopadhyay SK, Kalra N. Effect ofrice cultivation on methane emission. Agr Ecosyst Environ 1999;73:177-83.
[30] Kanemasu ET, Power WL, Sij JW. Field chamber measurements of CO2flux
from soil surface. Soil Sci 1974;118:233-7.
[31] Chiodini G, Cioni R, Guidi M, Raco B, MariniL.Soil CO2flux measurements in
volcanic and geothermal areas. Appl Geochem 1998;13:543-52.
[32] Chiodini G, Frondini F, Kerrick DM, Rogie J, Parello F, Peruzzi l., et al. Quantification of deep CO2 fluxes from Central Italy. Examples of carbon
balance for regional aquifers and of soil diffuse degassing. Chem Geol 1999;159:205-22.
[33] Chiodini G, Frondini F, Cardellini C, Granieri D, Marini L, Ventura G. CO2
degassing and energy release at Solfatara volcano, Campi Flegrei. Italy. J Geophys Res-Sol Ea 2001;106:16213-21.
[34] Gerlach TM, Doukas MP, McGee KA, Kessler R. Three-year decline ofmagmatic C02 emissions from soils of a mammoth mountain tree kil!: Horseshoe l.ake, CA, 1995-1997. Geophys Res Lett 1998;25:1947-50.
[35] Gerlach TM, Doukas MP, McGee KA, Kessler R. Soil efflux and total emission rates of magma tic C02 at the Horseshoe lake tree kil!, Mammoth mountain, CA, 1995-1999. Chem Geol2001;177:101-16.
[36] Bergfeld D, Goff F, JanikCJ.Elevated carbon dioxide flux at the Dixie valley geothermal field, Nevada; relations between surface phenomena and the geothermal reservoir. Chem Geol 2001 ;177:43-66.
[37] Brombach T, Hunziker JC, Chiodini G, Cardellini C, Marini L. Soil diffuse degassing and thermal energy fluxes from the southern Lakki plain, Nisyros (Greece). Geophys Res l.ett 2001;28:69-72.
[38] Cardellini C, Chiodini G, Frondini F, Granieri D, l.ewicki J, Peruzzi L.
Accumulation chamber measurements of methane fluxes: application to volcanic-geothermal areas and landfills. Appl Geochem 2003;18:45-54.
[39] Tassi F, Montegrossi G, Vaselli O, Morandi A, Capecchiacci F, Nisi B. Flux measurements ofbenzene and toluene from landfill cover soils. Waste Manage Res 2009;29:50-8.
[40] Mazot A, Taran Y. CO2 flux from the volcanic lake of El Chichón (Mexico).
Geofísica Internacional 2009;48:73-83.
[41] Cardellini C, Chiodini G, Frondini F. Application of stochastic simulation to carbon dioxide flux from soil: mapping and quantification of gas release. J Geophys Res 2003;108. 13-1-13-3.
[42] Sinclair AJ. Selection ofthreshold values in geochemical data using probability graphs. J Geochem Expl 1974;3:129-49.
[43] Sichel HS. The estimation of means and associated confidence limits for smalls samples from lognormal populations. In: Symposium on mathematical statistics and computer applications in ore valuation. South Afr. Inst. Min. Metall. 1966:106-22.
[44] Deutschev,Journel AG. GSLIB: geostatistical software library and users guide. 2nd ed. New York: Oxford Univ. Press; 1998.
[45] Melián GV, Pérez NM, Hernández PA, Nolasco D, Marrero R, Fernández M, et al. Diffuse CO2emission and volcanic activity at Poás volcano, Costa Rica, Central
America. Revista Geológica de América Central 2010;43:147-70.
[46] Frondini F, Chiodini G, Caliro S, Cardellini C, Granieri D, Ventura G. Diffuse CO2
degassing at Vesuvio. Italy Bull Volcanol 2004;66:642-51.
[47] Padrón E, Hernández PA, Toulkeridis T, Pérez NM, Marrero R, Melián G, et al. Diffuse CO2 emission rate from Pululahua and the lake-filled Cuicocha
calderas. Ecuador J Volcanol Geoth Res 2008;176:163-9.
[48] Goovaerts P. Estimation or simulation of soil properties? An optimization problem with conflicting criteria. Geoderma 2000;97:165-86.
[49] Parkin TB, Doran JW, Franco-Vizcaino E. Field and laboratory tests of soil respiration. In: Doran JW, Jones AJ, editors. Methods for assessing soil, quality; 1996, p. 231-45.