Increases of Corporal Temperature as a Risk Factor of Atherosclerotic
Plaque Instability
GUSTAVO V. GUINEA, JOSE M. ATIENZA, PANAYOTIS FANTIDIS, FRANCISCO J. R O J O , ARANZAZU ORTEGA,
M O N I C A TORRES, PABLO GONZALEZ, MARGARITA L. ELICES, KOZABURO HAYASHI, and M A N U E L ELICES
Depto de Ciencia de Materiales, Universidad Politecnica, E.T.S.I. Caminos, Canales y Puertos, c/ Profesor Aranguren s/n, 28040 Madrid, Spain; Laboratorio de Investigacion Cardiovascular, Departamento de Medicina y Cirugia Experimentales,
Hospital Clinico Universitario San Carlos, 28040 Madrid, Spain; Departamento Anatomia Patologica, Clinica Ruber, 28006 Madrid, Spain; and Research Institute of Technology, Okayama University of Science, Okayama 700-0005, Japan
Abstract—Background This work explores for the first time
the effects of temperature increments on the development of high shear stresses between plaque and arterial wall due to their different dilatational properties. Data from the literature report febrile reactions prior to myocardial infarction in patients with normal coronary arteries and that coronary syndromes seem to be triggered by bacterial and viral infections, being fever the common symptom. Methods The thermo-mechanical behavior of thoracic aortas of New Zealand White rabbits with different degrees of atheroscle-rosis was measured by means of pressure-diameter tests at different temperatures. In addition, specific measurements of the thermal dilatation coefficient of atheroma plaques and of healthy arterial walls were performed by means of tensile tests at different temperatures. Results Results show a different thermo-mechanical behavior, the dilatation coefficient of atheroma plaque being at least twice that of the arterial wall. The calculation of temperature-induced mechanical stress at the plaque-vessel interface yielded shear stress levels enough to promote plaque rupture. Conclusions Increases of corporal temperature either local—produced by the inflammatory processes associated with atherosclerosis—or systemic—by febrile reactions—can play a role in increasing the risk of acute coronary syndromes, and they deserve a more compre-hensive study.
Keywords—Atherosclerosis, Rabbit model, Thermal
dilata-tion coefficient, Shear stress.
INTRODUCTION
Acute coronary syndromes (ACS), which include unstable angina and acute myocardial infarction (MI), result from coronary thrombosis occurring at sites of plaque rupture or superficial erosion. The events
leading to plaque instability are not entirely known, but it is widely accepted that plaque cap weakening contributes to coronary plaque instability and vulner-ability. The central lipid core of vulnerable athero-sclerotic plaques accounts for more than 40% of the total volume lesion, and plaque caps are potentially vulnerable to mechanical stress and/or exacerbated inflammation. In addition, several other factors exter-nal to the coronary plaque such as vasoconstriction and high blood-pressure may increase the chance of rupture, and hypercoagulability at the sites of plaque rupture may cause thrombi formation, and subse-quently, severe coronary occlusion.
Several prospective and retrospective studies have suggested that acute respiratory infection might trigger myocardial infarction,3 and that patients with MI had significantly more acute respiratory-tract infections in the 10 days before the index date of MI than the control subjects in the same time period. Recent clinical and experimental studies indicate that MI and stroke may be prevented by influenza vaccination, since this vaccination is negatively associated with the
development of recurrent MI. Although some potential mechanisms and contributing factors
have been proposed as relating influenza virus and bacterial infection to the development of ACS, the mechanism whereby a systemic viral or bacterial infection can induce plaque rupture or erosion remains unclear.
the development of highly stressed regions between materials with different dilatational properties.
On the basis of our previous results on the coupled thermo-mechanical behavior of blood vessels and the fact that fever is the common clinical symptom of both bacterial and viral infections, we explore in the present work the effect of increases of corporal temperature, and in particular the effect of the mismatch of the lineal dilatation coefficient of the arterial wall and atherosclerotic plaque on the development of interfa-cial shear stresses that can lead to plaque detachment and thrombi formation. In this study, the thermo-mechanical properties of arterial vessels with different degrees of atherosclerosis have been measured by means of a rabbit model, determining the different dilatational behavior of the atheromatous plaque and arterial wall. The mechanical stresses at the plaque-vessel interface have been calculated by means of a simple model that gives the average shear stress. The paper closes by discussing whether, in addition to other mechanisms still under consideration, increases of corporal temperature can play a role in increasing the risk of ACS, and if they merit a more comprehensive study.
METHODS
Material
Experiments were conducted in accordance with the "European Convention on Animal Care" on male New Zealand White rabbits weighing 3.8-5.0 kg. The descending thoracic aorta was excised from rabbits with different degrees of atherosclerosis induced by hypercholesterolemia.
Nineteen rabbits were used for the study. They were randomly sorted into three groups:
(a) Group A: Six rabbits were fed on a standard diet for 90 days. Aortas from this group were used as control.
(b) Group B: Eight rabbits were fed on a high-cho-lesterol diet (rabbit chow supplemented with 2% cholesterol, 100 g/day/animal) for a period of 45-55 days. This group developed hypercholes-terolemia and atherosclerotic lesions, and was used to evaluate the medium-term development of the disease.
(c) Group C: Five rabbits were fed on the same 2% cholesterol-rich diet for a period of 90 days. Ves-sels from this group developed large atherosclerotic lesions and were used for the long-term evaluation. After the corresponding period, all the animals were euthanized with an intravenous overdose of pento-barbital sodium and their thoracic aortas were
harvested. Before excision, the in vivo reference length was marked by means of two suture loops. Collaterals, if any, were occluded by hemostatic clips (Ethicon Ligaclip MCA). Specimens were preserved in saline solution at 4 °C until testing within 12 h from excision. Although the short time after extraction ensured that muscle cells were alive no activation was induced in order to analyze the passive behavior of the arterial wall.
The clinical protocol, carried out in the Hospital Clinico San Carlos of Madrid, was conducted in compliance with the Directive 86/609/EEC of the European Union on the protection of animals used for experimental and other scientific purposes, and was approved by the hospital's ethics committee.
Biochemical Measurements
Plasma lipids (total cholesterol, HDL-cholesterol, and LDL-cholesterol) and IL-1/? levels were measured in rabbits from group A (control) at baseline, 45, 55, and 90 days after starting the standard diet. In group B as well as in group C, plasma lipids and IL-1/? were determined at baseline, 45, 55, and 90 days after starting the high-cholesterol diet. All biochemical measurements were performed in duplicate. Total plasma cholesterol (mg/dL), LDL-cholesterol (mg/dL), and HDL-cholesterol (mg/dL) were measured by col-orimetric methods using commercial kits (Sigma Diagnosis Inc., St. Louis, USA).
Histology
The thoracic aortas were washed with sterile saline solution after removal from the body. Histological analysis was performed on 10 mm edge portions to determine the wall thickness and structure, and the size and morphology of the atherosclerotic lesions. Two rings from the aorta were stained with oil-red-O. The remaining tissue was fixed in 10% formalin in no-load condition for at least 24 h. Fixed arteries were sec-tioned into 3-mm rings for embedding in paraffin and stained by hematoxylin/eosin and orcein to resolve the elastic fibers.
Thermo-mechanical Pressure-Diameter Tests Quasi-static in vitro pressure-diameter tests were carried out at four different temperatures including the physiological, 17, 27, 37, and 42 °C, which encompass most situations of interest, from severe hypothermia for cardiac surgical procedures to febrile events.
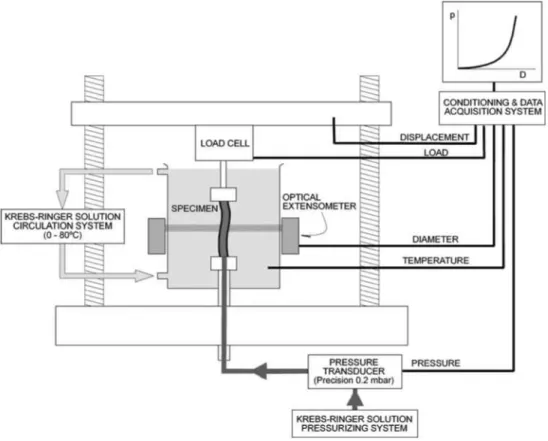
means of appropriate veterinary needles. A 100 N load cell (Instron 2525-806, precision > 0.1 N) was used to monitor the axial force applied to the specimen. The lower grip was specially designed to allow internal pressurization of the vascular segment through the needle. The experimental device is sketched in Fig. 1.
During the tests, specimens were kept inside a transparent chamber and submerged in PBS solution heated by a thermostatic bath (Unitronic 6320200). The temperature of the vessel was controlled to 0.5 °C by a K-type thermocouple located in the chamber and close to the artery ( < 4 mm).
Specimens were first stabilized at 37 °C and stret-ched to their in vivo length, which was equal, on average, to 1.2 times the length at rest. No significant differences were found in the in vivo length of control and atherosclerotic rabbits. Then, pressurization tests were sequentially performed on every specimen start-ing at the lowest temperature (17 °C). A stabilization period of at least 15 min was allowed at each test temperature. The average total test duration per sam-ple (tests at the four temperatures) was 120 min. To check reproducibility, some samples previously tested at the four temperatures (17, 27, 37, and 42 °C) were tested once again at 27 °C. Since no appreciable dif-ferences were observed between pressure-diameter curves of the two tests at 27 °C, it was concluded that
FIGURE 1. Experimental set-up for pressure-diameter tests.
pressure-diameter tests were not affected by the duration of the test.
After the stabilization period at the prescribed temperature, intravascular pressure was applied to the vessel via the lower needle. Pressure was measured with a transducer with 0.02 kPa (0.15 mmHg) accuracy (Druck PMP 4000). Synchronized measurement of the outer diameter at the midpoint section was achieved using an optical extensometer with 1 /mi accuracy (Keyence LS-7500).
Transmural pressure, i.e., the pressure difference between the inside and the outside of the vessel, was cycled from 0 to 26.66 kPa (0-200 mmHg) at a loading rate of 0.4 kPa/s (3 mmHg/s) until stress-relaxation effects were removed. A stable and reproducible response with a negligible hysteresis loop was achieved typically within five cycles—and always before ten—in all the specimens. After pre-conditioning, aortas were once more pressurized up to 26.66 kPa (200 mmHg) at 0.4 kPa/s (3 mmHg/s), and the loading branch was used for the analysis.
Thermo-mechanical Tensile Tests
behavior of the healthy arterial wall and the plaque separately. Two types of specimens were tested:
- Healthy aortic wall specimens were obtained from arteries of group A. Nominal 10 x 2 mm2 strips were obtained from longitudinally cut opened arter-ies. Specimens were excised with their longitudinal axis coincident with the circumferential direction of the vessel.
- Atheromatous plaques averaging 10 mm in length and 4 mm in width were obtained from arteries of group C by gently removing the fibrous portion of vascular tissue. A blunt blade was used to avoid damaging the specimens. Standard 10 x 2 mm2 tensile samples were obtained from plaque portions.
Specimens were fixed to the grips of an electrome-chanical tensile testing machine (Instron 4411) and placed in a thermostatic bath of PBS solution, as de-scribed for pressure-diameter tests. The axial force was measured with the tensile testing machine by means of a 10 N load cell (Instron 2519-101, precision > 5 mN) and the elongation by the internal LVDT sensor (precision > 10 /im). The crosshead displacement was taken as a direct measurement of the sample elonga-tion, since the compliance of the sample had been estimated as 100 times that of the equipment. An optical extensometer with 1 fim accuracy (Keyence LS-7500) was used for continuous monitoring of the specimen thickness.
Unloaded specimens were stabilized at each test temperature for at least 15 min. Then a few load cycles between 0 and 0.1 N were applied until a reproducible response with a negligible hysteresis loop was achieved. Specimen thickness was recorded at the beginning of the last cycle, in zero load condition. The ascending branch of the last cycle was used to compute the load-displacement curve of the specimen.
Statistical Analysis
Values within groups were averaged and expressed as mean ± standard error. Unpaired Student /-test was used for comparison between groups. Differences were considered significant at probability P-values under 0.05.
Thermo-mechanical Analysis
The effect of temperature was evaluated through the pressure-diameter and tensile curves measured at dif-ferent temperatures. These curves were used to com-pute the thermal dilatation coefficient a of the aortic wall at different pressure and stress levels.
The thermal dilatation coefficient measures the change in size caused by temperature. Positive values correspond to substances that expand when heated, while negative ones indicate that the material shrinks as the temperature increases. In first order, the frac-tional variation in size is proporfrac-tional to the temper-ature increment, and it is given by:
dH/H=aclT (1) x being the thermal dilatation coefficient, H the size,
and dH and dT the infinitesimal variations of size and temperature. Integration of Eq. (1) between a reference state (TRef, HRe[) and (T, H) yields H= HRet ea(-T-T™'
that can be rearranged12:
H = H*eaT (2)
where H* = HRef e~a'TRet is a constant. The thermal
dilatation coefficient a is readily obtained by direct fitting of this equation to the appropriate experimental data, irrelevant to Hret or Tret values. In the
pressure-diameter tests, the input for Eq. (2) were the pairs temperature-diameter (T, D) measured at a given pressure. In tensile tests, the specimen length L at a given stress level was chosen for the fit along with temperature T.
RESULTS
Biochemical Determinations
The values of plasma lipids for the three groups are shown in Table 1. Over the 90 days plasma lipids did not change in control rabbits (group A, Table la) whilst a statistically significant increase over its base-line values is seen at 45 and 55 days for group B, and 90 days for group C.
Histology
TABLE 1. (a) Biochemical variables in control animals (group A) and (b) Long-term total cholesterol, HDL-cholesterol, LDL-cholesterol, and IL-1/J for rabbits from groups B and C.
(a)
Baseline 30 days 90 days P-value
Total cholesterol HDL-cholesterol LDL-cholesterol IL-1/? (pg/mL)
50 ± 2 2 20 ± 7 46 ± 2 3 6.8 ±3.3
55 ± 2 0 21 ± 8 43 ± 2 2 8.7 ±2.8
59 ± 3 0 25 ± 7 40 ± 2 3 8.1 ± 1.1
NS NS NS NS
(b)
Baseline 45 days 55 days 90 days
Total cholesterol HDL-cholesterol LDL-cholesterol IL-1/? (pg/mL)
51 ± 3 0 22 ± 8 40 ± 2 2 5.7 ± 4.3
2009 ± 612* 410 ± 66* 1212 ± 195*
12 ± 6.7*
1812 ± 3 1 5 * 372 ± 87* 1600 ±232*
32 ± 9.8*
1610 ± 2 1 1 * 374 ± 72* 1501 ±312*
42 ±11.3*
Plasma lipids are expressed as mg/dL.
'Statistically significant differences over controls.
TABLE 2. Arterial wall and plaque thickness (Mean : Dev.).
Std.
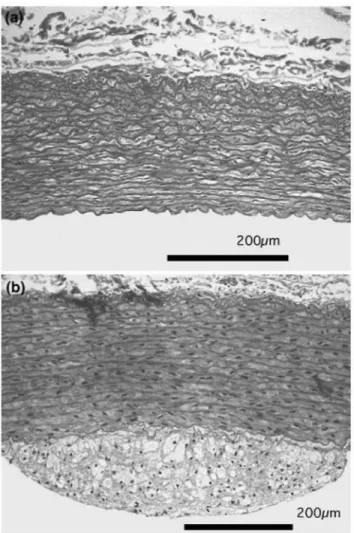
FIGURE 2. (a) Cross section of a healthy thoracic aorta from a control rabbit (group A), (b) Cross section of a thoracic aorta from an atherosclerotic rabbit (group B).
Group
A B B C
Days of cholesterol-rich
diet
0 45 55 >70
Wall thickness
(mm)
0.26 ± 0.02 0.29 ± 0.01 0.29 ± 0.01 0.28 ± 0.01
Plaque thickness
(mm)
_
0.09 ± 0.01 0.22 ± 0.02 0.34 ±0.015
Plaque/ Wall ratio
0 0.31 0.76 1.21
oil-red-O staining excluded lipid accumulation in the intima at 30 days but at 45 and 55 days macroscopic lesions were grossly visible and oil-red-O staining showed lipid accumulation in the intima (Fig. 2b). Soft atheroma plaques with high lipid content were formed in rabbits of groups B and C, as well described in the literature.
Pressure-Diameter Tests
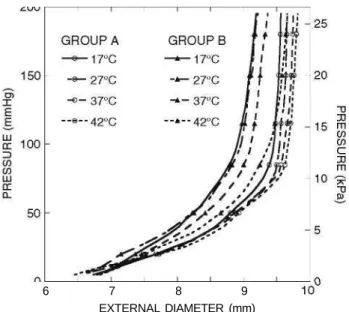
Mean pressure-diameter curves of thoracic arteries measured at 17, 27, 37, and 42 °C are shown in Fig. 3. Values of mean diameters and standard errors at 16 kPa (120 mmHg) inner pressure are given in Table 3. Pressure-diameter curves show two relatively well-defined portions below and above a pressure level of about pQ = 10.67 kPa (80 mmHg). The first part of
the curves, under pQ, is more compliant and less
sen-sitive to changes due to atherosclerosis and tempera-ture. The second part—above pQ—is steeper and
6 7 8 9 EXTERNAL DIAMETER (mm)
FIGURE 3. Mean pressure-diameter curves of the thoracic aortas at the four test temperatures. Group A: healthy control group. Group B: 50 days average cholesterol-rich diet.
TABLE 3. Thoracic aorta diameters at 16 kPa (120 mmHg) pressure level.
Diameter (mm) at p = 16 kPa (120 mmHg) (Mean ± Std. Err.)
Group
A B C
17 °C
9.5 ± 0.7 9.0 ± 0.6 8.5 ± 1.5
27 °C
9.6 ± 0.6 9.2 ± 0.6 8.7 ± 1.5
37 °C
9.7 ± 0.6 9.0 ± 0.6 9.0 ± 1.6
42 °C
9.7 ± 0 . 6 9.5 ± 0 . 6 9.4 ± 1.8
Group C vessels no longer maintained a cylindrical configuration and were used mainly as a source of atheroma plaques for tensile tests. Pressure-diameter curves for atherosclerotic vessels—group C—showed an atypical behavior due to the inhomogeneities on the arterial wall produced by atheroma plaques and their curves are not displayed in Fig. 3. For comparison purposes, their mean diameters at p = 16 kPa (120 mmHg) are shown in Table 3.
At a given temperature, it is observed a progressive stiffening of the vessels, indicating the effects of the advance of atherosclerosis. The most compliant arter-ies were the healthy ones from control group A. Temperature effects were greater in atherosclerotic vessels, where artery diameters changed noticeably with temperature at a given pressure.
The thermal dilatation coefficient a was computed by least square fitting of Eq. (2) to temperature-diameter pairs measured at the same pressure level. Figure 4 shows the mean value of a and the stan-dard error as a function of pressure. Healthy and
FIGURE 4. Mean thermal dilatation coefficient and standard error deduced from pressure-diameter tests. Group A: heal-thy control group. Group B: 50 days average cholesterol-rich diet.
medium-term diseased thoracic arteries—groups A and B, respectively—displayed an inversion of the thermal dilatation coefficient: negative values (indicating that arterial wall diameters shrink when heated) were obtained at low pressure while positive x were found at pressures over 1.33-2.66 kPa (10-20 mmHg). The thermal dilatation coefficient increased monotonically with pressure level with a progressively decreasing slope, approaching a satura-tion value at physiological pressures.
Tensile Tests
Specific tensile tests were performed to compare the behavior of the healthy arterial wall and the plaque separately. Healthy aortic wall (obtained from vessels of group A) and atheromatous plaque (obtained from arteries of group C) were tested.
Figure 5 shows the tensile curves obtained for both types of tissues at 37 °C. Stress a was computed by dividing force F by the initial cross-sectional area AQ,
and the strain is represented by the stretching X that was obtained by dividing the instantaneous length L by the initial length LQ. The degree of variability of curves
in Fig. 5 is comparable to other studies and attributable to arterial wall inhomogeneities.
FIGURE 5. Tensile curves of healthy arterial wall from rab-bits of control group A, and atheromatous plaque obtained from rabbits from group C (90 days of cholesterol-rich diet). Test temperature 37 °C.
0.003
,_- 0.002 z LLJ O it 0.001
LU O O z
Q o.ooo H
< I
-Q -0.001 _ l
< CC
LU x -0.002
-0.003
10 20 30 TENSILE STRESS (kPa)
40 50
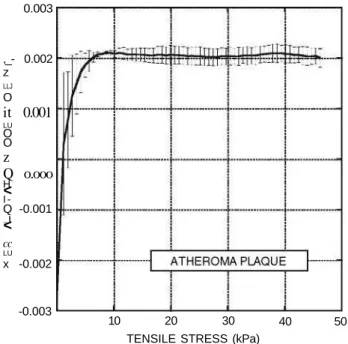
FIGURE 6. Thermal dilatation coefficient of atheromatous plaque obtained from tensile tests at 17, 27, 37, and 42 °C. Mean values and standard deviations are shown.
temperature at a given stress level was used to compute the thermal dilatation coefficient by fitting of Eq. (2) to temperature-length pairs, as described above. The mean values of the resulting thermal dilatation coeffi-cients are plotted in Fig. 6 along with their standard errors.
DISCUSSION
This work shows for the first time that the increment of temperature has an influence on the development of high shear stresses between plaque and arterial wall due to their different thermal dilatational properties. This sheds light on the role of mechanical stresses in plaque instability since results from the literature suggest that plaque rupture is not well characterized by considerations based on plaque nominal strength or critical stresses alone. Although the rabbit model is unable of reproducing the advanced atherosclerotic plaque with large lipid-core and a thin fibrous cap, characteristic of advanced human lesions, it is valuable to assess the response to temperature increments and stability of small atheromatous plaques, clinically silent, that may be at the root of a large number of MI.
Thoracic aortas of New Zealand White rabbits with different degrees of atherosclerosis induced by hyper-cholesterolemia were considered. The biochemical and histological analyses (Tables 1 and 2, and Fig. 2) clearly show the grade of development of the athero-sclerosis, which can be related either to the plaque thickness or to the plasma lipid levels. The lipid accumulation in the intima is observed in advanced stages of the illness (group C) and plaque development becomes evident. Lesions type II III according to American Heart Association criteria were formed, as shown in Fig. 2. IL-1/? levels (Table 1) show that, as in human patients, atheromatous plaques in rabbits are connected to inflammatory processes.
The effect of temperature is markedly higher on pressure-diameter curves of atherosclerotic vessels (groups B and C) than on healthy ones (group A): For a given temperature increment (e.g., from 37 to 42 °C), pressure-diameter curves differ more pronouncedly as atherosclerosis develops (Fig. 3 and Table 3). The observed dependence suggests that atherosclerosis induces a significant variation of the thermal dilatation coefficient a, a parameter that accounts for the dilatational properties of the arterial wall. Subse-quently, a large difference is expected between the thermal dilatation coefficient of the healthy arterial wall and the diseased one.
The variation of the thermal dilatation coefficient derived from pressure-diameter tests depends signifi-cantly on the degree of atherosclerosis as is shown in Fig. 4. Healthy rabbits (group A) show the typical behavior of arterial wall with negative values in the no load condition, an inversion point at « 1 . 3 3 -2.66 kPa (10-20 mmHg), and a positive plateau at physiological pressures (-13.33 kPa (100 mmHg)) and above (a = + 1 x 10"3 (°C)_1). This closely matches a previous work on human carotid arteries by the authors.12 Medium-term diseased vessels, group B, show an increment in a values of up to +2 x 10~3 (°C)_1 with a dependence on pressure level resembling that from healthy vessels of group A. The inversion point is maintained at 1.33-2.66 kPa (10-20 mmHg).
A specific measurement of the thermal dilatation coefficient of atheroma plaques can be performed by tensile tests performed at different temperatures, as explained in sections "Methods" and "Results." The resulting coefficient is about +2 x 10~3 (°C)_1, and shows an inversion point at low stresses (Fig. 6). This a duplicates the value of arterial wall (+ 1 x 10"3 (°C)_1) obtained from healthy aortas.
Large differences in the thermal dilatation coefficient of arterial wall and atheromatous plaque can lead to high interfacial stresses that could eventually provoke plaque detachment in response to a temperature incre-ment. The temperature increment produced by the inflammatory processes associated with atherosclerosis can raise the local temperature of the plaque by up to 2 °C, and temperature differences between athero-sclerotic plaque and healthy vessel wall of over 0.5 °C are a predictor of adverse cardiac events in patients undergoing successful percutaneous intervention. In addition, febrile reactions add up to local temperature increments, placing hyperthermia as a contributing factor to ACS that has to be taken into account.
When two layers of materials with different thermal properties are bonded together, temperature incre-ments generate interfacial shear stresses that develop near the ends, typically along a distance of the same order of magnitude as the thickness of the layers. The
exact distribution of shearing stress along the interface cannot be determined in an elementary way, and some hypotheses about the interface have to be made.
A simple thermo-elastic model was devised to assess the effect of temperature changes on the development of shear stresses at the plaque-vessel interface. The model is inspired by the classical work by Kelly and Tyson on fiber reinforced materials, and assumes a constant interfacial shear stress.
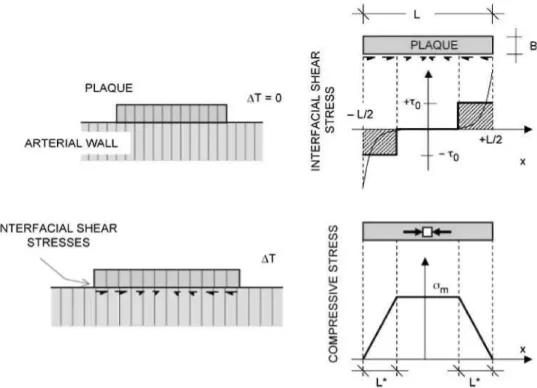
Figure 7 shows the model geometry, where the vulnerable plaque is represented by a layer of length L and thickness B placed on a substrate. The linear dilatation coefficient of plaque and substrate are otp and as, respectively, and no thermal or residual stresses are considered at the reference temperature. It is assumed in the following that ap > as, as was found in the tests previously described.
Shear stresses arise at the interface under a tem-perature increment AT, as a consequence of the dif-ferent thermal strains of the plaque (apA7) and substrate (asA7). The plaque tends to increase in length by a proportion of (apA7), and is hindered by the smaller extension ratio of the substrate (asA7).
If constant shear stresses x0 develop at lengths L* at both ends of the plaque, the maximum longitudinal compressive stress <rm on the plaque is computed as (Fig. 7):
L/2
ffm=BJ xdx = —jf- (3)
o
The strain in the central portion of the plaque is the sum of the thermal dilatation apATplus the shortening caused by the compressive stress, equal to:
«PA T - ^ (4)
Ep being the modulus of elasticity of the plaque. Given
that the plaque stiffness (BEp) is at least one order of
magnitude less than that of the substrate (as experi-mental results from this work and by other authors suggest15) we can assume that the strain in the central portion of the plaque is, in first order approximation, equal to the thermal strain imposed by the substrate xsAr. This leads to:
ocsAT= apAT--^ = otp AT—— (5)
from which we obtain the shear stress as:
T° = Z* ^v ~ 0CS">ATEP (6)
FIGURE 7. Model for stress analysis of plaque-vessel thermal interaction. Shear stresses develop at the interface between plaque and arterial wall, inducing a compressive stress state in the plaque.
x0 > 2 — (ap -as)ATEp (7)
an equation that gives a lower bound of the interfacial shear stress.
The stress x0 considered above can be used as a conservative appraisal of the average shear stresses developed at the interface, which in general attains their maximum values at the ends of the interfacial zone and quickly drops to zero at a distance of the order of plaque thickness, as shown in Fig. 7.
The variation of shear stresses along the plaque can be determined by means of some other well-known interfacial models , although unfor-tunately the maximum shear stress is highly dependent on the specific assumptions made for the interface. For example, the model by Wang can be shown to provide a shear stress profile given by:
Twang(x) = - (ap - as)Ar£p^ -exp (8)
where /za is the thickness of the interfacial layer placed between plaque and substrate. Equation (8) is obtained under the assumption that all the layers are incom-pressible and that the elastic modulus of the interface is comparable to that of the plaque. The maximum stress predicted by Eq. (8) depends critically on the ratio B/h^, and tends to infinity when /za tends to zero. The mean shear stress computed from Eq. (8) provides:
M
Wang(9)
and for a thin interface (y/Bh& <C L) this equation
leads to:
M
Wang 3 - ( ap- as) A r £p (10)a value comparable to that given by Eq. (7).
A similar result can be obtained from the shear lag model applied to the geometry shown in Fig. 7. In this case, the mean shear stress is:
L/2
(T)cox = i / T rfx = 2- («p - as)AT
! - •
cosh
kh
( i i )K being a constant related to the interfacial stiff-ness. Noting that when the plaque is firmly bonded to the substrate is KL1 ;$> Ev and then
(T> C o x ~2^ (ap -as )A r£ p (1 2)
in agreement with Eq. (7).
The interfacial shear stress level between the ather-omatous plaque and the arterial wall originated by variations of temperature has been assessed by first-order approximation using Eq. (7). Assuming a dila-tation coefficient of +1 x 10"3 (°C)_1 for the arterial wall, +2 x 10~3 (°C)_1 for the atheromatous plaque (both under normal physiological pressures), and rough value of Ep equal to 600 kPa (deduced from the
tests on atheromatous plaques shown in Fig. 5 by averaging their slopes), the mean shear stresses devel-oped at the plaque-vessel interface are:
x0 > 2- (op - as)ATEp = 1.2 kPa (°C)_1 AT(B/L) (13) which for B/L « 0.2 (a figure based on our measure-ments) and AT = 4 °C yields x0 > 960 Pa. This stress level is much higher than shear stresses due to blood flow (about 1-3 Pa) and it is considered enough to promote the detachment of the plaque.
In other words, the results of this work show that an increase of corporal temperature generates shear stresses between the plaque and the arterial wall that could be much higher than those produced by normal blood flow. In addition, the fact that the atheromatous plaque has a higher dilatation coefficient than the arterial wall generates a compressive stress state that increases plaque instability, leading eventually to the buckling of this structure.
Fatigue may be one of the mechanisms that might play a role in plaque rupture; fatigue is induced by repetitive loading, and is a symptomatically quiescent but potentially progressive failure process, which can result in sudden fracture at stress levels much lower than the critical stress. Moreover, repeated febrile processes give rise to additional large fatigue loads that can increase the risk of plaque debonding.
The formation of a platelet-rich thrombus takes place at the site of plaque disruption, but not all rup-tured plaques result in thrombosis. In fact, post-mortem studies in patients with ACS revealed that on most occasions thrombi are made of platelets and fibrin or composed of layers of different age, suggest-ing a gradual formation and recurrences of weak thrombogenic stimuli. This implies that subjects may be frequently exposed to potential triggers and that the levels of biochemical markers can be increased without an inevitable acute morbid event.
In this context, increases in corporal temperature would not be necessarily accompanied by an adverse event, but could contribute to the progressive
weak-ening of the atheromatous plaque, making it prone to rupturing under lower levels of mechanical stress and/ or other triggering agents.
ACKNOWLEDGMENTS
The authors gratefully acknowledge financial sup-port for this work provided by the Ministerio de Ciencia y Tecnologia (Spain) through projects MAT 2003-04906 and MAT 2005-06320, and by the Comunidad de Madrid through program ESTRUMAT-CM (reference MAT/77).
REFERENCES
Ammann, P., S. Marschall, M. Kraus, L. Schmid, W. Angehrn, R. Krapf, and H. Rickli. Characteristics and prognosis of myocardial infarction in patients with normal coronary arteries. Chest 117:333-338, 2000.
Bailey, J. M. Elasticity and tensile strength of normal and atherosclerotic rabbit aorta. /. Atheroscler. Res. 5:112-119, 1965.
Bainton, D., G. R. Jones, and D. Hole. Influenza and ischaemic heart disease - a possible trigger for acute myocardial infarction? Int. J. Epidemiol. l:Ti\-2i9, 1978. Bank, A. J., A. Versluis, S. M. Dodge, and W. H. Douglas. Atherosclerotic plaque rupture: A fatigue process? Med. Hypotheses 55:480-484, 2000.
Casscells, W., B. Hathorn, M. David, T. Krabach, W. K. Vaughn, H. A. McAllister, G. Bearman, and J. T. Willerson. Thermal detection of cellular infiltrates in living athero-sclerotic plaques: possible implications for plaque rupture and thrombosis. Lancet 347:1447-1451, 1996.
Cox, H. L. The elasticity and strength of paper and other fibrous materials. Br. J. Appl. Phys. 3:72-79, 1952. Davies, M. J. Stability and instability: two faces of coro-nary atherosclerosis. The Paul Dudley white lecture 1995. Circulation 94:2013-2020, 1996.
Falk, E. Why do plaques rupture? Circulation 86:11130^-2, 1992.
Fayad, Z. A., and V. Fuster. Clinical imaging of the high-risk or vulnerable atherosclerotic plaque. Circ. Res. 89:305-316, 2001.
Gibson, C M., L. Diaz, K. Kandarpa, F. M. Sacks, R. C. Pasternak, T. Sandor, C Feldman, and P. H. Stone. Relation of vessel wall shear stress to atherosclerosis pro-gression in human coronary arteries. Arterioscler. Thromb. 13:310-315, 1993.
Gidron, Y., H. Gilutz, R. Berger, and M. Huleihel. Molecular and cellular interface between behavior and icute coronary syndromes. Cardiovasc. Res. 56:15-21, 2002.
Guinea, G. V., J. M. Atienza, M. Elices, P. Aragoncillo, ind K. Hayashi. Thermomechanical behavior of human :arotid arteries in the passive state. Am. J. Physiol. Heart Circ. Physiol. 288:H2940-H2945, 2005.
and planned percutaneous coronary interventions (fluvacs).
Eur. Heart J. 25:25-31, 2004.
Hayashi, K., K. Ide, and T. Matsumoto. Aortic walls in atherosclerotic rabbits - mechanical study. /. Biomech.
Eng. 116:284-293, 1994.
Hayashi, K., and Y. Imai. Tensile property of atheroma-tous plaque and an analysis of stress in atherosclerotic wall. /. Biomech. 30:573-579, 1997.
Kelly, A., and W. R. Tyson. Tensile properties of fibre-reinforced metals - copper/tungsten and copper/ molybdenum. /. Mech. Phys. Solids 13:329-350, 1965. Lavallee, P., V. Perchaud, M. Gautier-Bertrand, D. Grabli, and P. Amarenco.. Association between influenza vacci-nation and reduced risk of brain infarction. Stroke 33:513-518, 2002.
Lin, S. G., X. Y. Yu, Y. X. Chen, X. R. Huang, C. Metz, R. Bucala, C. P. Lau, and H. Y. Lan. De novo expression of macrophage migration inhibitory factor in atherogenesis in rabbits. Circ. Res. 87:1202-1208, 2000.
Madjid, M., M. Naghavi, B. A. Malik, S. Litovsky, J. T. WiUerson, and W. Casscells. Thermal detection of vulner-able plaque. Am. J. Cardiol. 90:36L-39L, 2002.
Maseri, A., and V. Fuster. Is there a vulnerable plaque?
Circulation 107:2068-2071, 2003.
Meyers, D. G. Myocardial infarction, stroke, and sudden cardiac death may be prevented by influenza vaccination.
Curr. Atheroscler. Rep. 5:146-149, 2003.
Naghavi, M., P. Libby, E. Falk, S. W. Casscells, S. Litovsky, J. Rumberger, J. J. Badimon, C. Stefanadis, P. Moreno, G. Pasterkamp, Z. Fayad, P. H. Stone, S. Waxman, P. Raggi, M. Madjid, A. Zarrabi, A. Burke, C. Yuan, P. J. Fitzgerald, D. S. Siscovick, C. L. de Korte, M. Aikawa, K. E. J. Airaksinen, G. Assmann, C. R. Becker, J. H. Chesebro, A. Farb, Z. S. Galis, C. Jackson, I. K. Jang, W. Koenig, R. A. Lodder, K. March, J. Demirovic, M. Navab, S. G. Priori, M. D. Rekhter, R. Bahr, S. M. Grundy, R. Mehran, A. Colombo, E. Boerwinkle, C Ballantyne, W. Insull, R. S. Schwartz, R. Vogel, P. W. Serruys, G. K. Hansson, D. P. Faxon, S. Kaul, H. Drexler, P. Greenland, J. E. Muller, R. Virmani, P. M. Ridker, D. P. Zipes, P. K. Shah, and J. T. WiUerson. From vulnerable plaque to vulnerable patient - a call for new definitions and risk assessment strategies: Part I.
Circulation 108:1664-1672, 2003.
Naghavi, M., P. Libby, E. Falk, S. W. Casscells, S. Litovsky, J. Rumberger, J. J. Badimon, C. Stefanadis,
P. Moreno, G. Pasterkamp, Z. Fayad, P. H. Stone, S. Waxman, P. Raggi, M. Madjid, A. Zarrabi, A. Burke, C. Yuan, P. J. Fitzgerald, D. S. Siscovick, C. L. de Korte, M. Aikawa, K. E. J. Airaksinen, G. Assmann, C. R. Becker, J. H. Chesebro, A. Farb, Z. S. Galis, C Jackson, I. K. Jang, W. Koenig, R. A. Lodder, K. March, J. Demirovic, M. Navab, S. G. Priori, M. D. Rekhter, R. Bahr, S. M. Grundy, R. Mehran, A. Colombo, E. Boer-winkle, C. Ballantyne, W. Insull, R. S. Schwartz, R. Vogel, P. W. Serruys, G. K. Hansson, D. P. Faxon, S. Kaul, H. Drexler, P. Greenland, J. E. Muller, R. Virmani, P. M. Ridker, D. P. Zipes, P. K. Shah, and J. T. WiUerson. From vulnerable plaque to vulnerable patient - a call for new definitions and risk assessment strategies: Part II.
Circula-tion 108:1772-1778, 2003.
Naghavi, M., P. Wyde, S. Litovsky, M. Madjid, A. Akhtar, S. Naguib, M. S. Siadaty, S. Sanati, and W. Casscells. Influenza infection exerts prominent inflammatory and thrombotic effects on the atherosclerotic plaques of apoli-poprotein e-deficient mice. Circulation 107:762-768, 2003. Rekhter, M. D., G. W. Hicks, D. W. Brammer, C. W. Work, J. S. Kim, D. Gordon, J. A. Keiser, and M. J. Ryan. Animal model that mimics atherosclerotic plaque rupture.
Circ. Res. 83:705-713, 1998.
Sanmartin, M., J. Goicolea, C. Garcia, J. Garcia, A. Crespo, J. Rodriguez, and J. M. Goicolea. Influence of shear stress on in-stent restenosis: in vivo study using 3d reconstruction and computational fluid dynamics. Rev.
Esp. Cardiol. 59:20-27, 2006.
Stefanadis, C, K. Toutouzas, E. Tsiamis, C. Stratos, M. Vavuranakis, I. Kallikazaros, D. Panagiotakos, and P. Toutouzas. Increased local temperature in human coronary atherosclerotic plaques: an independent predictor of clini-cal outcome in patients undergoing a percutaneous coro-nary intervention. /. Am. Coll. Cardiol. 37:1277-1283, 2001.
Timoshenko, S. Analysis of bi-metal thermostats. /. Opt.
Soc. Am. 11:233-255, 1925.
Versluis, A., A. J. Bank, and W. H. Douglas. Fatigue and plaque rupture in myocardial infarction. /. Biomech. 39:339-347, 2006.
Wang, K. P., Y. Y. Huang, A. Chandra, and K. X. Hu. Interfacial shear stress, peeling stress, and die cracking stress in trilayer electronic assemblies. IEEE Trans.