Experimental observations on hot-spots and derived
acceptance/rejection criteria
R. Moretón , E. Lorenzo, L. Narvarte
Abstract
The hot-spot phenomenon is a relatively frequent problem occurring in current photovoltaic generators. It entails both a risk for the photovoltaic module's lifetime and a decrease in its operational efficiency. Nevertheless, there is still a lack of widely accepted procedures for dealing with them in practice. This paper presents the IES-UPM observations on 200 affected photovoltaic modules. Visual and infrared inspection, as well as electroluminescence, peak power rating and operating voltage tests have been carried out. Thermography under steady state conditions and photovoltaic module operating voltage, both at normal photovoltaic system operating conditions, are the selected methods to deal in practice with hot-spots. The temperature difference between the hot-spot and its surround-ings, and the operating voltage differences between affected and non-affected photovoltaic modules are the base for establishing defective criteria, at the lights of both lifetime and operating efficiency considerations. Hot-spots temperature gradients larger than 20 °C, in any case, and larger than 10 °C when, at the same time, voltage operating losses are larger than the allowable power losses fixed at the pho-tovoltaic module warranties, are proposed as rejecting conditions for routine inspections under contractual frameworks. The upper threshold of 20 °C is deduced for temperate climates from the basic criterion of keeping absolute hot-spot temperatures below 20 °C.
Keywords: Hot-spot; PV module lifetime; PV module efficiency; Operation losses
1. Introduction
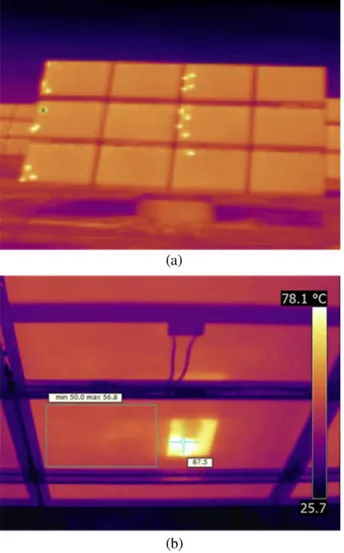
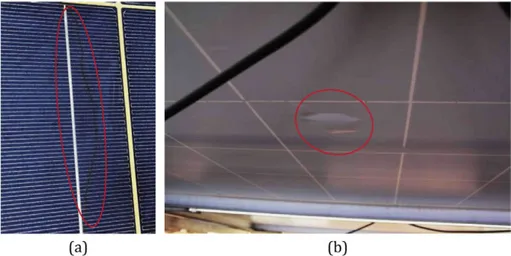
A hotspot consists of a localized overheating in a p h o -tovoltaic (PV) module. It appears when, due to some anomaly, the short circuit current of the affected cell becomes lower t h a n the operating current of the whole, giv-ing rise to reverse biasgiv-ing, thus dissipatgiv-ing the power gen-erated by other cells as heat. Fig. 1 shows two infrared (IR) images of hot-spots. The anomalies t h a t cause hot-spots can be external to the PV module: shading
(Alonso-García et al., 2003; H e r r m a n n et al., 1997; Molenbroek et a l , 1991) or dust (Lorenzo et a l , 2014);
Fig. 1. IR images of hot-spots, (a) General view of a PV array with hot-spots caused by potential induced degradation (suggested by the appearance of a regular pattern), (b) Hot-spot in a PV module caused by micro-cracks. The operating temperature at the hot-spot is 87 °C while the mean temperature of the rest of the module is 53 °C, which represents a temperature difference of 34 °C.
Hot-spots are relatively frequent in current PV genera-tors and this situation will likely persist as the PV module technology is evolving to thinner wafers, which are prone to developing micro-cracks during the manipulation pro-cesses (manufacturing, transport, installation, etc.) (Chaturvedi et al., 2013; Gabor et al., 2006; Grunow et al., 2005; Kajari-Schroder et al., 2011; Kontges et al., 2011). Fortunately, they can be easily detected through IR inspection, which has become a common practice in current PV installations (Auer et al., 2007; Botsaris and Tsanakas, 2010; Buerhop et al., 2011a,b,2012; Hoyer and Buerhop, 2008; Kasemann et al., 2009; King et al., 2000; Muñoz et al., 2011). However, the impacts of hot-spots on operational efficiency and lifetime have been scarcely addressed, which helps to explain why there is a lack of widely accepted procedures for dealing with hot-spots in practice as well as specific criteria referring to the accep-tance or rejection of affected PV modules in commercial frameworks. For example, the hot-spot resistance test
included in IEC-61215 (Crystalline silicon terrestrial photo-voltaic modules. Design qualification and type approval) is successfully passed if the module resists the hot-spot condi-tion for a period of 5 h, which suggests that this standard addresses transitory hot-spots, as those caused by also transitory shading, but not permanent ones, caused by internal module defects (IEC, 1995). Along the same lines, the IEC-62446 (Grid connected photovoltaic systems. Minimum requirements for system documentation, com-missioning tests and inspection) only states: "A hot-spot elsewhere in a module usually indicates an electric problem [...] In any case investigate the performance of all modules that show significant hot-spots" (IEC, 2009). Furthermore, a draft of the IES-60904-12 (Photovoltaic devices: infrared thermography of photovoltaic modules) clearly establishes how to capture, process and analyze the IR images, but still does not set out any PV module acceptance/rejection crite-ria (IEC, 2014). The Instituto de Energía Solar -Universidad Politécnica de Madrid (IES-UPM) experience includes many cases of actors in the PV sector, mainly module manufacturers and engineering, procurement and construction companies (EPCC), requesting advice on how to proceed with collections of IR images of affected modules, and whose corresponding contracts lacked the foresight to pose a relevant question: which ones of the affected PV modules should be replaced under the PV man-ufacturer's responsibility?
The purpose of this paper is to suggest a protocol for the effective treatment of hot-spots in the field, addressing both the lifetime and the operational efficiency of the PV ules. Starting from the observations of 200 affected mod-ules (at two PV plants at Cuenca and Cáceres, Spain) as experimental support, hot-spot observation procedures and well defined acceptance/rejection criteria are proposed,
- T
~±
|
^ V
k
J /
1
i
\ .
V
\ \
V
>
9
Non defective cells
i
lc \,
hc,D \
\ Defective j \
\ c d l \ \
Y \
VND V
w
0>]oriented to their possible application in contractual frameworks.
2. Fundamentals of hot-spots
For explanation purposes, we first consider the case of a group of n identical solar cells, associated in series and pro-tected by a by-pass diode (Fig. 2a). The operating condi-tions: incident irradiance, G, operating cell temperature,
T& and polarization voltage, V, are such that a certain
cur-rent, I & is circulating through these cells. A hot-spot
appears in a cell (Fig. 2b) when some defect
(micro-crack, shade, etc.) reduces its corresponding short circuit current, hc,T>, SO that
/SC,D <IC (1)
which forces the cell to operate at a negative voltage,
Vn = - ( / i - 1)KND + V (2)
where subscripts " D " and " N D " refer, respectively, to defective and non-defective cells. Consequent power dissi-pation heats the defective cell, giving rise to a hot-spot, characterized by the temperature increase of this cell in relation to the non-defective ones, ATHS. In what follows,
we will refer to this value as the "hot-spot temperature". The by-pass diode assures V ^ 0, thus limiting the negative biasing and the power dissipation in this cell. Obviously, the maximum hot-spot temperature is then attained when the group is short-circuited or, which is nearly the same, when the bypass-diode is ON. Note that ATHS is directly
related to the product Ic x rD. In other words, hot-spot
temperature mainly depends on the operating voltage and incident irradiance (which modulates Ic), on the defect
gravity (which determines 7SC,D) and on the second quad-rant I-V characteristic of the defective cell (which modu-lates V-D). AS this characteristic can substantially differ
Voltage (V)
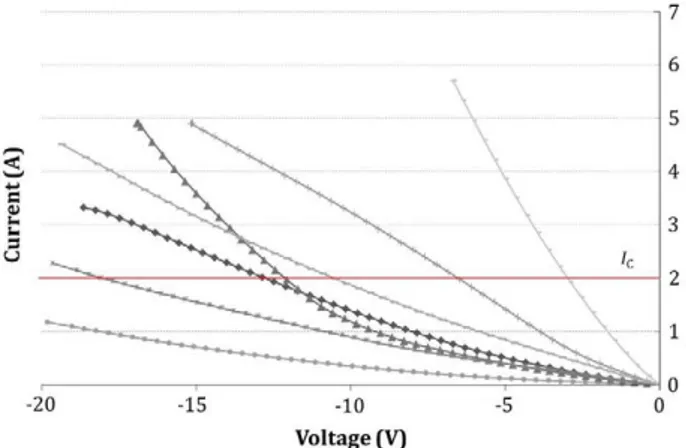
Fig. 3. Second quadrant / - V characteristics of 7 individual cells of a same PV module (Alonso-García and Ruiz, 2006). The great dispersion in the second quadrant behavior is notorious. If any of these cells were defective, and considering the value indicated by the horizontal continuous line as the operating current (imposed by the non-defective cells), it can be observed that the derived dissipated power varies about one order of magnitude depending on the particular affected cell.
from one cell to another, even within the same PV module (Alonso-García and Ruiz, 2006), the hot-spot temperature also depends on the particular defective cell. As a represen-tative example, Fig. 3 shows the second quadrant I-V curves of 7 individual solar cells of a same PV module mea-sured by Alonso-García and Ruiz (2006). It can be observed that power dissipation at a hot-spot can vary nearly an order of magnitude depending on the defective cell (Alonso-García and Ruiz, 2006; Alonso-García et al., 2003; Herrmann et al., 1997,1998; Muñoz et al., 2011).
The hot-spot temperature can be easily estimated on the assumptions that n > 1 and that heat is homogeneously dissipated over the solar cell surface. Then, it is rather straightforward to deduce that
where S is the solar cell surface and CT a thermal
dissipa-tion coefficient that can be estimated from the Nominal Operation Cell Temperature (NOCT):
_ NOCT (°C) - 20
1'~ 800 W/m2
For example, NOCT = 47 °C, S = 225 cm2, Ic = 6 A and
VD = 10 V lead to CT = 0.036 ° C / ( $ ) and ATHS = 96 °C.
However, this is of scarce practical value because heat dissipation is rarely homogeneous over the cell surface, as can be clearly observed in Fig. lb. Obviously, any non-homogeneity translates into ATHS increase, thus
wors-ening the case. More detailed explanations on the relation between power and temperature are found in the literature (Buerhop et al., 2011b; Hoyer et al., 2009).
Now, let us consider the case of a PV module made up of three series associated groups, each made up of n cells and a bypass diode (Fig. 4a). Note that many currently commercial PV modules respond to this configuration, with n ranging typically from 18 to 24. A defective cell like the one described above does not reduce now the PV mod-ule sort-circuit current but becomes an anomalous step in the first quadrant of the I-V and P-V curves (Fig. 4b).
Again, ATHS depends on the operating voltage of the
concerned group, which, in turn, depends on the operating voltage of the PV module. The voltage at the step marks the bypass diode turning ON, and ATHS reaches its
maxi-mum for the voltage range below this step. Fig. 5 shows examples of I-V curves of real modules affected by hot-spots. It is worth noting that current at the maximum power point of the defective module, 7M,D, is always lower than that corresponding to the non-defective ones, 7M,ND:
^M,D < ^M,ND (3)
Fig. 4. (a) Electrical scheme of a PV module with 3 groups, each of them made up of n cells and a by-pass diode, (b) I-Vand P-V curves of a non-defective (blue) and a defective (red) module. The difference in the current at the maximum power point between the defective module, 7M,D, and the non-defective module, JM,ND, can be observed. (For interpretation of the references to colour in this figure legend, the reader is referred to the web version of this article.)
series, the closer the operating current will be to 7M,ND- In this situation, the operating voltage of the defective module is well below that corresponding to its MPP. The important thing to remember is that the power loss of a defective PV module is much larger when it works associated to other non-defective modules than when it works alone. A practi-cal consequence of the latter is that this module could pass the standard warranty conditions (referring to the maxi-mum power of the module alone) while failing to deliver the power in practice.
Fig. 6 helps us to understand a hot-spot derived phe-nomenon related to the operating voltage of the PV mod-ules. This fact results from the typical slight current excursion caused by the inverter MPP tracking algorithm, when a defective PV module is integrated into a string with a large number of non-defective ones. Associated voltage excursions in the defective module are much larger than that corresponding to the non-defective ones. Note that the operating voltage differences between defective and non-defective modules, AVHS, also fluctuate following the
MPP search. It is worth mentioning that such voltage dif-ferences can be easily understood as direct power losses, as the current is common to all the modules in the string.
In turn, these voltage fluctuations translate into ATHS
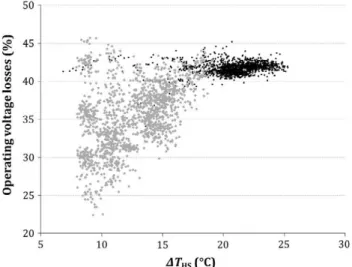
fluctuations. This is visible in Fig. 7, which shows the records, every 5 s, of AVHs, versus ATHS for one particular
defective module at the Cáceres PV plant (measurement details are explained later) over a period of one day. Black dots represent the moments with high and stable irradiance, while gray diamonds refer to unstable or low irradiance periods. Large instability is observed during low and variable irradiance moments (which is obviously
also associated to the low ATHS region, below 20 °C) when
the MPP algorithms are prone to instability. However, the relationship between AVHS, and ATHS becomes essentially
stable in the high irradiance (and so high ATHS) region,
where most of the energy is generated.
These phenomena can also be observed in Fig. 8, which shows the simultaneous records of the in-plane irradiance (black line) and the operating voltages of 3 modules of the same string (one non-defective, blue dots; and two defective, red and yellow dots). Large voltage excursions in the defective modules become evident. This observation was made at the Cáceres PV plant, at a system with one-axis azimuthal tracking affected by clouds, what explains the evolution of the incident irradiance. The con-sidered string was composed of 22 PV modules associated in series. Two of these modules were affected by hot-spots while the others were not.
20
Voltage (V)
20 30
Voltage (V)
Voltage (V)
Fig. 6. I-V curves of a non-defective (blue) and a defective (red) module. The maximum power points are marked for each module. It is assumed that the defective module is connected in series with a large number of non-defective ones and the resulting string is connected to an inverter able to impose the maximum power point. Because of the disproportion between the number of defective and non-defective modules, the operation current of the whole string is close to that corresponding to the maximum power of a non-defective module. Sinusoidal signal (1) represents the current oscillations around this value due to the MPP tracking strategy of the inverter. Sinusoidal signal (2) and (3) represent the corresponding voltage oscillations at a non-defective and at the defective modules. Voltage excursions are clearly greater in the defective module. The defective module does not only produce less power but also fluctuates more in operating voltage. (For interpretation of the references to colour in this figure legend, the reader is referred to the web version of this article.)
Fig. 5. (a) I-V and P-V curves of a non-defective (blue and green) module and of a defective module (red and black) affected by a fill-factor loss (b) / - V and P- V curves of a non-defective (blue and green) module and of a defective (red and black) module with a "step" anomaly. (For interpre-tation of the references to colour in this figure legend, the reader is referred to the web version of this article.)
defective diode, the sum of the voltage of all the cells pro-tected by it is null, leading some cells becoming positive biased and others becoming negative biased. In this situa-tion, the latter are slightly hotter than the former. Fig. 9 shows an example of a PV module with a conducting by-pass diode measured at the IES-UPM facilities. Obviously, despite the temperature difference remaining low, such a module loses effective power, at a ratio equal to the number of defective diodes divided by the total num-ber of diodes.
50
45
40
a 35 H
bJD
=
B 30
2
01 a
o 25
20
- J & * v ••
10 15 20
dTHS(°C)
25 30
3. Experimental data
Fig. 7. Operating voltage losses of a defective PV module respect to a non-defective one, AVHS, versus corresponding hot-spot temperature, ATHS.
The MPP tracking algorithm makes AVHS fluctuate at low irradiance.
In this work, we have analyzed a sample of 200 defective PV modules from two PV plants located at Cuenca and Cáceres (Spain): respectively, 122 poly-crystalline silicon modules from one single manufacturer (p-Sil) and 78 mono and poly-crystalline silicon modules from two man-ufacturers (m-Si and p-Si2). These defective modules were selected on the basis of a previous IR report made by the maintenance personnel of the PV plants. Then, we carried
Fig. 8. Evolution of the operating voltage of three modules in the same string. From top to bottom: a reference non-defective module (blue) and two modules (red and yellow) with hot-spots of, respectively, medium and severe gravity. In black, the corresponding evolution of the incident irradiance. (For interpretation of the references to colour in this figure legend, the reader is referred to the web version of this article.)
was carried out on June 2013 and the tests performed by the IES-UPM on January 2014. The process was similar for the Cáceres PV plant (8 MW). The operation start-up was in September 2008 and the modules with hot-spot tem-perature larger than 30 °C were first substituted on June 2010. Then, a new IR inspection lead to the detection of the 78 defective modules on July 2012 and, finally, the com-plete IES-UPM tests were carried out on May 2013. It is worth noting that, in the case of the Cuenca PV plant, the initial IR inspection was made in summer while the tests were carried out the following winter, while in the case of the Cáceres PV plant both inspections took place near the summer months. We will later discuss the consequences of these differences.
4. Method
4.1. Visual inspection
A detailed visual check was performed to all the con-cerned PV modules in order to find observable defects.
4.2. Infrared inspection
The IR images were obtained by means of an infrared camera (FLIR-Infracam, 7.5-13 (im), directly in the field, during normal operation and respecting the conditions sug-gested by the IEA-PVPS-Task 13 experts (IEA, 2014): sunny cloudless days, a minimum incident irradiance of 700 W/m2 and an angle of view to the module glass plane
not lower than 60°. As the relevant parameter in this test is more the temperature difference than the absolute tem-perature value, imaging can be done at either the front or the back of the module. Just for convenience, we did all of them at the rear. Because of the aforementioned depen-dence on ATHS with irradiance, it is appropriate to
charac-terize hot-spots through a value normalized to the standard irradiance, G* = 1000 W/m2:
An
ATh G*where * stands for the Standard Test Conditions (STC). Up to now, there has not been a widely accepted correla-tion for considering this effect on the heating of PV mod-ules (IEC, 2014). Nevertheless, we think that there is a certain advantage of assuming that the hot-spot tempera-ture is proportional to the incident irradiance. Non-linearities in the ATHS — G relationship are likely to
be small for the relatively narrow irradiance range defined by G > 700 W/m2, which is the condition that we have
imposed on our IR images.
4.3. Electroluminescence
The objective of this test is to analyze the correlation between the portion of isolated area of a cell affected by micro-cracks and the magnitude of hot-spots. The analyses were carried out directly in the field during night using an EL camera (pco.1300 solar, 1.3 (im) and a power source (TTi EX752 M). Each module was polarized in the fourth quadrant at 25% of the STC rated short circuit current. The experiment was carried out in January 2014 and applied only to a smaller sample of 35 PV modules in the
Cuenca PV plant, due to the difficulties of implementing this test on site. We have followed the crack type classifica-tion proposed by Kontges et al. (2011), dividing the affected cells into C-type (those exhibiting only background noise for the inactive cell part) and B-type (those exhibiting a reduced intensity but higher than the background noise).
4.4. Electrical inspection: power rating
The individual I-V curves of the affected PV modules were obtained with a commercial I-V tracer (Tritec Tri-ka) and extrapolated to STC in accordance with the IEC-60891 (procedure 1), using the current and voltage temperature coefficients given by the manufacturer. The incident irradiance and the operating cell temperature were measured by means of a previously calibrated module of the same technology, used as reference.
4.5. Electrical inspection: operating voltage
25 i
20
15
10
1
-HI I I I
0 5 10 15 20 25 30 35 40 45 50 55 60 65
Fig. 11. Frequency distribution of the hot-spot temperature for PV modules affected by hot-spots in January 2014 in the Cuenca PV plant. Modules with AT'HS > 30 °C were first replaced in March 2013. Hence, the
tail of the distribution reflects those modules with AT*HS > 30 °C in March
2013 which, due to the hot-spot evolution, have moved to the region beyond 30 °C a year later. This is a clear example of hot-spot worsening over time.
The operating voltage of the PV module, when working within the PV array, was measured by simply inserting "T" connectors into the module output wires. Then, it was pos-sible to compare the voltage at which the different modules (affected and not affected by hot-spots) were working, as shown in Figs. 7 and 8. The voltage losses as regards the non-defective modules can be understood directly as power losses, as the current is common for all the modules con-nected in series.
5. Results
5.1. Visual inspection
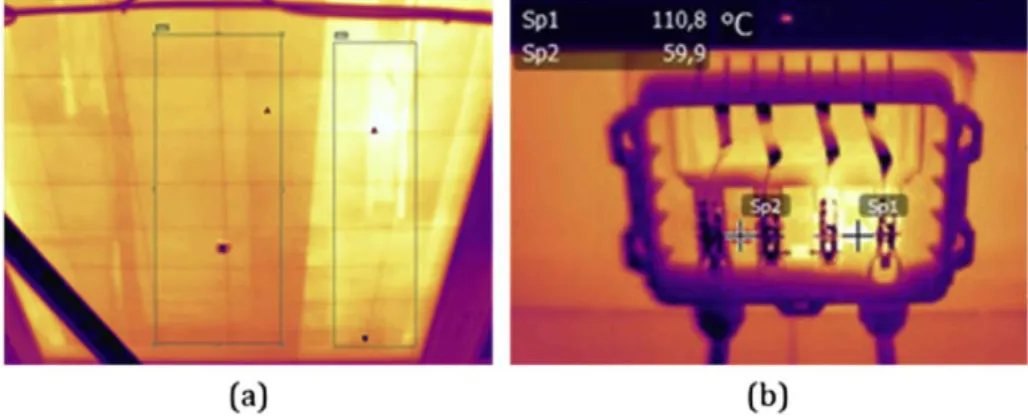
Fig. 10 shows examples of visible defects, where micro-cracks cause a current drift and a corresponding heat that leads to the burning of the metallization fingers and to bubbles at the rear of the modules. However, we found observable defects in only a 19% of the concerned
PV modules, which is a too weak correlation for consider-ing visual defects as a basis for dealconsider-ing with hot-spots.
5.2. Infrared inspection
Fig. 11 shows the frequency distribution of AT*HS derived
from the IR inspection performed in the Cuenca PV plant in January 2014. It must be noted that it does not reflect the total hot-spot occurrence in the PV plant, but only the hot-spots observed some months after the substitution, mentioned above, of all the modules with AT*HS > 30 °C.
Hence, as the distribution just after this substitution was supposed to have no elements beyond this value, the appearance of a tail in the distribution is a clear symptom of hot-spot evolution over time (it reflects those modules with AT*HS < 30 °C in March 2013 which have moved to
the region beyond 30 °C some months later).
(a) 80
( u ro
H O
r-j
>» 03 s
b~
ri
60
50
40 30
/!>
10
•
y =
R2
1.12x = 0.47
•
.
'...J^
'
S
S^ i
• • •
•
v\
10 20 30 40
dr„s- July 2012 (°C)
SO 60
(b) 60
50
e
I"
Í"
' 20
"=1 .„
•
p * • #
:.••;:•«• V •
•
».
• •
• • •
#
• * •
y = 0.78x R2 = 0.17
0 10 20 30 40 50 60
drHS-June 2013 (°C)
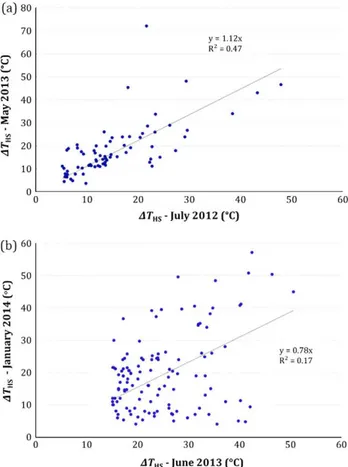
Fig. 12. Hot-spot temperature evolution for (a) the Cáceres PV plant and (b) the Cuenca PV plant. Each point corresponds to a particular module and represents the measure of AT*HS at the beginning and at the end of the
experimental period. At the Cáceres PV plant (a), both moments correspond to months with high ambient temperatures. A general AT*HS
increase over time is noticeable (slope coefficient >1). On the other hand, at the Cuenca PV plant (b), the final measurement corresponds to a cold winter month while the initial measurement corresponds to a hot summer month. In this case, an average AT*HS decrease can be observed (slope
coefficient <1). This difference between tendencies suggests a fluctuation of hot-spots during the year due to seasonal effects.
On the other hand, we did not observe any PID phe-nomena (which, as observed in Fig. la, typically lead to a recognizable spatial pattern), thus hot-spots were likely to be caused by internal defects, mostly micro-cracks. In this case, the hot-spot temperature depends on the temperature of the module, as the thermal stress affects the contact resis-tance between the two sides of the crack. Hence, an evolu-tion of T*HS is to be expected over the year, being larger in
summer than in winter, due to a larger expansion. This thermal cycling, also occurring at a daily level, typically entails degeneration, what leads to a probable worsening of hot-spots over time, as it is observed in the figure. However, these are not absolute rules. Each micro-crack is somewhat unique and even an improvement with ther-mal cycling can be observed (Kontges et al., 2011).
Fig. 12 shows the combined result of these effects. Each point in the graph describes the observed T*HS at two
differ-ent momdiffer-ents. Fig. 12a shows the evolution at the Cáceres PV plant between July 2012 (average ambient temperature,
Fig. 13. (a) Example of an electroluminescence image of a PV module affected by a hot-spot. The image was obtained in the field (obviously, during night). Two cells with appreciable isolated areas can be observed (nearly a 40% for the left-hand side cell - 20% B-type and 20% C-type crack - and almost 20% for the cell in the upper row - B type crack), (b) IR image of the same PV module. The average temperature of the module is 20.1 °C, the left-hand side cell shows a normalized hot-spot temperature of 14 °C while the normalized hot-spot temperature of the upper row cell is only 5 °C. The PV module only seems to present a hot-spot in the former case.
60
50
40
30
20
10
10 20 30
Isolated fraction area (%)
40 50
Fig. 14. Relation between the normalized hot-spot temperature AT"HS and
the fraction of area of a cell isolated by a crack. Squares and circles represent B-type and C-type cracks, respectively, in accordance with the Kontges et al. classification.
TA = 34 °C) and May 2013 (TA = 25 °C). All the modules
showing A.T*HS > 5 °C in July have been considered. Despite
the dispersion being high, on average, A.T*HS has increased
11%. Fig. 12b shows the case at the Cuenca PV plant between June 2013 (TA = 28°C) and January 2014
June have been considered on this occasion. Here, the aver-age AT*HS has decreased by 22%, in an example of seasonal
effects overcoming the degradation over time.
5.3. Electroluminescence
Fig. 13 shows an example of an EL image obtained in the field and Fig. 14 shows the relationship between the fraction of cell isolated by the micro-crack and the hot-spot temperature.
We observed that all the modules showing a hot-spot in the summer IR inspections had some micro-crack in the affected cell but none of the cells with B-type cracks gener-ated a hot-spot in winter. Besides, a proportional but very weak trend between the isolated area and AT*HS (R2 — 0.03)
was found, even in modules with C-type cracks. The relationship between the isolated fraction area and the power loss of the module, which remained also very weak
(R2 = 0.05), was also analyzed. A possible explanation to
these weak correlation is that the contact resistance between the two sides of the micro-crack varies with
(a) 30 20 S 15 U HI I 10 a. ™ 5 a. o (b)so g^ 40 • • y=0.26x R! = 0.11
. . . ' / ••¡•XT 10 • • ¡jr~* • .'.' 20 t 30 • " 40 ^~^~^
WARRANTY LIMIT
•
50 60 70
ATHS'[°C)
30 5 o a a o it a. O 20 • • . « • » • •
• JS^^
/^'
*/^ *
y = 1.55x R2 = 0.38
WARRANTY LIMIT
10 15 20
Peak power loss (%)
25
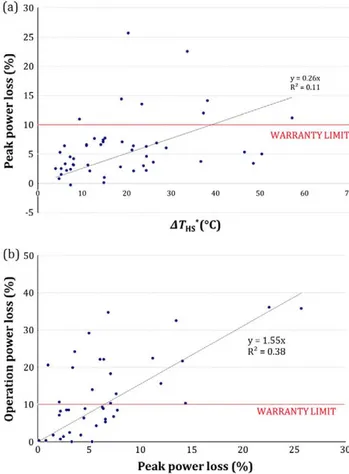
Fig. 15. (a) Relationship between the normalized hot-spot temperature and the power loss for 50 PV modules. Eight of them are out of warranty conditions, (b) Relationship between the power loss and the operating voltage loss (effective power loss). In this case, 19 modules do not comply with warranty requirements. As it can be observed, the effective power loss is much higher than the individual power loss, what makes the former a better parameter to measure the real effect of hot-spots in the module's performance.
module temperature and can thus be much larger during the day (when hot-spots are observed) than during the night (when EL images are obtained). Therefore, some areas can be miss-classified if attending to the EL results, leading to an incorrect estimation of the hot-spot problem. Whichever the case, EL images, despite being a very useful tool for quality control during the PV manufacturing pro-cesses, are not appealing for dealing with hot-spots in the field. Along similar lines, other authors have observed that the correlation between the number of cell cracks in a PV module and the power loss is very noisy (IEA, 2014).
5.4. Electrical inspections: power rating and operating voltage
Around 53%> of the modules presented some anomalies in the I-Vcurve, as steps or an abnormally low fill factor. Fig. 15a shows the relationship between A.T*HS and the
power loss with respect to the manufacturer's flash value, for 50 PV modules of the Cuenca PV plant. A high spread can be observed as well as the fact that most of the modules satisfied the usual power warranty condition (typically, 90%> of the nominal rated power output after 10 years). However, this is scarcely representative of their in-field behavior, which is better appreciated through the operating voltage of the module, when working within the PV array. Fig. 15b shows the relationship between the power loss and the operating voltage loss for the same 50 modules. As can be observed, the effective losses are 55%> higher than the power losses when considering the module alone.
Two key observations can be outlined. First, the stan-dard peak power is not a good indicator of the energy pro-duction capacity of defective modules, so that it must be disregarded for dealing with hot-spots. Second, the correla-tion between A.T*HS and A.V*HS and thus, power losses during
operation, is positive, but the large dispersion does not allow the correlation at individual levels to be applied. In other words, the power loss of a defective module must be deduced from direct voltage measurements not from
30 40 50 80
thermal observations. Apart from that, Fig. 16 shows the relationship between the normalized hot-spot temperature and the operating voltage loss for a more complete ensem-ble of the 113 PV modules of the three different manufac-turers (78 from the Cáceres PV plant and 35 from the Cuenca PV plant).
It can be observed that the behavior is not the same for every manufacturer (neither in the correlation slope nor in the spread around it). The correlation between operating voltage loss and normalized hot-spot temperature is stron-ger in the case of module p-Sil (R2 — 0.63) and weaker for
the cases of modules m-Si and p-Si2. These divergences likely reflect differences in the original material as well as non-uniform degradation affection due to different opera-tion times (3 years in the case of module p-Sil and 5 years for modules m-Si and p-Si2). Whichever the case, this behavior spread is not relevant here.
6. Discussion
Hot-spots threaten the PV module lifetime, as degrada-tion processes are generally accelerated by temperature. In particular, encapsulate discoloration and browning, and delamination (Jordan et al., 2012; Pern and Glick, 2000; Schlothauer et al., 2012). However, previous experiences do not allow a clear relation between module temperature and lifetime to be established (Osterwald and McMahon, 2009). Therefore, in order to set a maximum acceptable value, AT*HSMAX we must rely on intuitive but reasonable
approaches. We propose to consider 85 °C, which is the maximum temperature of the thermal cycling tests described in the IEC-61215, as the maximum absolute PV module temperature for acceptance/rejection purposes (Osterwald and McMahon, 2009). Then, AT*HSJUAX should
be thus so as to guarantee that the absolute temperature of the hot-spot remains below that limit. Obviously, the particular value of AT*HSMAX depends on the local climate
conditions. As an example, Fig. 17 shows the annual fre-quency distribution of the day-time operating temperature of non-defective PV modules in the Cuenca PV plant, which can be considered as representative of a temperate climate (characteristic of Southern Europe and some parts of USA, Australia or South America). The maximum cell temperature is 70 °C and the 99-percentile temperature is 65 °C. As these high temperatures are also associated to high irradiances, setting AT*HSMAX = 20 °C would limit the
time above 85 °C to around 40 h a year (1% of the daytime) for these climate conditions, which seems a reasonable commitment. Moreover, it avoids reaching 100 °C, which has been sometimes suggested as an absolute maximum for preventing early degradation (Lathrop et al., 1982). Therefore, AT*HSMAX = 20 °C could be reasonably
consid-ered as an upper limit for the normalized hot-spot temper-ature, at least in temperate climates.
On the other hand, it should be mentioned that slight temperature differences also appear in non-defective
.1
ll.
5 10 15 20 25 30 35 40 45 50 55 60 65 70 75
Cell temperature (°C)
Fig. 17. Annual frequency distribution of the operating temperature at the Cuenca PV plant. Only during a 1% of the daytime, temperatures are higher than 65 °C.
modules, mainly due to differences in heat dissipation. It is to be expected that the module will be hotter around the junction box than in the rest of it, as heat conduction to the surrounding environment is more difficult. It is also normal for the PV modules to see a temperature gradient at the edges and supports. Consequent temperature differ-ences of about 5 °C have been noted as typical (Buerhop et al., 2011a). Moreover, certain operating temperature dis-persion within the cells of a same module is attainable, as the cell operation voltage is not fully homogenous, even among non-defective cells. Based on the IES-UPM in-field experience, we propose AT*HSMAX = 10 °C (roughly,
4 °C due to possible voltage variations and 6 °C due to dis-sipation differences) as a minimum threshold to consider the PV module as possibly defective.
As regards energy losses, it seems logical to just extend the application of usual warranties to defective modules. Hence, it is proposed to reject any module exhibiting hot-spots whose corresponding voltage losses (in relation to a non-defective module being part of the same string), within the PV system in normal operation, exceeds the allowable peak power losses fixed at standard warranties. This is also applicable to PV modules with defective by-pass diodes, regardless the derived hot-spot temperature.
7. Proposal
The following procedure is proposed as a practical in-field approach to accomplish IR imaging inspection:
(1) Assure G > 700 W/m2 and an angle of view not less
than 60° to the module glass plane.
(2) Perform the analyses in summer, preferably on the hottest days.
(3) Normalize the hot-spot temperature, ATHS,
consider-ing a lineal relation with the irradiance.
(1) If ÁT*HS < 10 °C, to consider the module
non-defective, except in the case that one or more by-pass diodes are defective.
(2) If AT*HS < 20 °C, to consider the module defective.
(3) If 10 °C < T*HS < 20 °C, to consider defective all the
modules with an effective power loss (measured as a decrease in the operating voltage in relation to a non-defective module of the same string) that exceeds the allowable peak power losses fixed at standard warranties.
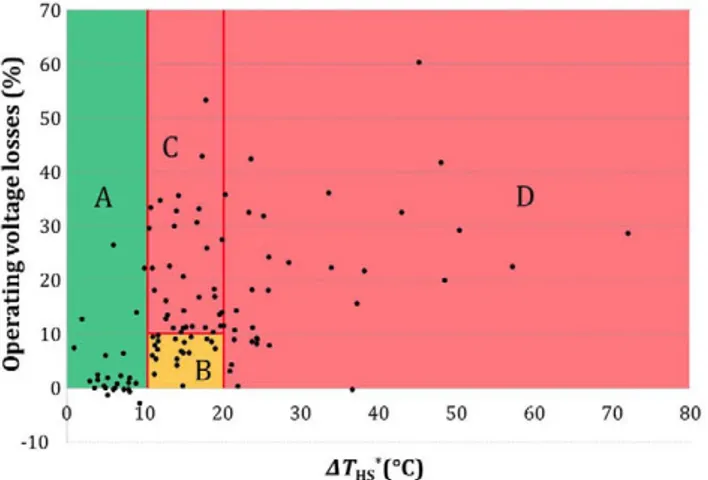
Fig. 18 shows the application of this proposal to the sample of modules tested in this work. In this case, manu-facturer warranty 90% of the nominal rated power output after 10 years, so 10% is the maximum allowable power loss. The figure is divided in 4 regions: A, B, C and D. Modules in region A are considered non-defective, because their hot-spot temperature is not relevant. The modules in regions C and D are considered defective due to low power and lifetime threatening temperatures, respectively. The case of the modules in region B is less straightforward, because these modules are possible candidates for a hot-spot problem, but this problem is not evolved enough to imply a significant power loss. Therefore, these modules are not rejected, but they should be inspected again after one year.
The here proposed restrictions for IR imaging inspec-tion assure that the modules are analyzed under the most unfavourable circumstances, trying to ease the classifying process. However, as observed in Fig. 18, almost a 20%> of the modules (those in region B) will be considered non-defective for the moment, as they are in a high uncer-tainty area. Even in the case in which all of them will be
70
?
6 o l
I \
°
I
u 40
oc A
a rt
¿- 30 C 20
.
* " • • •
H*
10 20 30 40 50 60 70 80
Fig. 18. Application of the proposed criteria to the sample of modules analyzed in previous sections. Modules in region "A" are considered non-defective, because their hot-spot temperature is not relevant. Modules in region "B" are considered non-defective, as the hot-spot is not evolved enough to imply a significant power loss, but they should be inspected again after one year. Modules in regions " C " and " D " are considered defective due to low power and lifetime threatening temperatures, respectively.
finally defective (type II error when establishing a null hypothesis that considers the module as defective), the method will have correctly classified the suspicious ele-ments in more than the 80%> of the cases. Furthermore, as the common practice in PV plants is to do an annual IR revision, those modules in the uncertainty region will be then reexamined and possibly classified as defective, as a result of the hot-spot worsening tendency over time, thus increasing the final effectiveness of the method. Other authors have also reached similar conclusions (Buerhop etal., 2011b).
Finally, it is worth mentioning that this procedure and these acceptance/rejection criteria have already been applied by the IES-UPM when mediating in conflicts between module manufacturers and EPC over hot-spots problems during the last years.
8. Conclusion
Although hot-spots are a relatively frequent phe-nomenon in current PV generators and will likely persist in the next years, there is still not a widely accepted refer-ence on how to face this problem within commercial frame-works. This paper has reviewed hot-spot related phenomena, paying particular attention to the fact that hot-spot appearance entails also operation voltage losses at the concerned PV module. Then, supported by experi-mental observations on 200 PV modules exhibiting hot-spots, the paper proposes a practical in-field approach to accomplish IR imaging inspection and straightforward acceptance and rejection criteria that address both the life-time and the operational efficiency of the modules. First, hot-spots are characterized by the temperature increase in relation with the surroundings of the affected solar cells and normalized to the STC irradiance (1000 W/m2).
Then, normalized hot-spot temperatures fewer than 10 °C are considered as not problematic, as they are caused by convective heat transfer and slight solar cells mismatch. On the other hand, those over 20 °C should imply a module rejection, as they entail significant probability of hot-spot absolute temperature exceed 85 °C. Those PV modules with hot-spot temperatures between 10 °C and 20 °C will be considered defective only if they have an effective power loss (measured as a decrease in the operating voltage in relation to a non-defective module of the same string) that exceeds the allowable peak power losses fixed at standard warranties.
Acknowledgements
The authors acknowledge Alonso MC et al. for their permission to use Fig. 3, and J. Leloux and JM. Carrillo for their fruitful contributions.
under the 7th Framework Program (Grant Agreement no. 308468).
References
Alonso-García, M.C., Ruiz, J.M., 2006. Analysis and modelling the reverse characteristic of photovoltaic cells. Sol. Energy Mater. Sol. Cells 90 (7), 1105-1120.
Alonso-García, M.C., Ruiz, J.M., Chenlo, F., 2003. Experimental study of mismatch and shading effects in the I-V characteristic of a photo-voltaic module. Sol. Energy Mater. Sol. Cells 90 (3), 329-340. Auer, R., Jahn, U., Buerhop-Lutz, C , 2007. Infrared analysis of PV
modules for improving quality. In: Proceedings of the 22nd EUPVSEC.
Berghold, J., Koch, S., Bottcher, A., Ukar, A., Leers, M., Grunow, P., 2013. Potential-induced degradation (PID) and its correlation with experience in the field. Photovoltaics Int., 85-92 (19th edition) Botsaris, P.N., Tsanakas, J.A., 2010. Infrared thermography as an
estimator technique of a photovoltaic module performance via operating temperature measurements. In: Proceedings of the 10th ECNDT Conference.
Brun, X.F., Melkote, S.N., 2009. Analysis of stresses and breakage of crystalline silicon wafers during handling and transport. Sol. Energy Mater. Sol. Cells 93 (8), 1238-1247.
Buerhop, C , Scheuerpflug, H., Weissmann, R., 2011a. The role of emissivity of glass on IR-imaging of PV-plants. In: Proceedings of the 26th EUPVSEC, pp. 3413-3416.
Buerhop, C , Schlegel, D., Vodermayer, C , Niess, M., 2011b. Quality control of PV-modules in the field using infrared-thermography. In: Proceedings of the 26th EUPVSEC, pp. 3894-3897.
Buerhop, C , Schlegel, D., Niess, M., Vodermayer, C , Weissmann, R., Brabec, C.J., 2012. Reliability of IR-imaging of PV-plants under operating conditions. Sol. Energy Mater. Sol. Cells 107, 154-164. http://dx.doi.Org/10.1016/j.solmat.2012.07.011.
Chaturvedi, P., Hoex, B., Walsh, T.M., 2013. Broken metal fingers in silicon wafer solar cells and PV modules. Sol. Energy Mater. Sol. Cells 108, 78-81.
Gabor, A.M., Ralli, M., Montminy, S., Alegría, L., Bordonaro, C , Woods, J., Felton, L., Davis, M., Atchley, B., Williams, T., 2006. Soldering induced damage to thin Si solar cells and detection of cracked cells in modules. In: Proceedings of the 21st European Photovoltaic Solar Energy Conference, pp. 2042-2047.
Garcia, M., Marroyo, L., Lorenzo, E., Marcos, J., Pérez, M., 2013. Observed degradation in PV plants affected by hot-spots. In: Progress in Photovoltaics: Research and applications, doi: 10.1002/pip.2393. Grunow, P., Clemens, P., Hoffmann, V., Litzenburger, B., Podlowski, L.,
2005. Influence of micro cracks in multi-crystalline silicon solar cells on the reliability of PV modules. In: Proceedings of the 20th EUPVSEC, pp. 2042-2047.
Hacke, P., Terwilliger, K., Glick, S., Trudell, D., Bosco, N., Johnston, S., Kurtz, S., 2010. Test-to-failure of crystalline silicon modules. In: 35th IEEE Photovoltaic Specialists Conference, pp. 244-250.
Herrmann, W., Wiesner, W., Vaassen, W., 1997. Hot-spot investigations on PV modules - New concepts for a test standard and consequences for module design with respect to by-pass diodes. In: 26th Photovoltaic Specialists Conference, pp. 1129-1132. doi: 10.1109/PVSC.1997. 654287.
Herrmann, W., Adrian, M., Wiesner, W., 1998. Operational behaviour of commercial solar cells under reverse biased conditions. In: Proceedings of the Second World Conference on Photovoltaic Solar Energy Conversion, pp. 2357-2359.
Hoyer, U , Buerhop, C , 2008. Electroluminiscence and infrared imaging for quality improvements of PV modules. In: Proceedings of the 23rd EUPVSEC, pp. 2913-2916.
Hoyer, U , Burkert, A., Auer, R., Buerhop, C , 2009. Analysis of PV modules by electroluminescence and IR thermography. In: Proceedings of the 24th EUPVSEC, pp. 3262-3266.
International Energy Agency (IEA), 2014. Review of failures of photo-voltaic modules. Photophoto-voltaic Power Systems Programme, Task 13. International Electrotechnical Commission (IEC), 1995. Standard 61215:
Crystalline silicon terrestrial photovoltaic (PV) modules - Design qualification and type approval.
International Electrotechnical Commission (IEC), 2009. Standard 62446: Grid connected photovoltaic systems. Minimum requirements for system documentation, commissioning tests and inspection.
International Electrotechnical Commission (IEC), 2014. Standard 60904-12: Infrared thermography of photovoltaic modules. Draft version. Jordan, D., Wohlgemuth, J., Kurtz, S., 2012. Technology and Climate
Trends in PV Module Degradation. In: Proceedings of the 27th EUPVSEC.
Kajari-Schroder, S., Kunze, I., Eitner, U , Kontges, M., 2011. Spatial and orientational distribution of cracks in crystalline PV modules gener-ated by mechanical load tests. Sol. Energy Mater. Sol. Cells 95, 3054-3059. http://dx.doi.Org/10.1016/j.solmat.2011.06.032.
Kasemann, M., Walter, B., Warta, W., 2009. Reliable hot-spot classifi-cation in 10 ms using ultra-fast lock-in thermography. Prog. Photovoltaics Res. Appl. 17 (7), 441^150. http://dx.doi.org/10.1002/ pip.901.
King, D.L., Kratochvil, J.A., Quintana, M.A., McMahon, T.J., 2000. Applications for infrared imaging equipment in photo-voltaic cell, module, and system testing. In: 28th Photophoto-voltaic Specialists Conference, pp. 1487-1490. doi: 10.1109/PVSC.2000. 916175.
Kontges, M., Kunze, I., Kajari-Schroder, S., Breitenmoser, X., Bjorneklett, 2011. The risk of power loss in crystalline silicon based PV modules due to micro-cracks. Sol. Energy Mater. Sol. Cells 95, 1131-1137. http://dx.doi.Org/10.1016/j.solmat.2010.10.034.
Lathrop, J.W., Davis, C.W., Royal, E., 1982. An accelerated stress testing program for determining the reliability sensitivity of silicon solar cells to encapsulation and metallization systems. In: Proceedings of the 16th IEEE PV Specialists Conference, pp. 1262-1267.
Lorenzo, E., Moretón, R., Luque, I., 2014. Dust effects on PV array performance: in-field observations with non-uniform patterns. Prog. Photovoltaics Res. Appl. 22 (6), 666-670.
Molenbroek, E., Waddington, D.W., Emery, K.A., 1991. Hot-spot susceptibility and testing of PV modules. In: Photovoltaic Specialists Conference. Conference Record of the Twenty Second IEEE, pp. 547-552.
Muñoz, J., Lorenzo, E., Martinez-Moreno, F., Marroyo, L., García, M., 2008. An investigation into hot-spots in two large scale PV plants. Prog. Photovoltaics Res. Appl. 16, 693-701. http://dx.doi.org/10.1002/ pip.844.
Muñoz, M.A., Alonso-García, M.C., Vela, N , Chenlo, F., 2011. Early degradation of silicon PV modules and guaranty conditions. Sol. Energy 85 (9), 2264-2274.
Osterwald, C.R., McMahon, T.J., 2009. History of accelerated and qualification testing of terrestrial photovoltaic modules: a literature review. Prog. Photovoltaics Res. Appl. 17 (1), 11-33.
Paggi, M., Sapora, A., 2013. Numerical modelling of microcracking in PV modules induced by thermo-mechanical loads. Energy Procedía 38, 506-515.
Paggi, M., Corrado, M., Rodriguez, M.A., 2013. A multi-physics and multi-scale numerical approach to microcracking and power-loss in photovoltaic modules. Compos. Struct. 95, 630-638.
Pern, F.J., Glick, S.H., 2000. Photothermal stability of encapsulated Si solar cells and encapsulation materials upon accelerated exposures. Sol. Energy Mater. Sol. Cells 61 (2), 153-188.
PV CROPS, 2012. Photovoltaic Cost reduction, Reliability, Operational Performance, Prediction and Simulation, European Commission FP7 project, <http://www.pvcrops.eu/>.
Radziemska, E., 2003. The effect of temperature on the power drop in crystalline silicon solar cells. Renewable Energy 28 (1), 1-12. Schlothauer, J., Jungwirth, S., Kohl, M., Roder, B., 2012. Degradation of
correlation to electroluminescence. Sol. Energy Mater. Sol. Cells 102, 75-85.
Simon, M., Meyer, E.L., 2010. Detection and analysis of hot-spot formation in solar cells. Sol. Energy Mater. Sol. Cells 94 (2), 106-113.
Solorzano, J., Egido, M.A., 2014. Hot-spot mitigation in PV arrays with distributed MPPT (DMPPT). Sol. Energy 101, 131-137.