Subjective Quality Study of Adaptive Streaming of
Monoscopic and Stereoscopic Video
Samira Tavakoli, Jesús Gutiérrez, and Narciso García
Abstract—Nowadays, HTTP adaptive streaming (HAS) has become a reliable distribution technology offering significant advantages in terms of both user perceived Quality of Experience (QoE) and resource utilization for content and network service providers. By trading-off the video quality, HAS is able to adapt to the available bandwidth and display requirements so that it can deliver the video content to a variety of devices over the Internet. However, until now there is not enough knowledge of how the adaptation techniques affect the end user's visual experience. Therefore, this paper presents a comparative analysis of different bitrate adaptation strategies in adaptive streaming of monoscopic and stereoscopic video. This has been done through a subjective experiment of testing the end-user response to the video quality variations, considering the visual comfort issue. The experimental outcomes have made a good insight into the factors that can influence on the QoE of different adaptation strategies.
Index Terms—Adaptive video streaming, QoE, subjective video quality assessment, 3D video, visual comfort.
I. INTRODUCTION
W
ITH the great evolution of video distribution through Internet and the emergence of different video display devices, watching videos is not limited to the traditional watching habits. So, it is possible to easily access different applications in different environments and under distinct con-ditions. Because of the heterogeneous network capabilities and usage scenarios, and the end-users expectations of higher qual-ity for this type of services, designing the techniques which automatically provide the best possible quality to consumers has become a primal challenge.The transmission of media content over the Internet uses the Hypertext Transfer Protocol (HTTP) and due to the fluctuant bandwidth and time-varying conditions of the network, many distribution solutions employ adaptation strategies to meet different network constraints. In traditional video delivery systems, like IPTV, the control of the transmission is carried out by the broadcaster. However, the transmission of media content over the Internet using the HTTP protocol allows the employment of these techniques and in a better way transferring the control of the streaming to the client. In essence, the client is the one in charge of monitoring the state of the network and requesting from the server the stream with the desired properties that can be correctly received.
For instance, a typical effect of network problems is the video freeze or buffering, which is in fact one of the most annoying degradations of the user's QoE [1]. To avoid this, it is possible to reduce the media data to transmit by, for example, reducing the coding quality of the video. By this way, a smooth playback could be assured with a reduction of the video quality which is less disturbing for the observers.
To make the transmission more adaptable to the rapidly fluctuating bandwidth of Internet, the multimedia files are divided into small pieces, called chunks. This way, the servers makes various segmented versions of the content with different bitrates available to the users, so the client could ask for the chunks required to assure a smooth playback, providing the best possible QoE.
There are two main degradations that could take place in adaptive streaming systems which could affect the QoE of the users. Since the encoding parameters could be adjusted to fit a certain bitrate, variations in the coding quality of the content may appear. There could be also buffering delays or video freezes, since the client may not have received the correct corresponding chunk to play, and requires more waiting time.
The properties of the versions of the videos that are avail-able in the server are contained in a file or manifest, which provides for the client the information required to know which chunks to ask for. In fact, in the format of the chunks and the manifest lie the differences among the various commercial systems already developed (e.g., Apple, Adobe and Microsoft solutions). Therefore, to enable the interoperability between different servers and clients, the MPEG-DASH standard is being developed, and the first part has been published [2].
It is also worth noting the possibility of offering 3D video content over this type of distribution systems. This is thanks to the frame-compatible transmission of stereoscopic sequences, based on the use of the same processing that is applied to monoscopic video [3]. In fact, nowadays the study of specific alternatives to adapt the data to transmit 3D video to the network conditions is an interesting research topic. Examples are using asymmetric coding of the stereo views or switching from stereoscopic to monoscopic visualization [4].
Particularly, there is a need of subjective assessment test to evaluate the effects of the adaptation processes that take place in adaptive streaming systems, since this is the most reliable way to get conclusions about the visual experience of the end-users. In fact, the novelties of these video systems, in relation to the conventional broadcasting TV services, could entail the research of new assessment methodologies to obtain robust results from subjective tests. For instance, typical methodologies like Absolute Category Rating (ACR) [6] based on the evaluations of short sequences may not be appropriate since the streaming adaptation process could span during longer intervals, while others like Single Stimulus Continuous Quality Evaluation (SSCQE) [7] may require some modifications to fit with the new requirements.
Therefore, in this paper a subjective study of typical adap-tation scenarios is presented, which its results could help to assure a high QoE to the users under all network conditions. In particular, a specific assessment methodology designed to evaluate the effects of transmission events on the QoE was used, and various bitrate adaptation patterns were considered, both in monoscopic and stereoscopic content. The study presented here expands our previous work regarding only stereoscopic video [8].
The rest of the paper is structured as follows. In section II, the main studies presented in the literature concerning QoE issues in adaptive streaming are introduced. In section III, the settings of the subjective experiment carried out in the present work are detailed. The results are shown in section IV and comprehensively discussed in section V. Finally, the conclusions of the work are explained in section VI.
II. RELATED WORK
Considering the influence of adaptation mechanisms on HAS, having knowledge about user's QoE of adaptation sce-narios is a crucial issue in the development of these systems. Nevertheless, it is an aspect that has not been sufficiently considered until now. However, lately some studies have been presented taking into account factors of the QoE in the design and evaluation of adaptive streaming systems.
Various approaches have been presented using metrics to estimate the QoE to measure the performance of adaptive streaming systems. For example, Dobrian et al. carried out a large-scale study considering some metrics to estimate the performance of video streaming systems, such as start-up latency, coding bitrate, frequency and severity of buffering events, and rendering quality [1]. Another example could be found in the work of Singh et al. where a no-reference metric, which is based on neural networks considering video freezes and the quantization parameters, estimates the QoE of the users of HTTP adaptive video streaming [9]. These proposals try to evaluate the effects of these systems taking into account the possible impact on the end-user's perceived quality in the simplest way, which is using quality metrics and not directly involving people in the evaluation. However, it is well-known that the most reliable way to evaluate the QoE of the users of a certain application is by means of subjective tests [5]. In addition, some works has been proposed regarding the control of the adaptive streaming system considering QoE
issue. For instance, the decision strategy of the client for requesting chunks according to the network conditions could be optimized using an estimation of the QoE, based on the impact of video freezes, the effects of frequency and amplitude of the quality changes, and spatial and temporal information of the video [10].
Some subjective studies have been already published, for example, Thang et al. studied the optimum number of coding quality levels that could be used in an adaptive video system by investigating the Just Noticeable Difference (JND) levels existing in the quality range of mobile video content taking into account the perceptual factors of the Human Visual Sys-tem (HVS) [11]. Their experiment was done by side-by-side comparison of different quality levels looking for noticeable differences. However the test method was more oriented to the design of the streaming system than to the evaluation of system performance in relation to the quality transitions and the event that take place in HAS. Another example consists of the incorporation of the effects of framerate and resolution adaptations on the user's perception to obtain the encoding configuration that maximizes the QoE for a certain type of content [12]. In this study, the SSCQE using a slider scale on the screen of the TV was employed as the subjective test methodology which could in fact distance the observers from the real viewing situations.
Mok et al. presented a QoE-aware DASH system including a probing module to detect the highest quality level the current network conditions can support and another module that with the estimated available bandwidth helps the client to select the most suitable quality level [13]. Their studies showed that inserting intermediate quality levels gives a better perceived quality. On the other hand, a large buffer size does not necessarily improve the QoE, while a small video buffer usually produces lower QoE as it has short period to have intermediate quality levels.
Another interesting study was presented by Robinson et al., in which the impact of various patterns of quality vari-ations, including rapid and gradual bitrate drop as well as oscillating the quality on the users' QoE was studied [14]. The experimental results confirmed that a constant bitrate was preferable to frequent changes, and rapid bitrate drops was more preferable than oscillatory changes. In spite of introducing interesting test conditions, they were not included increasing scenarios as well as frame freezing impairment.
TABLE I
M A I N PROPERTIES OF THE TEST SEQUENCES
TABLE II
ADAPTIVE STREAMS' QUALITY LEVELS
Code Genre Original format
Characterization
Movie 1920xl080p Sudden motion, fast changing the rela-24fps tively dark scenes. High disparity.
Di-alogs and ambient sound as audio. Animation 1920xl080p Smooth motion of objects is dominant,
24fps static background. Very low disparity. Dialogs and ambient sound as audio. Sport 1280x720p Football, average motion, wide angle
50fps camera sequences with uniform cam-era panning. Medium disparity. Com-mentaries as audio.
Documentary 1920xl080p Average motion of sea animals in sig-24fps nificantly dark scene. Very high dispar-ity with objects near in the foreground. Commentaries and music as audio.
Taking all above issues into account, the aim of this work was to evaluate typical realistic effects that take place in adaptive video streaming systems, contributing to the limited knowledge about the effects of these systems on the subjective QoE.
III. SUBJECTIVE EXPERIMENT
The subjective experiment has been designed respecting the home viewing conditions as much as possible. This fact es-tablishes certain requirements in almost all aspects of the test, such as the methodology, the test material, test environment, etc. In the following subsections the details of the tests settings are explained.
A. Test material and conditions
Choosing among commercial video contents, four different video sequences with the duration of five minutes were selected for this experiment whose main characteristics are summarized in TABLE I . The number of test sequences and their duration were chosen to limit the duration of the assessment sessions to 30 minutes approximately to not tire the observers.
The side-by-side (SbS) format of all the video sequences (in which the width of left and right views is reduced to the half and both views are positioned one next to the other) were re-encoded into four quality levels (TABLE II), considering H.264/AVC and closed GOPs of one second. Later on, the re-encoded videos were segmented in chunks of two seconds to be subsequently used for producing the test sequences. In general, three specific situations for the HAS client to make the adapting decision were considered: increasing, decreasing, and oscillation of the video bitrate. For each of these cases, different alternatives have been taken into account that are presented in TABLE III. Although HAS-based solution are mostly able to avoid frame freezing because of the large playout buffer (20-30 seconds), they become vulnerable when they need to keep the buffer size low to support the live events which require a low latency. Then the perceptual effect of frame freezing and frame drops when changing the video quality was also considered to study. Except for those test
Status
Code Ql Q2 Q3 Q4
Bitrate (Mbps) 2 4 6 8
TABLE III
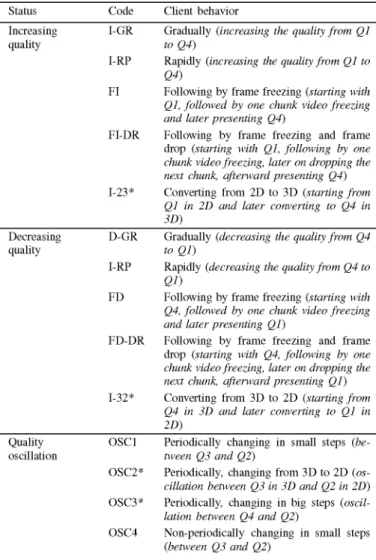
L I S T OF THE TEST CONDITIONS
Code Client behavior
Increasing I-GR Gradually (increasing the quality from Ql quality to Q4)
I-RP Rapidly (increasing the quality from Ql to Q4)
FI Following by frame freezing (starting with Ql, followed by one chunk video freezing and later presenting Q4)
FI-DR Following by frame freezing and frame drop (starting with Ql, following by one chunk video freezing, later on dropping the next chunk, afterward presenting Q4) 1-23* Converting from 2D to 3D (starting from
Ql in 2D and later converting to Q4 in 3D)
Decreasing D-GR Gradually (decreasing the quality from Q4 quality to Ql)
I-RP Rapidly (decreasing the quality from Q4 to Ql)
FD Following by frame freezing (starting with Q4, followed by one chunk video freezing and later presenting Ql)
FD-DR Following by frame freezing and frame drop (starting with Q4, following by one chunk video freezing, later on dropping the next chunk, afterward presenting Ql) 1-32* Converting from 3D to 2D (starting from
Q4 in 3D and later converting to Ql in 2D)
Quality OSC1 Periodically changing in small steps (be-oscillation tween Q3 and Q2)
OSC2* Periodically, changing from 3D to 2D (os-cillation between Q3 in 3D and Q2 in 2D) OSC3* Periodically, changing in big steps
(oscil-lation between Q4 and Q2)
OSC4 Non-periodically changing in small steps (between Q3 and Q2)
conditions (TCs) marked with an asterisk, which were only applied to stereoscopic video contents, the rest were applied to both monoscopic and stereoscopic contents, so the effects on both types of video could be compared.
Since the format of the test sequences was SbS stereoscopic, one of the views was removed to show the sequences in the monoscopic format. Therefore, the monoscopic sequences were primarily in SbS format, encoded at the double of Qi bitrate level.
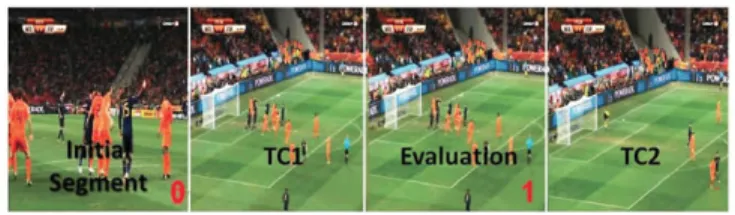
B. Evaluation methodology
Fig. 1. Test sequence structure
the observers to provide their opinions about typical quality variations in adaptive streaming is required. In addition, since the quality transitions would last at least some seconds, it is needed to have long sequences which disallow the use of some traditional subjective assessment methodologies, like ACR. In fact, the most appropriate of those popular methodologies is the SSCQE, which is based on providing a continuous evaluation of the video quality using a slider or a similar remote control to register the instant scores. However, since the aim of the current study is to analyze the effects of certain patterns of quality changes, and not strictly to know the quality of the video in each time instant, a simpler methodology was adopted for the current experiment.
Regarding the subjective studies of stereoscopic videos, many experiments have been already carried out analyzing the new perceptual issues that the visualization of stereoscopic content brings (e.g., depth perception, visual comfort, nat-uralness, etc.) [17], [18]. But also, there is a strong effort towards finding suitable methodologies to correctly evaluate 3D aspects, since the first approaches were based on the use of the same methodologies as the conventional video [19]. For instance, pair comparison has been proposed as a reliable method to identify the viewers' preferences regarding 3DTV, especially against monoscopic content [20]. However, these approaches will distance the observers from real viewing situations, so other methods have been proposed to evaluate the quality in 3D video delivery services, such as ACR with the addition of the evaluation of visual discomfort [21]. However, as previously stated, this methodology could not appropriately reflect the real opinions of the end users of 3DTV services, since short sequences are used followed by grey-intervals to evaluate the sequences.
The assessment methodology considered in the present work has already been used in other subjective studies of the impact of transmission errors in IPTV and 3DTV, in [1], [8] and [16] where more details about the methodology could be found. In this evaluation technique long test sequences are divided into segments, as shown in Fig. 1. The first segment has no degradations and provides a reference of the quality of the video. It has a zero printed in the lower right corner of the frames, indicating the start of the test. The following segments are divided in two parts. In the first part, one of the TC's is inserted to the video providing a Processed Video Sequence (PVS). Then, during the second part of the segment, which has no degradations to analyze, the observers evaluate the PVS in the previous part. The video frames of the second part have also printed a number indicating the TC's number which is the box number in the paper questionnaire to rate. It is worth noting that in this experiment method the length of the
TABLE IV
EVALUATION SCALE
Value
+4
+3
+2
+1
0
-1
-2
-3
-4
Description
Very satisfactory
Satisfactory
Slightly satisfactory
Perceptible but not satisfactory
Imperceptible
Perceptible but not annoying
Slightly annoying
Annoying
Very annoying
segments could be adjusted depending on the conditions and requirements of the experiment. In the present case, segments of 16 seconds were used, allocating 10 seconds (i.e., five chunks) for the first part of the segments and 6 seconds for the evaluation period, T#.
A total of 19 TCs were evaluated per test sequence. Besides, some segments were evaluated as error-free segments to get references of the scoring of anchor conditions. To avoid too long assessment sessions, the TCs were inserted in both stereoscopic and monoscopic video in the same sequence, so some of the segments were visualized in 3D and others without disparity. To facilitate the visualization of these sequences, the transitions between monoscopic and stereoscopic segments were done smoothly during the T#, except in the cases of the TCs concerning these transitions. By this way, the observers did not perceive big changes, and the perceptual adaptation of the HVS was facilitated. Moreover, to avoid great quality changes between consecutive TCs, events consisting of in-creasing the quality were concatenated with TCs reducing the quality. If this was not feasible, two subsequent TCs always had similar quality, so the transition from one to the other was done smoothly during the evaluation period of the previous one. In addition, at the beginning and the end of the first part of the segments containing the event to evaluate, some seconds were left unaltered, as "safety margins", so the effect to evaluate was in the center of the interval.
To study the perception of the video quality change and its impact on the end-users, the test subjects were asked to rate the overall quality of the PVSs considering the initial and the final states in the video segment, using the rating scale presented in TABLE IV. The proposed nine level scale was made by extending the traditional five-grade degradation scale [7], considering one level for the perception of the quality change, four levels indicating the level of satisfaction and four other considering the annoyance level.
only one line ("/") in the case that they felt some kind of visual discomfort.
Before starting the test sessions, the observers were asked to fill a questionnaire about their background and interest. Afterward, the objective of the experiments was explained to them and subsequently, some training sequences were shown to familiarize them with the range of the video quality levels.
C. Environment and equipment
The experiment was carried out at the Universidad Politc-nica de Madrid in a laboratory equipped with a 42" Panasonic stereoscopic television (1920x 1080 resolution and 16:9 aspect ratio) and the corresponding active shutter glasses, and con-trolled ambient light to avoid reflections on the screen and flickering effects, which could take place when watching 3D content. A computer connected to the TV was used to play the sequences using VideoLAN Client (VLC). When stereoscopic sequences were shown, the built-in feature of the TV was used to show sequentially the stereo views. The viewing distance was considered as approximately three times the height of the TV screen (3H). In general, maximum of 3 observers participated simultaneously in majority of the test sessions. Only in four sessions 4 or 5 subjects participated at the same time. The sitting position of all test subjects was recorded to study the effect of their position on their quality perception.
D. Observers
Forty five observers (20% female) participated in the subjec-tive tests, with ages ranging from 21 to 49 years, the majority (almost 91%) being less than 30. All of them had normal or corrected vision, so they could properly watch the test sequences. Majority of the observers (88%) were Spanish and 68% of the observers already watched 3D videos more than 3 times. 45% of the observers had previously participated in other subjective tests, so they could be considered more experts than the rest of them. After terminating the evalua-tions of the TCs, the observers were asked to indicate the video sequences which provided the best and worst watching experience.
IV. RESULTS
The scores provided by the test participants were collected and grouped for each TC, according to TABLE III. Then, the Mean Opinion Scores (MOS) and 95% Confidence Intervals (CI) were calculated. The results are presented in Fig. 2, considering the MOS of each content, as well as the mean value of the four video contents' MOS (called "overall" in the figures).
A. Adaptation scenarios applied on 2D video
I) Increasing the quality: Looking at the overall result,
there is a non-signiflcantly better performance when rapidly increasing the quality compared to gradual increment ac-cording to Fig. 2(a). On the other hand, those scenarios including frame freezing followed by a skip of frames have been perceived significantly annoying in all video contents.
2) Decreasing the quality: According to Fig. 2(b), rapidly
decreasing the quality of the next chunks was perceived non-signiflcantly better than the gradual reduction, both being perceived as slightly annoying. Those PVSs including frame freezing were perceived more annoying compared to the previous scenarios.
3) Quality oscillation: Considering Fig. 2(c), periodic
os-cillation of the quality in small steps (between 6Mbps and 4Mbps) was perceived better in comparison to the one in non-periodic way. Both scenarios performed significantly more satisfactory in Animation, opposite to Movie content.
B. Adaptation scenarios applied on 3D video
1) Increasing the quality: According to Fig. 2(d), rapidly
increasing the quality had mostly better performance compar-ing to the other scenarios but not significantly different than gradually increasing the bitrate or converting from 2D to 3D format. In fact, the quality variation through these TCs seemed almost imperceptible in 3D video contents.
Regarding those TCs containing frame freezing, lower per-ceived quality was reported, specifically in Animation. In fact, the most significant effect of all scenarios was observed for this content.
2) Decreasing the quality: Overall, gradual and rapid
de-creasing in quality were perceived similarly and sometimes slightly annoying, while better performance can be seen when converting the video format from 3D to 2D. Those PVS including frame freezing and frame freezing followed by frame drop were also perceived similarly as can be seen in Fig. 2(e). Here also Animation was perceived better compared to the other contents.
3) Quality oscillation: According to Fig. 2(f), the periodic
oscillation of the quality through all proposed scenarios was seemed almost imperceptible. However the performance of the TCs was different in distinct contents.
4) Visual discomfort: Fig. 3 shows the percentage of the
observers who voted for the visual discomfort in each TC. The number of the sequence (according to TABLE I) with the highest visual discomfort in each of the TCs is displayed at top of the bars. The highest visual discomfort was indicated for rapidly decreasing the quality in Documentary. This particular content was often rated the worst in terms of visual discomfort in almost all the TCs.
Overall, decreasing the quality either rapidly, gradually, or followed by video freezing caused visual discomfort to the observers. This is likely corresponded to the blockiness effect, which appear due to the block-based coding algorithms in lower quality levels. This is mostly perceived very annoying in 3D video contents, due to the fact that structural information of the images is also affected by coding artifacts.
The visual discomfort was also indicated for changing the video format from 2D to 3D (1-23) in Animation and Sport. On the other hand, periodically switching the quality in small steps (OSC1) and converting the 3D format to 2D (OSC2) in Documentary have been also indicated for visual discomfort.
V. DISCUSSION
Gradually Rapidly Freezing Freezing+drop Gradually Rapidly Freezing Freezing+drop
(a) Increasing the quality in 2D videos (b) Decreasing the quality in 2D videos
Gradually Rapidly Freezing Freezing* 2Dto3D drop
(d) Increasing the quality in 3D videos (e) Decreasing the quality in 3D videos
Fig. 2. Perception of different adaptation strategies in 2D and 3D video contents
Small steps priodically Small steps non-priod.
(c) Quality oscillations in 2D videos
(f) Quality oscillations in 3D videos
20
15 A
E i o
u
5 H
2
4
1,3,4 1
4
3
4
4
I I I
, |4
4
III
4
III
(¿) CC (N <Y n
o
* H
u
LO
O
( N
u
LO
O m
U
LO
O
"*
u
I/)
o
Fig. 3. Occurrence of visual discomfort in different adaptation scenarios applied on 3D video contents
of the frame freezing while increasing the quality was better compared to Animation and Sport.
Considering the behavior of increasing scenarios in the 3D videos (Fig. 2(d)), no statistically significantly different perception was found between different strategies. However, the QoE of all scenarios in Animation was significantly better than the other contents. As studied in [22], since the compression artifacts can also affect the QoE of 3D videos, one possible reason of significantly better perceived quality in Animation could be the better encoding of this content due to the low texture and clear content.
The overall perceptual quality of the bitrate increasing strategies in 2D and 3D contents is compared in Fig. 4(a). It was observed that there is no statistically significantly difference when the bitrate was switched in rapid or gradual way. However, when the frame freezing was also occurred, better quality was perceived in the 2D videos compared to 3D.
3D videos. The experimental results revealed that the QoE of the adaptation strategies in different video content and format is not identical. On the other hand, the occurrence of visual discomfort was varied in different TCs. All these issues in addition to other outcomes are discussed in the following subsections.
A. Perception of quality increasing strategies
Regarding the QoE of the increasing scenarios in 2D video contents (Fig. 2(a)), there was not any statistically significantly difference between rapid and gradual bitrate switches in An-imation and Sport videos, but in Movie and Documentary. In Movie, the rapid increasing the bitrate was preferred to the gradual way, while the reverse observation was obtained for Documentary. In two aforementioned contents, the QoE
B. Perception of quality decreasing strategies
Considering the performance of proposed decreasing sce-narios in 2D and 3D videos (Fig. 2(b) and Fig. 2(e)), non-significantly better quality was perceived when rapidly chang-ing the bitrate compared to gradually. Here also the QoE has been significantly better in Animation and Sport so that all decreasing scenarios except of those including frame freezing have been perceived 'imperceptible' or 'perceptible but not annoying'.
An interesting observation in 3D videos was found when decreasing the quality by converting the video format from 3D to 2D. The QoE of this scenario was significantly better compared to the other scenarios applied on 3D videos.
Gradually Rapidly Freezing Freezing+ drop
Gradually Rapidly Freezing Freezing+ drop
(a) Increasing the quality (b) Decreasing the quality
Fig. 4. Comparing the perception of adaptation strategies in 2D and 3D video contents
0.4 -,
0.3
-0.2
0.1
0.1
0.2
0.3
0.4
-• 3D
• 2D
•
T
i
Small steps priodically Small steps non-priod
(c) Quality oscillation
was lower than the current experiment (from 350 kbps to 3 Mbps) and the adaptation scenarios were included on rapid and gradual bitrate drop as well as quality oscillation every chunk or every two chunks. Their results showed that rapid bitrate drop was preferred to the quality oscillation; while the reverse outcome was obtained in the current experiment. Considering the contradictive conclusions in two experiments, it should be noted that since the range of the quality levels are different in two experiments and perhaps changing the quality levels in lower bitrates (as in [14]) is more perceptible than in higher bitrates (current study), comparing the results of two experiments might be not rational.
Comparing the overall perceived quality of the bitrate decreasing strategies in 2D and 3D contents (Fig. 4(b)), it was observed that rapidly reducing the quality was perceived better in 3D video. In the rest of the scenarios, no distinct performance was observed in different video formats.
C. Perception of quality oscillation strategies
The performance of bitrate oscillation scenarios in 2D and 3D contents was compared in Fig. 4(c). It was observed that the quality variation via these scenarios was imperceptible in both video formats. An interesting observation in both 2D and 3D contents was found about the better perceptual quality of bitrate oscillation scenarios in the test sequences including various scene changes. As also studied in [14], it seems that frequent scene changes in the video makes detecting the quality oscillation difficult for the brain, especially when changing the quality in every two seconds.
D. Visual discomfort
Considering the results about visual discomfort, it was observed that decreasing the quality in general was the main cause of visual discomfort on the viewers. The reason could be the perceived coding artifacts caused by reducing the encoding bitrate. As discussed in [23], the impact of coding artifacts in 3D video is not limited to only degradation of the video quality, but also differently degrading the left and right views in addition to the disparity (spatial offset of the same object in the left and right views) will cause a conflict for the HVS for positioning the object in depth and the artifacts appeared in zero disparity. Therefore the encoding artifact is an important factor for the visual discomfort.
TABLE V
E X A M P L E COMPARISON BETWEEN THE SCALED MOS VALUE (1-5) OF T H E S U B J E C T S W H O FELT V I S U A L D I S C O M F O R T A N D T H O S E W H O D I D NOT
Content Test Condition
MOS of those who felt visual discomfort
MOS of those who did not feel visual discomfort
Movie D-GR
0.80
1.55
Movie OSC1
2.85
3.78
Doc. D-GR
1.63
2.2
Doc. OSC1
3.55
4.15
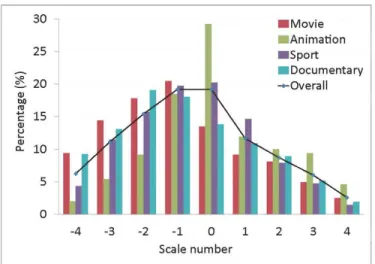
Fig. 5. Observers' vote distribution
E. Performance of evaluation scale
Regarding the evaluation scale, Fig. 5 shows the proportion of the vote for each scale number. Considering the distribution of the votes around 0, we found that almost 50% of the observations have been negative values indicating the overall quality from the range of 'perceptible but not so annoying' till 'very annoying', and nearly 30% of the observations have been positive values illustrating the overall quality from the range of 'perceptible but not satisfactory' till 'very satisfac-tory', and 20% of them have been rated as 'imperceptible'. These values are compatible with the number of adaptation scenarios to reduce the video quality that is expected to be perceived unsatisfactory (negative value). The heavy usage of the negative scale by observers was confirmed our goal of extending the scale to the negative numbers.
It should be noted the low usage of the highest values of the scale (3 and 4 in Fig. 5), showing some resistance of the observers to highly rate the satisfactory events, which may involve a reconsideration in the use of nine levels in the scale for the future experiments.
F. Other observations
The impact of sitting position of the observers on their quality perception was studied by comparing the MOS of 12 people seated on angle with the others. Considering the overall result, 94% correlation between the MOS of the two groups was found.
The influence of the individual interests on their perceptual quality was also investigated. In confirmation of previous studies such as [24], the users' interest, prior experience and expectation highly affect on their level of tolerance. For instance, the major impact of users' concern on their QoE was found in Sport video which was the last minutes of the final match of FIFA World Cup (2010) between Spain and the Netherlands. Majority of the observers voted for this video content as the worst watching experience.
VI. CONCLUSIONS
Although HAS represents a great solution for many ap-plications, current studies generally focus on the technical
enhancement of the technology, which can improve the ro-bustness of IP video delivery over the unmanaged networks. Considering the user as the ultimate receiver, to study the QoE of this technology is a crucial issue which has not been done extensively.
To this aim, by considering different possible status for HAS client to make bitrate adaptations, the impact of various bitrate adjustment behaviors to proportionate the network capacity on the end-user have been studied through a subjec-tive experiment with 2D and 3D video contents under home environment conditions. The subjective test method contained special precautions for measuring the QoE for 3D content, and also contained an indicator for visual discomfort. Furthermore, a rating scale containing negative and positive values was proposed to evaluate possible degradations and improvements of the perceived video quality.
Different results regarding the proposed scenarios have been obtained, specially the significant influence of the video content on the perception of different adaptation scenarios. Regarding the experiment on monoscopic video content, no statistical differences were found when changing the bitrate in an abrupt or a gradual way. Also, quality oscillations were hardly perceptible if there is not so much coding bitrate difference (e.g., more than 2Mbps in the current work). Regarding the test conditions applied on 3D video, it is worth noting that switching from 3D to 2D could be the best option to reduce the bitrate, while the inverse behavior does not provide a significant improvement to the viewers' QoE. On the other hand, the effect of decreasing the video quality on subjects' visual discomfort was analyzed, showing that blockiness effects in very low coding bitrates could be one of the major causes. Furthermore, the impact of the presence of visual discomfort on lower perceptual quality of adaptation strategies was observed. Another interesting observation in both 2D and 3D contents was better perceptual quality of the bitrate oscillation scenarios in the video sequences including various scene changes.
The proposed scale also provided good insight into the voting of the observers, although the positive part of the scale was not used very well. Considering the high usage of the negative scale, it can be concluded that giving the choice of negative scale to the test subjects could assist their evaluation apparently for those with the unsatisfactory quality variations. However, selecting the range of the scale is something which requires more consideration yet.
REFERENCES
[1] F. Dobrian, V. Sekar, A. Awan, I. Stoica, D. A. Joseph, A. Ganjam, J. Zhan, and H. Zhang, "Understanding the Impact of Video Quality on User Engagement," SIGCOMM-Computer Communication Review, vol. 41, no. 4, p. 362, 2011.
[2] I. 230091:2012, "Dynamic adaptive streaming over HTTP (DASH) -Part 1: Media presentation description and segment formats." [3] J. María Cubero, J. Gutiérrez, P. Pérez, E. Estalayo, J. Cabrera, F.
Jau-reguizar, and N. Garcia, "Providing 3D Video Services: The Challenge From 2D to 3DTV Quality of Experience," Bell Labs Technical Journal, vol. 16, no. 4, pp. 115-134, 2012.
[4] C. T. Hewage and M. G. Martini, "Quality of Experience for 3D Video Streaming," IEEE Commun. Mag., vol. 51, no. 5, pp. 101-107, 2013. [5] M. ISO/IEC JTC1/SC29/WG11, "Report of Subjective Test Results from
[6] ITU-T, "Subjective Video Quality Assessment Methods for Multimedia Applications," ITU-T Recommendation P.910, Apr 2008.
[7] ITU-R, "Methodology for the Subjective Assessment of the Quality of Television Pictures," ITU-R Recommendation BT. 500, Jan 2012. [8] S. Tavakoli, J. Gutiérrez, and N. Garcia, "Quality Assessment of
Adaptive 3D Video Streaming," in IS&T/SPIE Electronic Imaging: Int. Conference on 3D Image Processing and Applications, 2013, pp. 86500O-1-1.
[9] K. D. Singh, Y. Hadjadj-Aoul, and G. Rubino, "Quality of Expe-rience Estimation for Adaptive HTTP/TCP Video Streaming using H.264/AVC," in Consumer Communications and Networking Conference (CCNC), IEEE, 2012, pp. 127-131.
[10] V. Menkovski and A. Liotta, "Intelligent Control for Adaptive Video Streaming," in Consumer Electronics (ICCE), IEEE International Con-ference on, 2013, pp. 127-128.
[11] T. C. Thang, H. X. Nguyen, A. T. Pham, and N. P. Ngoc, "Perceptual Difference Evaluation of Video Alternatives in Adaptive Streaming," in Communications and Electronics (ICCE), 2012, pp. 322-326. [12] N. Cranley and L. Murphy, "Incorporating User Perception in Adaptive
Video Streaming Systems," Digital multimedia perception and design, pp. 242-263, 2006.
[13] R. K. Mok, X. Luo, E. W. Chan, and R. K. Chang, "QDASH: a QoE-Aware DASH System," in Proc. ACM Multimedia (MM) Systems Conference, 2012, pp. 11-22.
[14] D. C. Robinson, Y. Jutras, and V. Craciun, "Subjective Video Quality Assessment of HTTP Adaptive Streaming Technologies," Bell Labs Technical Journal, vol. 16, no. 4, pp. 5-23, 2012.
[15] C. G. Gurler, K. T. Bagci, and A. M. Tekalp, "Adaptive Stereoscopic 3D Video Streaming," in Image Processing (ICIP), 17th IEEE International Conference, 2010, pp. 2409-2412.
[16] J. Gutiérrez, P. Perez, F. Jaureguizar, J. Cabrera, and N. Garcia, "Subjective Study of Adaptive Streaming Strategies for 3DTV," in Image Processing (ICIP), 19th IEEE International Conference, 2012, pp. 2265-2268.
[17] M. Lambooij, M. Fortuin, I. Heynderickx, and W. IJsselsteijn, "Visual Discomfort and Visual Fatigue of Stereoscopic Displays: a Review," Journal of Imaging Science and Technology, vol. 53, no. 3, pp. 30 201-1, 2009.
[18] A. K. Moorthy and A. C. Bovik, "A survey on 3D Quality of Experience and 3D Quality Assessment," in IS&T/SPIE Electronic Imaging. Inter-national Society for Optics and Photonics, 2013, pp. 86510M-86510M. [19] R, "Subjective assessment of stereoscopic television pictures,"
ITU-R ITU-Recommendation BT.1438, Jan 2000.
[20] J. Li, M. Barkowsky, and P. Le Callet, "Subjective Assessment Method-ology for Preference of Experience in 3DTV," in TVMSP Workshop, 11th IEEE, 2013, pp. 1 ^ .
[21] P. Lebreton, A. Raake, M. Barkowsky, and P. Le Callet, " subjective Evaluation of 3D IPTV Broadcasting Implementations Considering Coding and Transmission Degradation," in Proc.IEEE Int. Workshop on Multimedia Quality of Experience MQoE, 2011, pp. 506-511. [22] V. Kulyk, S. Tavakoli, M. Folkesson, K. Brunnstrom, K. Wang, and
N. Garcia, "3D video quality assessment with multi-scale subjective method," in 5th International Workshop on Quality of Multimedia Experience (QoMEX). IEEE, 2013, pp. 106-111.
[23] M. Barkowsky, K. Wang, R. Cousseau, K. Brunnstrom, R. Olsson, and P. Le Callet, "Subjective Quality Assessment of Error Concealment Strategies for 3DTV in the Presence of Asymmetric Transmission Errors," in Proc. in Int. Packet Video Workshop (PV). IEEE, 2010, pp. 193-200.
[24] P. Kortum and M. Sullivan, "The Effect of Content Desirability on Subjective Video Quality Ratings," Human factors: the journal of the
human factors and ergonomics society, vol. 52, no. 1, pp. 105-118, 2010.
Samira Tavakoli received the Electrical Engi-neering Bachelor degree in 2004 from the Sad-jad Institute of Higher Education, Mashad, Iran. She received the Telecommunication Master degree in 2010 from the Blekinge Tekniska Hógoskola, Blekinge (BTH), Sweden, and the Communication Technologies and Systems Licentiate degree in 2012 from the Universidad Politécnica de Madrid (UPM), Madrid, Spain. Since 2010 she is a member of the Grupo de Tratamiento de Imágenes (Image Process-ing Group) at the UPM, workProcess-ing toward a Ph.D. degree in telecommunication. Her research interests are in the area of adaptive video streaming and multimedia quality of experience evaluation.
Jesús Gutiérrez, received the Telecommunication Engineering degree (five year engineering program) in 2008 from the Universidad Politécnica de Va-lencia (UPV), VaVa-lencia, Spain. He received the Communications Technologies and Systems Master degree (two year MS program) in 2011 from the Universidad Politécnica de Madrid (UPM), Madrid, Spain. Since 2010 he is a member of the Grupo de Tratamiento de Imágenes at the UPM, where he is currently working toward a Ph.D. degree in telecommunication. His research interests are in the area of multimedia quality of experience evaluation and 3D video processing.