Combining pulse-based features for rejecting far-field
speech in a HMM-based Voice Activity Detector
Óscar Varela, Rubén San-Segundo and Luís A. Hernández
ABSTRACT
Nowadays, several computational techniques for speech recognition have been proposed. These techniques
suppose an important improvement in real time applications where speaker interacts with speech recognition
systems. Although researchers proposed many methods, none of them solve the high false alarm problem
when far-field speakers interfere in a human-machine conversation. This paper presents a two-class (speech
and non-speech classes) decision-tree based approach for combining new speech pulse features in a VAD
(Voice Activity Detector) for rejecting far-field speech in speech recognition systems. This decision tree is
applied over the speech pulses obtained by a baseline VAD composed of a frame feature extractor, a
HMM-based (Hidden Markov Model) segmentation module and a pulse detector. The paper also presents a
detailed analysis of a great amount of features for discriminating between close and far-field speech. The
detection error obtained with the proposed VAD is the lowest compared to other well-known VADs.
Key Words— Voice Activity Detector, Decision Tree, Hidden Markov Model, Cepstrum, Auto-correlation and
Linear Prediction Coefficients (LPC).
1.- Introduction
The advantages of using Automatic Speech Recognition are obvious for several types of applications.
Speech Recognition becomes difficult when the main speaker is in noisy environments, for example in bars,
where many far-field speakers are speaking almost all the time. This factor contributes to a reduction in the
speech recognizer success rate that can lead to an unsatisfactory experience for the user. If there are too
many recognition mistakes, the user is forced to correct the system which takes too long, it is a nuisance,
and the user will finally reject the system. With the purpose of solving this problem a Robust Voice Activity
Detector is proposed in this work. The VAD is able to select speech frames (noise frames are discarded).
This frame information is sent to the Speech Recognizer and only speech pronunciations are processed, so
the VAD tries to avoid Speech Recognizer mistakes coming from noisy frames. If the VAD works well, the
Speech Recognizer does too.
In summary, it is very common to find, in mobile phone scenarios, many situations in which the target
speaker is situated in open environments surrounded by far-field interfering speech from other speakers. In
this ambiguous case, VAD systems can detect far-field speech as coming from the user, increasing the
word insertions and substitutions, leading to significant dialogue misunderstandings. This work tries to solve
these speech-based application problems in which far-field speech can be wrongly considered as main
speaker speech.
In [1] a spectrum sensing scheme to detect the presence of the primary user for cognitive radio systems is
proposed (very similar to the VAD proposed in this paper) being able to distinguish between main speaker
speech and far-field speech. Moreover the system implemented in [1] uses one-order feature detection and
compare its results with an energy detector showing relevant improvement. In our work a comparative study
is done too, comparing our proposal to other well known VADs: AURORA(FD), AMR1, AMR2 or G729 annex
b. Another recent work is [2], where authors use the pitch lag as feature to achieve better speech quality in
the AMR codec. We also use indirectly the pitch to improve Voice Activity Detection results: considering the
maximum auto-correlation value when computing the pitch. In the same way, in [3] the authors use a
threshold selection algorithm applied to different speech signal features for improving a speech-based
system. Finally, there are some kinds of learning schemes, for example, in [4] the authors train a neural
network in order to obtain the best system response, or [5] presents a new way of computing the weights for
combining multiple neural network classifiers based on Particle Swarm Optimization, PSO. In this paper, a
decision tree is trained for rejecting far field speech.
On the other hand, and considering VAD systems in real time applications, new VAD techniques are being
proposed. See for example the work of Ramirez [6] based on robust VAD using the Kullback-Leibler
divergence measure. In [7] a classification SVM (Support Vector Machine) technique for VAD is presented.
This SVM uses only MFCCs (Mel-Frequency Cepstral Coefficients) as features. The segmentation and
training method is based on HMM models, similar to the baseline VAD of this work. During the detection
process, the incoming signals are classified into three distinctive and consecutive states representing the
pre-silence, speech and post-silence segments respectively. However, although experimental results are
usually given for the AURORA database, from our knowledge there are no similar results for speech in the
presence of far-field voices.
In several previous works, similar measurements, like those considered in this work, have been used for
dereverberation techniques. In [8] for example, the authors use the idea of reverberation for restoring speech
degraded by room acoustics using stereo (two microphone) measurements. To do this, cepstra operations
are carried out when observations have non-vanishing spectra. Another dereverberation technique,
presented in [9], uses the pitch as the primary analysis feature. That method starts by estimating the pitch
and harmonic structure of the speech signal to obtain a dereverberation operator. After that, this operator is
was proposed in [10] based on auto-correlation functions of frame-wise time sequences for different
frequency components. A technique for reducing room reverberation using complex cepstral deconvolution
and the behaviour of room impulse responses was presented in [11]. Reverberation reduction using least
square inverse filtering has been also used to recover clean speech from reverberant speech.
Yegnanarayana shows in [12] a method to extract time-delay between two speech signals collected at two
microphone locations. The time-delay is estimated using short-time spectral information (magnitude, phase
or both) based on the different behaviour of the speech spectral features affected by noise and reverberation
degradations. Finally, Cournapeau shows in [13] a VAD based on High Order Statistics to discriminate close
and far-field speech, enhanced by the correlation of LPC residual. Although the authors use
auto-correlation and LPC residual, they do not use these two features as a technique for far-field voice exclusion,
as proposed in this paper.
Other works are focused in some kind of application in which background voices are involved. For example,
in [14] Thilo presents a post process technique for recording the main speaker in a meeting. In this case the
feature vector contains loudness values of 20 critical bands up to 8 KHz, energy, total loudness,
zero-crossing rate and the difference between the channel specific energy and the mean of the far-field
microphone energies. The problem with these kinds of words is that the proposed techniques require several
microphones, different than our case of study in which only one channel, or one microphone, is available (in
the context of telephone applications).
This paper proposes a new approach, combining specific pulse-based measurements in a Decision Tree
method, to improve VAD systems in the presence of background speech (coming from one or several
background speakers). These measurements are easy and cost-effective to integrate into state-of-the art
VADs. Decision Tree process over the new measurements has been incorporated into the Speech Pulse
Detection module of a HMM-based VAD.
The paper is organized as follows: the baseline VAD is described in Section 2. Section 3 shows the speech
database and the feature analysis, Section 4 describes the Decision Tree for combining the studied features
and Section 5 presents global detection results when comparing our new approach to other well known
VADs over three real mobile telephone databases. Finally, the main conclusions are presented in Section 6.
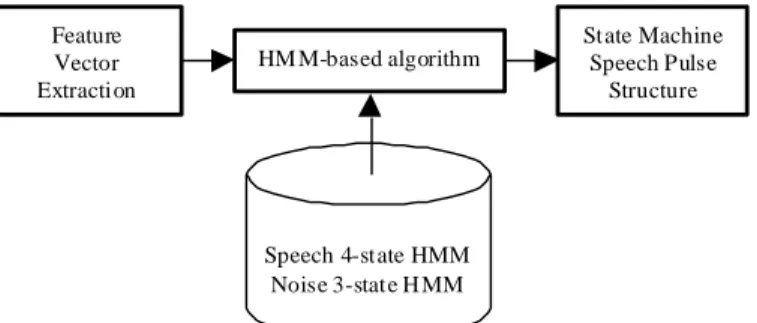
2.- Baseline Voice Activity Detector Structure
The baseline VAD is composed of three main modules (Fig.1): The first one is the feature vector extraction,
the second is the HMM-based algorithm, and finally the third is the Pulse Detector implemented as a finite
Feature Vector Extraction
HM M-based algorithm
State Machine Speech Pulse
Structure
Speech 4-state HMM Noise 3-state H MM
Fig. 1. Voice Activity Detector Block Diagram.
2.1.
Feature Vector Extraction
The feature vector v(n) is composed by five features as shown in Fig.2.
) (
0 0
3 2 1
n v dc
n c
C C C
Fig. 2. Feature Extraction
The five features are the most relevant cepstral coefficients (C1, C2 and C3), obtained from a previous study
which will be developed and explained latter in this section (Table I), normalized log energy (c0n) and delta
log energy (dc0) calculated at every frame (time_frame = 24 ms and 50% overlapped). The GenCeps module
computes the cepstral coefficient from a 12 Mel filter bank (12 bark filters over Mel or logarithmic scale [15])
with pre-emphasis. Sometimes these cepstral coefficients are widely used for speech recognition and
cepstral coefficient calculation does not increase processing time.
MFCC selection was carried out computing and analysing the speech and non-speech probability distribution
functions for them along the training database. Considering these distributions, it is possible to compute the
uncertainty associated to every coefficient. The uncertainty [16] measures the discrimination power of a
MFCC. The uncertainty is the probability of miss-classifying a frame according to only that coefficient. The
probability distributions were estimated for the two acoustic classes (speech and non-speech) for each
coefficient independently considering the training database. The results were obtained assuming
independence between MFCCs (from C0 toC8 in this case). The chosen parameters will be the ones which
produce bigger differences between the two acoustic classes (speech and non-speech). Table I shows the
uncertainties for all MFCCs, sorted by uncertainty. The chosen MFCC in this study are highlighted in bold, in
sequence, C3, C0, C1 and C2. As C0 will be used to calculate normalized log energy (c0n), C3, C1 and C2 will
be the features included into the final feature vector.
GenCeps
i
n
Index of the MFCC Uncertainty
3 0.3428
0 0.3606
1 0.3623
2 0.3686
4 0.3765
5 0.3898
7 0.4137
6 0.4371
8 0.4495
Table I. Uncertainty for each MFCC.
On the other hand, delta log energy is calculated in frame i as the difference between log energy in frame i
(C0) and log energy in previous frame (
i
-
1). In order to compute the normalized log energy, it is necessary toestimate the background noise log energy (
bg_noise
). The noise estimator is based on a simplified version ofthe AMR1 algorithm [17],
]
1
[
]
[
_
)
0
.
1
(
]
1
[
_
noise
i
bg
noise
i
energy
i
bg
(1)where idenotes actual frame and takes values according to the next criterion:
else
i
energy
i
noise
bg
if
_
[
]
[
1
],
1
.
0
(2)
In this study has been set to 0.85 (as the best value considering experiments over the validation set,
anyway there are not relevant differences between 0.82 and 0.93), getting in this way an 85% adaptation to
energy falls due to silence or stationary background noise.
Finally, normalized log energy is calculated frame by frame as the difference between the log energy at this
frame (C0) and the background noise log energy estimated in this frame.
2.2.
HMM-based algorithm
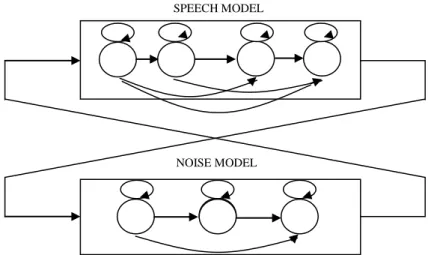
This algorithm uses two acoustic models: a speech model and a noise or non-speech model. Models
topology is represented in Fig.3.
Fig. 3. HMMs structure.
SPEECH MODEL
Both HMMs are left-to-right models with three and four emitting states for noise and speech model
respectively, and one mixture per state (the exact number of states is not critical). Note that state skipping is
allowed.
The HMM-based algorithm consists of the calculation of a parameter named
score
for each frame, which isderived directly from the log likelihoods of one frames given speech/non-speech models (3).
))
(
log(
))
(
log(
L
speechL
noisescore
(3)where
L
(
)
Pr
ob
(
|
(
n
))
symbolizes the likelihood of frame n given an acoustic model. Anotherimportant aspect is that speech and noise models are connected each other: Fig. 3 presents a network where
the noise model can be followed by the speech model and viceversa. The frame classification into speech or
non-speech is done based on the speech/noise log likelihood ratio:
score
. Ifscore
is higher than zero, theframe is pre-classified as a speech frame, otherwise the frame is pre-classified as a noise or non-speech
frame
2.3.
Speech Pulse Detection
The HMM based algorithm provides a preliminary frame classification into speech and non-speech frames.
After this decision, the speech pulse detection module adds additional information to detect speech pulses
providing the final frame classification into speech or non-speech frames. This information is related to the
pulse duration, silence between pronunciations and pulse extension:
Pulse duration: If pulse duration is less than 168 ms, is not considered as a speech pulse. With this
condition, the VAD avoid detecting clicks, coughs or blows as speech. This value is the maximum delay
of the VAD system.
Silence between pronunciations: If the silence between consecutive speech pulses is less than a
configuration parameter in ms, pulses are connected as only one. This value can be adjusted depending
on the type of background noise.
Pulse extension: the algorithm adds three frames before and after speech pulse in order to avoid losing
low energy speech frames at the beginning and the end of pronunciations (fricative and occlusive
sounds).
3.- Study of new frame features
This section describes in detail the analysis of speech frame features carried out in this study by evaluating
the discrimination power for rejecting far-field voice (from one or several speakers) [18]. The new speech
Harmonic structure features: frame auto-correlation throughout the frequency range used during the
pitch computation. This characteristic tries to detect how the harmonic structure disappears in the
case of far-field speech (resulting from reverberation) or speech from several speakers.
Spectral envelope features: Mahalanobis distance between MFCCs from consecutive frames. These
characteristics can be used to measure how fast the spectrum changes. It is supposed to be faster in
the case of reverberated speech or speech from several speakers.
The last features considered, LPC Residual, can have both harmonic and spectrum information.
From the frame-based features, some measurements are obtained analysing the evolution of these features
along the speech pulses. In order to reject background speech pulses, a trained Decision Tree for taking
decisions at speech pulse level (pronunciation level) is used to obtain evaluation results at frame level. This
new decision technique will be included in the baseline VAD speech pulse detector and considers some
measurements calculated over the features mentioned before. For this analysis, the Av16.3 speech
database has been used.
3.1. Av16.3 Speech Database
The database used for feature analysis and VAD training/tuning is the Av16.3 speech database made up of
audio-visual data recorded in a meeting room context. For this work, only the audio data has been
considered. This audio has been recorded with 16 perfectly synchronized and calibrated microphones. For
each recording, there are 16 audio WAV files from the two circular 8-microphone arrays (Fig.4) sampled at
16 KHz and WAV files recorded from lapels also sampled to 16 KHz. It is especially important to point out
that overlapped speech has been recorded when there are several speakers speaking simultaneously.
It is important to highlight that the analysis of the features and the VAD training/tuning were carried out with
different subsets and without overlapping.
This database is oriented to a broad range of research topics, including a wide variety of situations, from
“meeting situations” where speakers are seated most of the time, to “motion situations” where speakers are
moving most of the time. Audio files are named in accordance with the characteristics of the speakers (for
more details see [19]). These files have been sampled down to 8 Khz (for simulating a telephone channel)
and randomly divided into three sets: training (80%), validation (10%) and test (10%). The feature analysis
has been carried out on the training set.
Next sections will describe the measurements analysed to define new constraints when detecting speech
Fig.4. MA1 and MA2 8-microphone circular array. See Speakers Area. This figure has been obtained from [19].
3.2. Mahalanobis distance between MFCCs
This characteristic consists of computing the Mahalanobis distance between MFCC vectors obtained from
consecutive speech frames. Every vector contains the first 8 MFCC coefficients, normalized energy and
delta energy. Mahalanobis distance (4) is used to evaluate the similarity between multidimensional random
variables:
t j i j
i j
i
M
x
x
x
x
S
x
x
d
(
.;
)
(
.)
1(
.)
(4)where S is the covariance matrix of the variable vector
(
x
1,
x
2,...,
x
k)
. The distributions of Mahalanobisdistance between consecutive frames for the main speaker, far-field speaker and multi-speaker speech are
shown in Fig.5. As is shown, the main speaker speech presents the lowest distance while the multi-speaker
presents the highest ones. At this point, the analysis was extended to N-frame speech pulses. In this
process, the minimal distance throughout N consecutive frames is computed. Fig.6 shows the distributions of
the minimal distance for speech pulses with more than 50 frames. It is important to note that all the
distributions are normalized between 0 and 100.
Fig.5. Distribution of Mahalanobis distance distributions for the main speaker, far-field speaker and multispeaker speech.
Distribution of Mahalanobis distance
0 1 2 3 4 5
0 4 8 12 16 20 24 28 32 36 40 44 48 52 56 60 64 68 72 76 80 84 88 92 96
Distance
P
e
rc
e
nt
a
ge
of
f
ra
m
e
s
As is shown in Fig.6, the minimal distance throughout the N frames is higher for speech coming from several
speakers at the same time. This measurement discriminates very well between the main speaker and
multispeaker voices. In this case, the classification error is less than 24% for 50-frame speech pulses.
Fig.6. Distribution of minimum Mahalanobis distance considering speech pulses with more than 50 frames.
The discrimination power between the main speaker and far-field speaker voices with this measurement is
better compared to the previous one. In this case, errors are less than 35% for 50 frames. Other related
measurements, like the maximum, average, variance or kurtosis of the Mahalanobis distance, were also
tested, but only the minimum distance showed an interesting relationship with the voice type. We think this is
because a low minimum distance is obtained during stationary speech zones: very infrequent in far-field and
multi-speaker speech.
In conclusion, the minimal Mahalanobis distance between MFCC vectors obtained throughout N consecutive
speech frames is computed. The voices mixture distributions show a good measurement discrimination
power.
3.3. Maximum auto-correlation obtained when computing the pitch
In this case, the study is focused on the behaviour of the auto-correlation values when computing the pitch at
every frame. The maximum of the auto-correlation function R(k) normalized to R(0) (5) was obtained for every
frame (256 samples) between two limits, kmin and kmax, corresponding to an interval of frequencies from
fmax=320 Hz to fmin=50 Hz respectively. It is assumed that pitch belongs to that interval of frequencies, so it is
expected to find the highest correlation value within that region. Only those frames whose
auto-correlation value normalized to R(0) is higher than 0.5 were considered. In conclusion,
Hz
k
f
f
Hz
R
k
R
i
autocorr
s i ii
/
50
320
)
0
(
)
(
max
)
(
max_
(5)where “i “ is the frame number, “f “ in Hz is the round pitch frequency, and “fs” is the sampling frequency.
Fig.7 presents the maximum auto-correlation distributions for the main speaker, far-field speaker and
multispeaker speech.
Distribution of minimum Mahalanobis distance along 50 frames
0 1 2 3 4 5 6 7 8 9 10
1 4 7 10 13 16 19 22 25 28 31 34 37 40 43 46 49
Fig.7. Distribution of maximum auto-correlation for the main speaker, far-field speaker and multispeaker.
Fig.7 shows very different behaviours for the maximum auto-correlation value in the three cases, especially
for auto-correlation values greater than 0.9. There are many more frames in the case of the main speaker
speech and very few in the case of multi-speaker speech. So after considering this effect, the percentage of
frames (throughout N frames) with a maximum auto-correlation greater than a threshold (autocorr_th) was
computed for the three types of speech with autocorr_th=0.9. Fig.8 shows the distributions of the percentage
of maximum auto-correlation values greater than 0.9 for the main speaker, far-field speaker and
multi-speaker speech throughout speech pulses with more than 50 frames. It is important to note that all the
distributions are normalized between 0 and 100.
Fig.8. Distribution of percentage of maximum auto-correlation greater than 0.9 for the main speaker, far-field speaker and multispeaker N=50.
As it is shown in Fig.8, the percentage throughout the N frames is lower for speech coming from several
speakers at the same time. This feature can discriminate very well between the main speaker and
multispeaker voices. In this case, the error is less than 15% considering 50 frame speech pulses
(considering speech pulses with more than 50 frames). The discrimination power between main speaker and
far-field speaker voices is better compared to the previous two features. In this case, classification errors are
less than 33.5% for 50 frames.
By extending the study (by means of varying the maximum autocorrelation threshold (autocorr_th)), the
measure calculated on this feature can be computed using (6) where N is the number of frames of the
considered speech pulse:
Distribution of maximum auto-correlation
0 1 2 3 4 5 6
0,45 0,5 0,55 0,6 0,65 0,7 0,75 0,8 0,85 0,9 0,95 1
Maximum auto-correlation P e rc e nt a ge of f ra m e
s main speaker
far-field speaker multispeaker
Distribution of percentage of maximum auto-correlation higher than 0.9 along 50 frames 0 1 2 3 4 5 6 7 8
0 10 20 30 40 50 60 70 80 90 100
Percentage of maximum auto-correlation higher than 0.9
N i th autocorr i autocorr times n N N
Perc( ) 1 º_ {max_ () _ } 1 (6)
The obtained results show that classification errors are similar when varying autocorr_th from 0.85 to 0.98,
with 0.9 seems to be a good threshold.
3.4. LPC Residual
The last set of measurements is related to the residual coming from an LPC residual of order 10. This is the
characteristic from which more information was obtained. As in all cases, the LPC residual is calculated only
in speech frames (for speech pronunciation evaluation).
Linear prediction calculates a set of coefficients which provide an estimate - or a prediction - for a
forthcoming output sample y'[n] given knowledge of previous input (x[n]) samples:
q
k k p
k
k
x
n
k
b
y
n
k
a
n
y
1 0 ']
[
]
[
]
[
(7)where
a
andb
are the predictor coefficients. The residual error is written as:]
[
]
[
]
[
n
y
n
y
'n
e
(8)This residual error is the basis for the calculation in this section. Several processing measurements have
been considered, but only the kurtosis and maximum auto-correlation of LPC residual obtained an interesting
relationship with the voice type. The obtained results showed important differences in Kurtosis distribution of
main speaker, far-field speaker and multispeaker, mainly when kurtosis values are greater than 5. With this
consideration, the percentage of frames (throughout N frames) whose kurtosis values are greater than 5
where computed. Fig.9 shows the distributions of the percentage of residuo kurtosis values greater than 5 for
the main speaker, far-field speaker and multi-speaker throughout speech pulse frames.
Fig.9. Distribution of percentage of residuo kurtosis greater than 5 for the main speaker, far-field speaker and multispeaker N=50 (speech pulses with more than 50 frames).
Distribution of percentage of residuo kurtosis higher than 5 along 50 frames
0 1 2 3 4 5 6 7 8
0 6 12 18 24 30 36 42 48 54 60 66 72 78 84 90 96
Percentage of residuo kurtosis higher than 5
As is shown in Fig.9, this percentage is lower for speech coming from several speakers at the same time.
This feature can discriminate very well between the main speaker and multispeaker voices as well as
far-field speaker voices. For both cases, the error is almost 18% considering speech pulses of more than 50
frames, so the discrimination power between main speaker and far-field speaker voices is better compared
to the previous three measurements, but a little worse than the last one (percentage of maximum
autocorrelation) for the main speaker and multispeaker speech.
Another interesting measurement based on LPC residual is the maximum auto-correlation of the residuo for
every frame. In this case, the main measurements (greater discrimination power) analysed were:
The percentage of frames in the speech pulse with a maximum auto-correlation residuo greater than
0.425.
The variance of the maximum auto-correlation residuo throughout speech pulse frames.
The measurements based on LPC residual are shown in (9), (10) and (11) where N is the number of frames
considered:
N i
th kurt i residuo kurt
times n N N
Perc( ) 1 º_ { _ () _ } 1 (9)
N i
th autocorr res
i residuo autocorr
times n N N
Perc( ) 1 º_ {max_ _ () _ _ } 1 (10)
N i
i
residuo
autocorr
_
(
)}
1var{max_
(11)where minimum distribution overlapping is obtained in (9) and (10) when kurt_th and res_autocorr_th are set
to 5 and 0.425 respectively (varying the two thresholds).
The last two measurements distributions considering for speech pulses with more than 50 frames are shown
respectively in Fig.10 and Fig.11. In these two cases, classification errors are different if comparing main
speaker vs. multispeaker speech and main speaker vs. far-field speech:
Percentage of maximum residuo auto-correlation greater than 0.425. Errors are 18.8% main speaker
vs. multispeaker and 26.8% main speaker vs. far-field speech.
Variance of maximum residuo auto-correlation. Errors are 14.9% main speaker vs. multispeaker and
Fig.10. Distribution of percentage of maximum residuo auto-correlation greater than 0.425 for the main speaker, far-field speaker and multispeaker (speech pulses with more than 50 frames).
Fig.11. Distribution of the variance of maximum residuo auto-correlation for the main speaker, far-field speaker and multispeaker (speech pulses with more than 50 frames).
In all cases, when increasing N the discrimination power increases (the classification error decreases). The
best results for the main speaker vs. multispeaker were obtained through the distribution of the variance of
maximum residuo auto-correlation (very similar to the distribution of percentage of maximum auto-correlation
greater than 0.9) while the best result for main speaker vs. far-field speaker were obtained through the
distribution of percentage of residuo kurtosis greater than 5, in this case the best result of all the
measurements.
4.- Decision Tree description
Some far-field speech pronunciations are treated as speech pulses by the baseline VAD, but they are really
insertion errors. The Decision Tree, trying to solve this problem, is applied in the VAD Speech Pulse
Detection module as a far-field voice pronunciation rejection technique. The input to the Decision Tree is a
vector composed by the best five measurements (calculated at frame level) in the analysis done in previous
section (with Av16.3). These chosen measurements are the following:
The minimum Mahalanobis distance between consecutive frame MFCCs in an N-frame speech
pulse.
The percentage of maximum auto-correlation greater than 0.9 in an N-frame speech pulse.
Distribution of percentage of maximum residuo auto-correlation higher than 0.425 along 50 frames
0 1 2 3 4 5 6 7 8
0 5 10 15 20 25 30 35 40 45 50 55 60 65 70 75 80 85 90 95
Percentage of maximum residuo auto-correlation higher than 0.425
P
e
rc
e
nt
a
ge
main speaker far-field speaker multispeaker
Distribution of the variance of maximum residuo auto-correlation along 50 frames
0 1 2 3 4 5 6 7 8 9
0 5 10 15 20 25 30 35 40 45 50 55 60 65 70 75 80 85 90 95
Variance of maximum residuo auto-correlation
Pe
rc
e
n
ta
g
e main speaker
The percentage of residuo kurtosis greater than 5 in an N-frame speech pulse.
The percentage of maximum residuo auto-correlation greater than 0.425 in an N-frame speech
pulse.
The variance of maximum residuo auto-correlation in an N-frame speech pulse.
These five measurements are combined using a Decision Tree for rejecting far-field speech. We have
considered using a statistical decision tree. The decision tree is implemented using the raw scores of each
feature. During training, questions are asked about the feature sequence and nodes are split to maximize
detection of far-field speech pulses. For example, “Q: Is the % of frames with a maximum autocorrelation
higher than X?”. The splitting questions are designed around the different values of each feature and the
best-question used to split the
t
th node is computed based on the node’s impurity,I(t)
,) / (
) / (
2 )
(t pCORRECT t p INCORRECT t
I (12)
where,
p
(
CORRECT/t
)
is the probability of a close-field speech pulse in the node t andp
(
INCORRECT/t
)
isthe probability of a far-field speech pulse in the node t. The question that results in the lowest impurity is
used to split the node. The splitting is stopped when one of two conditions is met: (a) when the number of
training vectors in a given node is less than 10, and (b) when all the decisions on a node produce a new
node without vectors.
After the tree is constructed
T0
, we prune it for the optimum sub-tree. In our experiments we use MinimalCost-Complexity Pruning. We must calculate the sequence of sub-tree
T1
,T2
,…,Tn
, that minimizes thecost-complexity until the root node is reached. Then, we evaluate all of these sub-trees, using the validation
set, and select the best one. More details can be seen in [20,21].
For combining some measurements in order to take a decision, the simplest possibility is to compare every
measurement to a specific threshold independently and then consider AND/OR combination operations. With
this solution, all the conditions are considered at the same level and they are more sensitive to changes in
the speech characteristics. Considering a Decision Tree for combing all the measurements, two new
characteristics are included in the classification process:
1. The first one is that when training a Decision Tree, a higher number of conditions and thresholds are
considered for each measurement: not only one, like in the simple strategy.
2. Secondly, all these decisions are organized hierarchically. So there are structural relationships between
conditions associated to different measurements.
5.- Evaluation results
First of all, it is important to describe the evaluation platform. The evaluation platform is a Solaris platform
composed of five sun work stations, ultra 5 models, over a distributed architecture. The software used in the
complete process is as follows:
The databases were recorded over the mobile telephone network: 8 Hkz with mu-law compression.
Before the experiments, all the audio files were decompressed.
The software used for training the acoustic HMMs is HTK 2.2 (Hidden Markov Model Tool Kit): the
speech model and the noise model are obtained executing this tool over the training database.
The new VAD software is a multi-module “C” program specially designed for rejecting far-field voices.
The other well-known VADs software has been obtained from official internet sites, using the Solaris
version of the software. All thresholds or parameters have been fixed to the values proposed in the
standard definition.
The platform uses the five work station processors in parallel in order to obtain a faster result response. All
the VAD analyzed report an output per frame: “1” if it is a speech frame and “0” otherwise. For obtaining
global VAD results, “C” scripts were created for calculating the evaluation measurements, so the same
information was generated for all the compared VADs.
For evaluating the new VAD, we compute the false alarm rate and miss rate. The false alarm rate and miss
rate are easy to calculate at frame level using formulas in (13) and (14) respectively, see this reference for
more detail [22]:
100 (%) _ _ _ _ _ frames Speech frames Speech as frames Noise N N rate alarm
false (13)
100 (%) _ _ _ _ frames Noise frames Noise as frames Speech N N rate
miss (14)
The final global result, GDE (Global Detection Error), considers both error contributions (15):
(%)) _ (%) _ _ ( 2 1
(%) false alarm rate miss rate
GDE (15)
Once these previous considerations are clear, it’s important to say that three babble and hand-labeled
databases have been used:
1. Including background voice at the beginning of the file (BVBF database): The first experiments were
randomly chosen background voice fragments (different from training and validation sets) from
Av16.3 are added before the main speaker pronunciation with different SNRs: 5 dB, 10 dB, 15 dB,
20 dB and 25 dB.
2. Including background voice at the end of the file (BVEF database): This audio file group is the same
group of 2258 audio files (132 minutes) containing GSM clean audio. In these files, randomly chosen
background voice fragments (different from training and validation sets) from Av16.3 are added after
main speaker pronunciation with different SNRs: 5 dB, 10 dB, 15 dB, 20 dB and 25 dB.
3. Database based on real services (RS database): This database is composed by 2193 hand-labelled
audio files (counting 113 minutes) coming from mobile phones in which main Spanish speakers,
using real services, are located in bars, in rooms with the television switched on, or simply in the
street where there are far-field speakers speaking at a certain distance from the user. The database
is classified into different SNRs, 5 dB, 10 dB, 15 dB, 20 dB and 25 dB, considering background
voices as noise (signal that must be rejected).
For the three different databases, the Decision Tree process uses automatically 70% of the database to
train, 15% for tuning and 15/% for final evaluation results, performing a cross-validation strategy. These
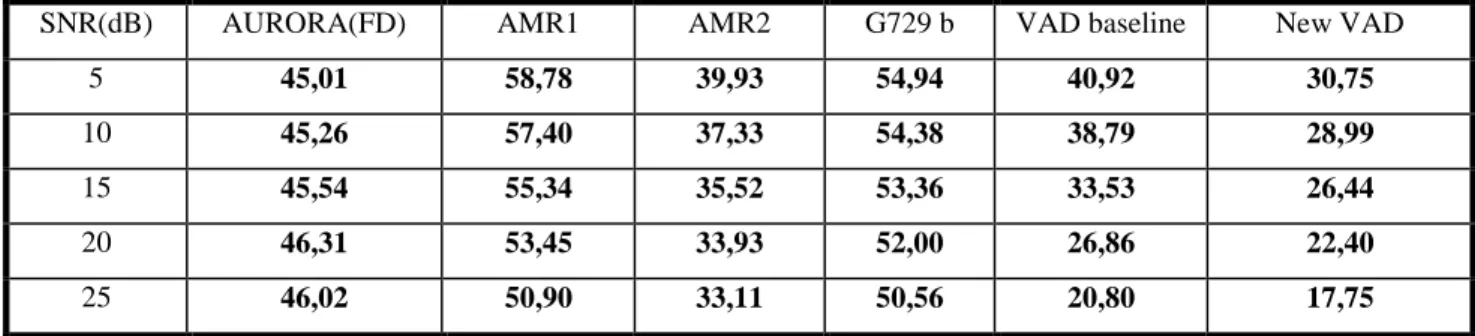
results are shown in Table II, Table III and Table IV.
SNR(dB) AURORA(FD) AMR1 AMR2 G729 b VAD baseline New VAD
5 45,01 58,78 39,93 54,94 40,92 30,75
10 45,26 57,40 37,33 54,38 38,79 28,99
15 45,54 55,34 35,52 53,36 33,53 26,44
20 46,31 53,45 33,93 52,00 26,86 22,40
25 46,02 50,90 33,11 50,56 20,80 17,75
Table II. Overall detection error including background voice at the beginning of the file.
SNR(dB) AURORA(FD) AMR1 AMR2 G729 b VAD baseline New VAD
5 45,76 57,42 45,16 56,43 26,35 22,98
10 45,78 57,34 45,34 56,25 25,28 22,23
15 45,86 57,58 45,08 56,51 23,97 20,88
20 45,81 57,37 43,51 56,34 21,47 18,76
25 45,76 57,12 41,85 56,01 19,22 17,07
SNR(dB) AURORA(FD) AMR1 AMR2 G729 b VAD baseline New VAD
5 56,57 67,60 54,86 65,36 42,85 35,27
10 55,43 67,70 52,02 65,02 38,90 23,07
15 58,14 67,60 50,21 64,66 28,86 21,00
20 56,79 67,70 47,88 64,01 23,68 15,11
25 53,79 63,03 44,32 60,86 15,29 11,55
Table IV. Overall detection error including the main speaker voice and background voice from real services.
Table II shows that the new technique has the lowest detection error for all SNR: the proposed VAD obtains
a detection relative improvement of around 23% on AMR2 VAD for SNR=5dB. In general, for lower SNRs,
AMR1 VAD is the worst case, but for higher SNR the behaviour of AURORA (FD), AMR1 and G729 annex b
becomes similar. Moreover our baseline VAD is also represented, and it is easy to see the advantage of
using the new features combined using a Decision Tree method, for rejecting far-field speech pulses: for
example, a detection relative improvement of 24.85% has been obtained for a SNR=5dB.
Table III shows results with a similar tendency than Table II: the new proposed VAD has the lowest detection
error rate. Motorola VAD (AMR2) is the next best case from the other VAD (without including the baseline
VAD) but with appreciable differences in respect to our approach. The worse cases are AMR1 and G729
annex b with very similar results for all SNR. It is also important to highlight that AMR1, G729 annex b and
AURORA (FD) show a plain behaviour when varying SNR values. For AMR2, the baseline VAD and the
proposed VAD, the detection errors decrease when SRN decreases. The general improvement of the new
VAD is a consequence of the decreasing false alarm rate in the presence of background voices.
Finally, Table IV shows again that our approach obtained the best results. Motorola VAD (AMR2) obtained
results significantly worse than the proposed approach for all SNRs. As commented before, the general
improvement in the new approach arises from the reduction of the false alarm rate in background voice
presence. Comparing it to the baseline VAD, it is easy to see the advantage of using this new technique:
greater for lower SNR. The relative improvement ranges from 40.69% (SNR=10dB) to 8.66% (SNR=25dB).
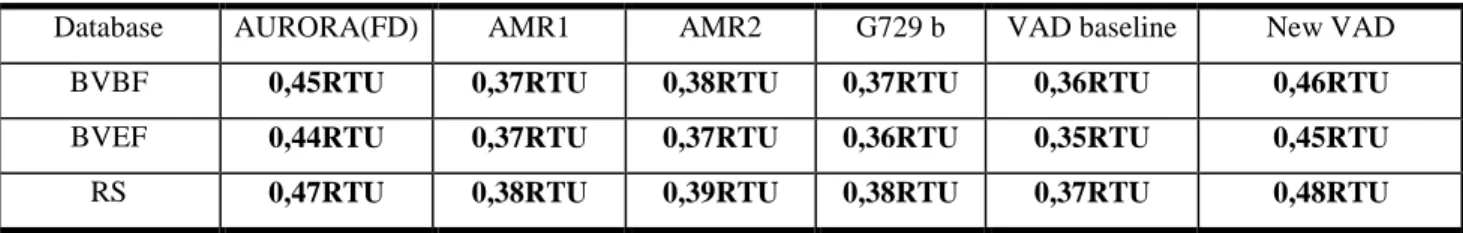
About time-processing information, the next table (Table V) shows comparative RTU (Real Time Unit)
information when computing the three different databases. The loss in terms of processing time between the
baseline VAD and the New VAD is around 29% relative. The New VAD spends a little more processing time
than the rest VADs, so that’s the price the new VAD technique pays.
Database AURORA(FD) AMR1 AMR2 G729 b VAD baseline New VAD
BVBF 0,45RTU 0,37RTU 0,38RTU 0,37RTU 0,36RTU 0,46RTU
BVEF 0,44RTU 0,37RTU 0,37RTU 0,36RTU 0,35RTU 0,45RTU
RS 0,47RTU 0,38RTU 0,39RTU 0,38RTU 0,37RTU 0,48RTU
Another important aspect is the percentage of processing time consumed at each one of the three VAD
baseline main modules (see Section 2): 28% the Feature Vector Extraction, 70% the HMM-based algorithm
and 2% the Pulse Detector. After the new technique inclusion, included over the Pulse Detector module,
these percentages change to: 21% the Feature Vector Extraction, 54% the HMM-based algorithm and 25%
the Pulse Detector.
6.- Conclusion
This paper has presented an improved speech pulse detector able to reduce false alarms in environments
with an important amount of far-field speech. This pulse detector has been included in a previous
HMM-based VAD. This new detector includes a decision tree for combining speech pulse-HMM-based measurements.
The complete measurement analysis was carried out over the Av16.3 database. The lowest classification
errors are obtained with the percentage of maximum auto-correlation values greater than 0.9 along the pulse
frames and the percentage of frames with a residuo kurtosis greater than 5 along the pulse frames. With
speech pulses with more than 50 frames, classification errors are lower than 15% and 18% respectively
when comparing the main speaker and multispeaker speech and lower than 33.5% and 18% respectively
when comparing the main speaker and far-field speech. All the classification errors (obtained with different
measurements) show a more difficult problem when discriminating the main speaker from far-field speech
coming from one speaker.
The field evaluation has been carried out using three GSM databases adding background voices before and
after the main speaker pronunciation (in two of the three testing databases) and the third one based on real
interactions (from the main speaker and real telephony services) in background voice environments. Overall
detection errors have been compared to other well-known VADs showing that the proposed VAD is the best
approach evaluated. The second best approach has been the baseline VAD and the third is the Motorola
VAD (AMR2). Although the baseline VAD obtains very good results, the new Decision Tree method included
in this work has produced a very important improvement on it. The proposed VAD obtains, on the real GSM
database (Table IV), a relative overall detection error improvement when SNR=5dB of 17.69%, 35.71%,
37.65%, 46.04% and 47.83% when comparing it to the baseline VAD, Motorola (AMR2), AURORA(FD),
G729 annex b and AMR1 respectively.
References
[1] Yang, J., Yu, S., Zhou, J. and Gao, Y., “A new error concealment method for consecutive frame loss based on CELP speech”, Computers & Electrical Engineering, vol. 36, pp. 1014-1020, September 2010.
[3] Ayat, S., Manzuri-Shalmani, M.T. and Dianat, R., “An improved wavelet-based speech enhancement by using speech signal features”, Computers & Electrical Engineering, vol. 32, pp. 411-425, November 2006.
[4] Katidiotisa, A., Tsagkaris, K., and Demestichasa, P., “Performance evaluation of artificial neural network-based learning schemes for cognitive radio systems”, Computers & Electrical Engineering, vol. 36, pp.
518-535, May 2010.
[5] Nabavi-Kerizia, S.H., Abadia, M., and Kabir, E., “A PSO-based weighting method for linear combination of neural networks”, Computers & Electrical Engineering, vol. 36, pp. 886-894, September 2010.
[6] Ramírez, J., Segura, J., Benítez, C. and Rubio, A., “A New Kullback-Leibler VAD for Speech Recognition in Noise”, IEEE Signal Proc., vol 11, nº 2, pp. 266-269, 2004.
[7] Abdulla, W., Kecman, V., and Kasabov, N., “Speech-Background Classification by Using SVM Technique”, ICANN/ICONIP, June 26-29, Istanbul, Turkey 2003.
[8] Petropulu, A. P., and Subramaniam, S.,"Cepstrum based deconvolution for speech dereverberation",
IEEE Trans. Speech and Audio Proc., pp. 9-12, 1994.
[9] Nakatani, T. and Miyoshi, M.,“Blind dereverberation of single channel speech signal based on harmonic structure”, pp. 92-95, ICASSP 2003.
[10] Ohta, K. and Yanagida, M., “Single channel blind dereverberation based on auto-correlation functions of frame-wise time sequences of frequency components”, Iwaenc 2006 – Paris – September 12-14, 2006.
[11] Bees, D., Kabal, P., and Blostein, M., “Application of complex cepstrum to acoustic dereverberation”,
Proc. Biennial Symp. Commun. (Kingston, ON), pp. 324-327, June 1990.
[12] Yegnanarayana, B., Mahadeva Prasana, S. R., Duraiswami, R. and Zontkin, D., “Processing of Reverberant Speech for Time-Delay Estimation”, IEEE Trans. Speech and Audio Proc., pp. 1110-1118, vol. 13, nº 6, 2005.
[13] Cournapeau, D. And Kawahara, T., “Evaluation of Real-Time Activity Detection based on High Order Statistics”, pp. 2945-2948, Interspeech 2007.
[14] Pfau, T., Ellis, D., and Stolcke, A., “Multispeaker Speech Activity Detection for the ICSI Meeting Recorder”, Proc. Asru, December 2001.
[15] B. Shannon, and Paliwal, K.K., ”A comparative study of filter bank spacing for speech recognition”, Proc.
Microelectronic Engineering Research Conference, Brisbane, Australia, Nov. 2003
[16] P. Tarapeik, J. Labuda and B. Fourest, “Measurement uncertainty distributions and uncertainty propagation by the simulation approach”, 3rd
EURACHEM Workshop, September 1999, Bratislava.
[17] ETSI TS 126 094 V4.0.0 (2001-03).
[18] Varela, O., San-Segundo, R., Hernandez, L., “New features for improving VAD when dealing with far-field and multi-speaker speech”, Jornadas de Tecnología del Habla, November 2008, Bilbao, Spain.
[19] AV16.3: An Audio-Visual Corpus for Speaker Localization and Tracking.1999, Bratislava.
[20] Yuan Y. and Shaw M.J., “Induction of fuzzy decision trees”, Fuzzy Sets and Systems, vol. 69,
[21] Breiman L., Friedman J.H., Olshen R. A., Stone C.J., “Classification and Regression Trees” Ed.
Wadsworth & Brooks/Cole advanced books & software, 1984.
[22] Lee C., Lin C. and Juang B., “A Study on Speaker Adaptation of the Parameters of Continuous Density Hidden Markov Models”, IEEE Trans. Signal Processing, vol. 39, pp 806-814, 1991.
Óscar Varela Serrano received his physics degree (2000) from Universidad Complutense de Madrid (UCM).
During 2000 and 2001 Óscar worked in the microwaves group (physics department) in Universidad de
Murcia. From 2001 to 2010 Óscar worked at the Speech Technology Group of Telefónica I+D. Nowadays
Óscar is finishing his Ph.D. studies in Universidad Politécnica de Madrid (UPM).
Rubén San-Segundo received his MSEE (1997) and Ph.D. (2002) degrees from Universidad Politécnica de
Madrid (UPM), with highest distinctions. During 1999 and 2000, Ruben did two summer stays at The Center
of Spoken Language Research (CSLR), University of Colorado (Boulder). From Sep. 2001 through Feb.
2003, Rubén worked at the Speech Technology Group of Telefónica I+D.
Luis Hernández Gómez is Telecommunication Engineer (1982) and Ph.D. (1988) from Universidad
Politécnica de Madrid, Spain, where he is currently Associate Professor with the Departamento de Señales
Sistemas y Radiocomunicaciones. Since 1994 he has been Scientific Advisor of Telefónica R&D in Speech
Technologies and the development of Internet-of-Things applications. His research interests include speech,