Journal of Magnetics 19(2), 155-160 (2014) http://dx.doi.org/10.4283/JMAG.2014.19.2.155
©2014 Journal of Magnetics
Power Absorption Measurements during NMR Experiments
N. Félix-González1,2*, A. L. Urbano-Bojorge1,2, C. Sánchez-L de Pablo1,2, V. Ferro-Llanos1,2, F. del Pozo-Guerrero1,2, and J. J. Serrano-Olmedo1,2
1Centre for Biomedical Technology, Technical University of Madrid, Spain
2Biomedical Research Networking Center in Bioengineering Biomaterials and Nanomedicine (CIBER-BBN), Zaragoza, Spain
(Received 1 July 2013, Received in final form 11 December 2013, Accepted 20 December 2013)
The heating produced by the absorption of radiofrequency (RF) has been considered a secondary undesirable effect during MRI procedures. In this work, we have measured the power absorbed by distilled water, glycerol and egg-albumin during NMR and non-NMR experiments. The samples are dielectric and examples of different biological materials. The samples were irradiated using the same RF pulse sequence, whilst the magnetic field strength was the variable to be changed in the experiments. The measurements show a smooth increase of the thermal power as the magnetic field grows due to the magnetoresistive effect in the copper antenna, a coil around the probe, which is directly heating the sample. However, in the cases when the magnetic field was the adequate for the NMR to take place, some anomalies in the expected thermal powers were observed: the thermal power was higher in the cases of water and glycerol, and lower in the case of albumin. An ANOVA test demonstrated that the observed differences between the measured power and the expected power are significant.
Keywords :magnetoresistive effect, NMR, power release, RF power absorption, thermal power
1. Introduction
Resistive looses in biological tissues produce heat as an undesirable side effect of the RF radiation in MRI pro-cedures. As the RF resonant pulse only has a very small associated electric field, the magnetically induced currents are the main cause of heating in biological tissue typically electricity conductive. However, in case of dielectric materials there are other many factors that determine the quantity of absorbed power such as the dielectric com-position and the physical dimensions, shape and geometry of the sample in relation to the incident wavelength. In dielectric substances, the amount of energy absorbed could be neglected because a fraction of the incident energy would be transmitted through the material, while other fraction would be reflected back, so that, only a small amount of energy would be really absorbed. Actually, as the wavelength is much greater in relation to the sample, the fraction of energy deposited is small because the absorptive coupling is inadequate [1-4]. Several estimates
of power absorption in whole body during MRI experi-ments have been done taking into account the organism´s size, anatomical features, duration of exposure, sensitivity of the involved tissues and many other complex variables, such as environmental factors. Their results show that the power deposition is a critical function of the frequency of the RF excitation pulse used [4-6]. Experimental measure-ments have demonstrated and confirm the dependency between the frequency of the pulse sequence and the specific absorption rate [7, 8].
Despite RF absorption is the main cause of tissue heating during MRI procedures, several works suggested measurable temperature increases by the effect of potent static magnetic fields [9, 10]. However, posterior works have demonstrated that temperature changes caused by powerful static magnetic fields, if any, are statistically insignificant [4, 10]. Heating produced by RF in MRI has been considered a secondary undesirable effect, but D.L. Parker suggested the use of MRI as hyperthermia therapy [11]. The researcher presented theoretical calculations about heating produced by the NMR effect, predicting a minimum increase of temperature, in the order of micro-degrees per hour. Although these calculations were dis-couraging, they left the possibility of finding a
combi-©The Korean Magnetics Society. All rights reserved. *Corresponding author: Tel: +34615946196
nation of pulse sequences for the use of NMR as thermal therapy.
Following this idea this study reports thermal power measurements during NMR procedures. Contrarily to the experiments mentioned in the literature, the RF pulse sequence was keep fixed and the static magnetic field was modified during the experiments. We have irradiated a sample of pure egg-albumin, pure glycerol and distilled water with a RF pulse sequence of 20 MHz at a variable magnetic field. The nuclei of Hydrogen have their NMR frequency at 20 MHz in a magnetic field of 0.46 T. We applied five different magnetic field strengths but the NMR only occurs for one of them. To obtain thermal powers from the observed time dependent temperature variations, we have performed a thermal calibration of our NMR equipment.
2. Materials and Methods
A BRUKER electromagnet of variable field strength ranging from 0.23 T up to 1.9 T was used for the NMR experiments. The design and generation of the RF pulse sequence were done in a digital NMR console of a Fast Field Cycling Relaxometer (STELAR-SMARTracer). Due to restrictions in the space, it was impossible to use a thermal isolation around the probe to avoid temperature increase due to coil losses (Fig. 1). To determine the temperature increase, we used a LUXTRON m3300 fiber optic thermometry system. Since the LUXTRON probes are optical fibers, they are immune to electromagnetic interference and can measure temperatures in the presence of intense magnetic fields. Its accuracy is ± 0.2 ºC within 20 ºC of calibration point (manufacture's specifications). Fig. 1 shows the experimental set up.
2.1. Samples and performed experiments
The samples consisted of 150 µL of distilled water, of pure glycerol and of natural egg-albumin in a 5 mmØ NMR tube. All these substances were chosen due to its high dielectric coefficients in order to avoid induced currents inside the sample and because of their biological nature. The water is a standard reference; the glycerol is similar to many substances due to its OH terminations and tightly related to lipid substances. In the case of albumin, it is a protein similar to many abundant proteins in the human body and of high availability. The proton resonance was achieved by adjusting the magnetic field to 0.46 T, for a Larmor frequency of 20 MHz. Although the samples have the same NMR frequency at 0.46 T, their molecular structures are very different: whilst water and glycerol are compounds with a simple structure (glycerol formed by tree hydroxyl groups) [12], albumin is a single polypeptide with 585 residues containing 17 pairs of disulfides bridges and one free cysteine [13].
Several magnetic field intensities were applied while keeping constant the RF excitation (at 20 MHz frequency, same power and sequencing), so that NMR only took place at 0.46 T, and the rest of values were: 0.23 T, 0.35 T, 0.58 T and 0.7 T. We have tuned the antenna to perfect impedance coupling with the RF pulse generator. The RF pulse sequence parameters were the same in all experi-ments to ensure that we have delivered the same RF power to the coil. The RF pulse sequence was repeatedly applied at intervals which were a fraction of the relaxation time
T1. In all experiments, the samples were irradiated until
the temperature reaches its maximum of stabilization, for about 30 minutes. Ten assays were performed for each sample and each magnetic field strength in order to reduce the uncertainty.
From the hydrogen spectroscopy of the samples, see Fig. 2, we can be sure that our instrument “illuminates” (excites) their entire spectra. We have considered the chemical shifts in all the samples, but the most significant
peaks are contained in a bandwidth of very few hundreds of hertz, whilst the NMR console produces RF pulses with a bandwidth of 300 kHz. So, in the three cases, the radiation excites the whole spectrum when the pulse fre-quency is of 20 MHz at 0.46 T. In the same way, when the magnetic field intensity is set to 0.35 T and 0.58 T, the closest points to 0.46 T, both sides, and whose Larmor frequencies should be 15 MHz and 25 MHz respectively, the RF pulse of 20 MHz is unable to produce NMR in the samples. Actually we did not receive echoes at any other frequency than 20 MHz and a magnetic field intensity of 0.46 T.
2.2. Thermal Characterization of the System
To characterize the thermal behavior of the system, we used a resistor inside the sample probe as heater without RF excitation, so that the temperature variations were registered at constant pressure. The resistor was energized until the maximum stabilization temperature was reached. Then, it was extracted from the sample and the cooling curve was registered too. We assume that the thermal con-ductivity (thermal concon-ductivity and heat transfer coeffi-cient refer to the same concept) from inside the sample to the environment, CD, is mainly determined by the air layer
around the sample and the sample holder itself (quartz), much more than by the characteristics of the content, sample plus resistor during the heating or only sample during the cooling. On the contrary, given that CD is,
actually, quite low, the thermal capacity, CT, is much more
dependent on the matter being heated or cooled, that is, depends on the thermal phase: heating (CT↑) or cooling
(CT↓). The maximum increment of temperature obtained
by power dissipation in the resistor was taken as ΔTR,max, whereas the time constant τ↓ of the cooling phase was obtained by fitting with the following equation:
(1)
In the thermal model underneath, t depends on the thermal conductivity, CD, and on the heat capacity, CT, as
follows:
(2)
and the thermal conductivity is given by:
(3)
where the power PR consumed by the resistor and
dis-sipated as heat is exactly known.
It is convenient to use the thermal capacity instead of the thermal conductivity because it is larger sensibility to experimental artifacts, in our work. The thermal capacity can be calculated as follows:
(4a)
Once the system has been thermally calibrated, the power supplied to the sample during NMR experiments,
PNMR, can be calculated from the measurement of the
maximum increment of temperature, ΔTNMR,max by
apply-ing the followapply-ing:
(4b)
2.3. Electrical Power Characterization of the RF Coil
Since the emitting antenna is a coil in the middle of whose axis the sample is placed, an interfering thermal effect affects the experiments (Fig. 1). When the RF coil becomes hotter by Joule effect, the sample temperature rises as well. The other mechanism that would be present, is the heating produced by currents induced inside the samples, although it was avoided by choosing dielectric samples.
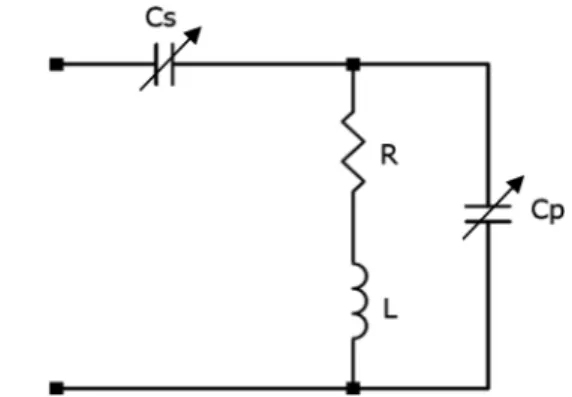
The coil self-heating is strongly conditioned by the magnetoresistive effect. The magnetic field alters the tra-jectories of the charge carriers inside the conductor, mak-ing their paths longer, and, consequently, enlargmak-ing the electric resistance and the electric power consumed in the coil [14]. The current actually running through the coil also depends on the impedance circuit matching the antenna and the transmitter/receiver console of the NMR equipment, which must be as good as possible [15]. This matching circuit consists of a couple of variable capacitor (Cs, Cp) mounted as shown in Fig. 3, where the
auto-inductance (L) of the coil is in series to its internal series ohmic resistance (R). The capacitors must be adjusted before the NMR measurement in order to tune the antenna to the Larmor frequency.
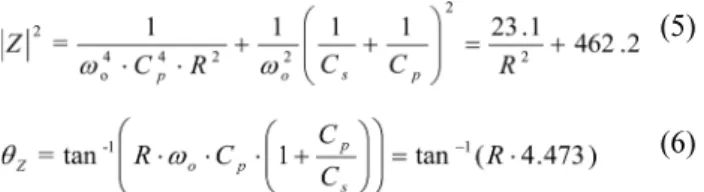
In the NMR tuning condition, the measured impedance of the RF coil was of 41.80-j·21.50 W at 20 MHz (wo) and at null magnetic field. Therefore, the impedance
modulus |Z| and phase θZ of the tuned antenna depends on the serial resistance R, and can be expressed as:
(5)
(6)
The resistance of the wire coil at null field when taking into account the skin effect at 20 MHz is R0 = R(B = 0) = 0.115Ω. We assume that the skin effect and the magneto-resistive effect are independent each other. The variation on the series resistor associated to the wire and due to the magnetoresistive effect is defined by the Kohler rule [16]. For room temperature and copper single-wire conductor transverse to the magnetic field B it can be expressed as:
(7)
where the function f(B) is known for a straight conductor, whilst the coil wire is not straight but curled.
The differential wire resistance dR for a differential length of coil, dl, can be calculated as follow (see Fig. 4 for the geometric details):
(8)
where a is the wire radius, A is the radius of the spire and
l/A is θ.
Given that the antenna is made of copper, and that the function f(B) is linear on B in the region of interest [16],
the problem of integration of R gets reduced to the integration of the absolute value of the sine in a half of spire. The magnetoresistive effect leads to a dependency of the coil resistive component on the magnetic field as follows:
(9)
Therefore, the electric power dissipated in the coil at a variable magnetic field of B intensity, P(B)coil can be expressed as:
(10a)
(10b)
where P(B) is the power actually reaching the sample from the coil, and k is an unknown constant representing the fact than only a fraction of P(B)coil reaches the sample
to heat it. This constant does not depend on the field strength neither on the radiofrequency. It is only deter-mined by the geometrical aspects of the system, so becoming a fitting constant as shown afterwards.
3. Results
The relaxation times at 0.46 T were of 2.6 s for distilled water, 1.1 s for egg-albumin and 0.9 s for glycerol. The observed temperatures behave as exemplified by Fig. 5. It shows that the temperature stabilizes after about 30 minutes of continuous irradiation. The plot shows the measured data at different magnetic field strengths obtained with the fiber optic thermometry system and the fitted curve to obtain maximum temperature increment ΔTNMR,maxand the time constant T↑. It can be observed in the measured
temperature the accuracy of the temperature sensor. The maximum increases reflect the temperature dependence with the magnetic field by the magnetoresistive effect, as expected.
We processed the measured heating curves to calculate the thermal power that heats the sample by taking into account the thermal calibration mentioned before (4b). When analyzing the components of the obtained powers, we need, first, to neglect the absorption of the RF power in the sample because of the small size of the sample (Ø5 mm × 9.5 mm) in relation to the incident wave length (15 m) and because of their dielectric nature. Moreover, at the used frequency, the power loss due to electric coupling is also neglectable. So, changes in the thermal power
sured at the sample must be principally caused by direct heating from the copper antenna, or by internal heating due to the NMR procedure. In absence of NMR (four of the five essayed points of magnetic field strength) we assumed that the thermal power calculated for a sample must be the power coming from the coil, which is known except for the constant k and which is only dependent on the magnetoresistive effect. Therefore, we set the value of
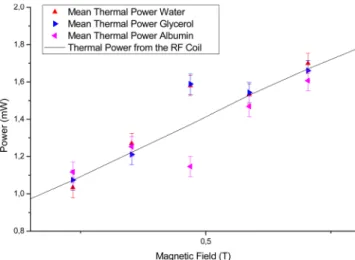
k in (10) to match the calculated power curve with the measured thermal powers (out of the NMR condition). The results for the thermal powers corresponding to the egg-albumin, the glycerol and the distilled water samples are shown in Fig. 6. The thermal power heating the samples, triangles, increases as the magnetic field increases,
in concordance to the predicted magnetoresistive effect, black line.
It is noticed that certain anomalies are presented at the point of 0.46 T, that is, at NMR condition. The measured heating powers differ from the expected at 0.46 T, whilst for the rest of used magnetic strengths the measured powers follow the trend derived from the coil heating. We performed an ANOVA analysis on the data, to question if the NMR points do or do not belong to the calculated power curve, that is, to question if there are or not more thermal effects affecting the sample at the NMR condi-tion, or, contrarily, the observed large differences are only statistical deviations. That is, if the glycerol and the water samples are significantly heated more than their expected value, whereas albumin samples are heated less than the expected value.
In Table 1, the p-value in the ANOVA tests when checking if all the powers belong to the same curve, per each sample type, is clearly under 0.05 (first column), so neglecting the hypothesis: one point at least is not part of the group. When using the other points without including the 0.46 T one, the test does not reject the same hypo-thesis (second column). Although it is not shown, when not including some other point, but including the 0.46 T, again the p-value is always under 0.05: some point still do not belong to the group formed by the rest, that is, does not follow the trend of heating as determined by the coil heating. Therefore, these results indicate that distilled water and glycerol molecules have similar behaviors, in some way they absorb more energy when they are in NMR conditions. On the other hand, the albumin sample seems to be not as warm as it should be, that is, the albumin sample is not absorbing energy by the NMR phenomenon, even it could be releasing energy.
4. Discussion
We have developed a method to measure tiny thermal powers when performing NMR experiments in small samples in the presence of high magnetic fields, with and without nuclear magnetic resonance condition. In this first work, we have tried three different types of samples, related to
Fig. 5. Example of temperature rise in the sample during power absorption experiments.
Fig. 6. (Color online) Thermal power actually heating the sample and thermal power dissipated by the RF coil that heats the sample. The measures were made at different mag-netic field strengths under the same RF irradiation conditions. The samples were distilled water, glycerol and egg-albumin.
Table 1. ANOVA test representing the probability that all experiments belong to the curve described by the Kohler Rule
Sample All experimentsANOVA Without 0.46T experimentsANOVA
Water 0.02162 0.67876
Glycerol 0.00289 0.97208
abundant typical organic substances: distilled water, glycerol and egg-albumin. Because of their nature, we can neglect any other cause as heat source that the antenna, a copper coil around the sample that heats itself by Joule effect; and the NMR related phenomena to be measured. To fix the amount of thermal power delivered to the sample from the electric losses in the antenna, whatever the experiment, we use the same RF excitation (frequency and pulse sequ-encing) while changing the magnetic field strength, so warranting that the NMR takes place at one unique mag-netic field value, at which the NMR condition is met. Since we measure temperatures, we have needed to calib-rate the NMR equipment to calculate the thermal powers that actually were responsible for the measured temper-ature changes. The tempertemper-ature changes out of the NMR condition can be well explained in terms of heating from the antenna selfheating. However, at 0.46 T, when the NMR takes place, some other phenomena appear that should explain the measurement of extra thermal power as compared to the delivered by the coil in the cases of distilled water and glycerol, and the lack of it in the case of egg-albumin. Although the loss of energy as heat in case of NMR has been elsewhere theoretically predicted, it seems that the found amount of power, although very small, is higher than the predicted one. Moreover, the measured lack of power has not been shown in the liter-ature. So, both phenomena seem to be anomalies that deserve further investigations.
Acknowledgements
This work was supported in part by a grant from CONACyT-Mexico to N. Felix-Gonzalez (180890); and a grant by the Technical University of Madrid to A. L. Urbano-Bojorge and N. Felix-Gonzalez.
References
[1] C. M Weil, Biological effects of radiofrequency radia-tion, EPA-600/8-83-026A, (1984) pp. 3.2.
[2] P. Bottomley, Phys. Med. Biol. 23, 630 (2002). [3] F. G. Shellock, Ann. N. Y. Acad. Sci. 649, 260 (1992). [4] F. G. Shellock, J. Magn. Reson. Imaging 12, 30 (2000). [5] P. A. Bottomley, Med. Phys. 8, 510 (1981).
[6] M. J. Hagmann, IEEE T. Microw. Theory 27, 804 (1979). [7] P. Röschmann, Med. Phys. 14, 922 (1987).
[8] T. F. Budinger, IEEE T. Nucl. Sci. 2, 2821 (1979). [9] D. Sperber, Naturwissenschaften 71, 100 (1984). [10] F. G. Shellock, Magn. Reson. Med. 11, 371 (1989). [11] D. L. Parker, IEEE T. Biomed. Eng. 31, 161 (1984). [12] H. Van Koningsveld, Rcl. Trav. Chim. Pay-B 87, 243
(1968).
[13] S. Sugio, Protein Eng. 12, 439 (1999). [14] R. L. White, IEEE T. Magn. 28, 2482 (1992). [15] P. Andris, Meas. Sci. Rev. 1, 115 (2001).