Influence of rumen contents’ processing method on microbial
populations in the fluid and subsequent
in vitro
fermentation
of substrates of variable composition
I.
Mateos
,
M.J.
Ranilla
,
M.
Ramos,
C.
Saro
,
M.D.
Carro
a b s t r a c t
Thein vitrobatch culture technique is being increasingly used to study rumen fermen-tation, but the results are affected by several factors, being the source of the inoculum one of the most relevant. This work was conducted to assess the effects of different processing methods of ruminal contents on microbial populations in the obtained fluid, and its influence on fermentation parameters when the fluid was used as inoculum for in vitroincubations. Rumen contents were obtained from four rumen-fistulated sheep fed a 2:1 alfalfa hay:concentrate diet and subjected to the following treatments: SQ: squeezed through four layers of cheesecloth; FL: SQ treatment and further filtration through a 100-m nylon cloth; STO: blended for three min at 230 rev min−1in a Stomacher®and further filtrations as in SQ. Microbial populations’ abundance and bacterial diversity in the ruminal fluids were analysed by quantitative PCR (qPCR) and automated ribosomal intergenic spacer analysis (ARISA), respectively. Three forages (alfalfa hay, grass hay and barley straw) were incubatedin vitro, either alone or mixed with concentrate (1:1), using each of the ruminal fluids as inoculum. There were no differences between SQ and FL methods in any of the microbial populations analysed, but STO increased the relative abundance ofFibrobacter succinogenesandRuminococcus albus(P< 0.05) and decreased (P< 0.05) the concentration of protozoal DNA compared with SQ. Bacterial diversity was not affected (P> 0.05) by the processing methods. There were no interactions (P> 0.05) between the processing method and the characteristics of the substrates for any of the fermentation parameters analysed. Compared with SQ, the STO method resulted in greater (P< 0.05) methane production and ammonia-N concentrations in 8 h incubations. After 24 h of incubation, the use of STO inoculum increased (P< 0.05) methane production and dry matter degradability compared with SQ, with no differences in the rest of the parameters.
No differences between SQ and FL methods were detected in any parameter. The results show that stomaching the rumen contents prior to inoculation ofin vitrocultures modified some microbial populations, but had only subtle effects on fermentation parameters.
1. Introduction
Thein vitrobatch culture technique is being increasingly used to study ruminal fermentation by incubating substrates in buffered rumen fluid and measuring the main fermentation parameters, such as the concentration of ammonia-N and the production of volatile fatty acid (VFA) and methane. However,in vitrofermentation characteristics are influenced by many factors, such as the source, activity and preservation method of the inoculum, characteristics of the incubated substrate, the incubation medium, and the equipment used, among many others (Rymer et al., 2005; Mould et al., 2005; Yá ˜nez-Ruiz et al., 2016). The diet of the donor animals and the sampling time of rumen contents have been identified as main factors affecting the fermentation characteristics in thein vitrobatch culture technique (Mould et al., 2005; Martinez et al., 2010; Mateos et al., 2015), but another relevant factor is the processing method, as microbial populations differ between the solid and liquid phases of rumen contents and different substrates are more or less sensitive to fermentation by more or less strictly anaerobic bacterial species.
Some studies have analysed the effects of using different combinations of solid and liquid rumen contents as inoculum forin vitroincubations, but most of this work has focused on gas and VFA production and has produced contrasting results.
Lee et al. (2004)observed that using solid-associated bacteria as inoculum forin vitroincubations of different substrates increased the amount of gas and VFA produced after 72 h of fermentation compared with the use of an inoculum of only liquid-associated bacteria. In contrast,Rymer et al. (1999)andBueno et al. (2005)found no effects of the inclusion of solid-associated bacteria in the inoculum. The research on the influence of the processing method of rumen contents on microbial populations in the obtained fluid is limited to bacterial and protozoal populations (Senshu et al., 1980; Mackie et al., 1983; Fliegerova et al., 2014), and there is no information on other microbial populations which play an important role in the fermentative process, such as fungi and methanogenic archaea. Moreover, to our knowledge the influence of the processing method on both the microbial populations in the fluid and subsequentin vitrofermentation characteristics has not yet been addressed.
The aim of this study was therefore to evaluate the effect of three different processing methods of rumen contents on the microbial populations (total and cellulolytic bacteria, protozoa, fungi and methanogenic archaea) and bacterial diversity in the fluid obtained, and to assess their influence on thein vitrofermentation characteristics when the fluid was used to inoculate batch cultures. Six substrates of variable composition were used as it is likely that some processing methods will have a greater influence than others on thein vitrofermentation of a substrate. Our hypothesis was that the fermentation of fibrous substrates would be more affected by the inclusion of solid-associated bacteria in the inoculum than that of starchy substrates. Moreover, the study examined the effects of the processing method at two incubation times (8 and 24 h) because it was hypothesized that any changes in fermentation due to differences in the microbial populations in the ruminal fluids would become less marked as incubation time increased. Finally, the variability among individual donor animals in microbial populations in the obtained rumen fluids was also assessed.
2. Materials and methods
2.1. Donor animals and feeding
Four adult rumen-fistulated sheep (64.5±2.10 kg body weight) were used as donors of ruminal contents. Animals were housed in individual pens with free access to water and a mineral-vitamin mixture. Sheep were fed a 2:1 mixed diet of lucerne hay and a commercial concentrate at energy maintenance level (ARC, 1984) distributed in two equal meals. The diet contained 913, 168, 426 and 269 g of organic matter, crude protein, neutral detergent fibre (aNDF) and acid detergent fibre (ADF) per kg of dry matter (DM), respectively. Sheep management and rumen content withdrawal were carried out in accordance with the Spanish guidelines for experimental animal protection (Royal Decree 53/2013 of February 1st on the protection of animals used for experimentation or other scientific purposes) in line with the European regulations. All the experimental procedures were approved by the Institutional Animal Care and Use Committee of the University of León.
2.2. Processing methods of ruminal digesta
Table 1
Chemical composition (g/kg dry matter) of the substrates used in thein vitroincubations.
Item Forages1 Forage:concentrate mixtures1
AL GR BS CAL CGR CBS
Organic matter 879 926 908 902 931 920
Crude protein 177 94.4 52.4 189 149 128
Neutral detergent fibre (aNDF) 455 616 754 381 487 552
Acid detergent fibre (ADF) 270 314 448 205 227 449
Acid detergent lignin (ADL) 81.1 52.3 60.8 49.5 39.5 42.9
ADL/aNDF (g/g) 0.178 0.087 0.081 0.130 0.085 0.078
1Substrates were alfalfa hay, grass hay and barley straw, either alone (AL, GR and BS, respectively) or mixed 1:1 with a commercial concentrate (CAL,
CGR and CBS, respectively). The concentrate contained 932, 200, 350, 143 and 25.5 g of organic matter, crude protein, aNDF, ADF and ADL per kg of dry matter, respectively.
equal portions that were subjected to one of the following treatments: SQ: rumen contents were filtered through four layers of cheesecloth; FL: SQ treatment followed by filtration through a 100m pore size nylon bag; and STO: rumen contents were placed in Stomacher®standard bags and homogenized with a Stomacher®400 Circulator (Seward Ltd., London, UK) for three min at 230 rpm and afterwards filtered through four layers of cheesecloth. The pH of the fluid was immediately measured with a pH-meter (Crison Basic 20, Crisson Instruments, Barcelona. Spain), 0.8 mL of fluid was added to 0.5 mL of deproteinizing solution (100 g metaphosphoric acid and 0.6 g crotonic acid per L) for VFA analysis, one mL was added to one mL 0.5 M HCl for ammonia-N determination, and 10 mL were immediately frozen and kept at−80◦C until DNA extraction for qPCR and automated ribosomal intergenic spacer analysis (ARISA) analyses. The rest of the fluid was kept under continuous flushing with CO2and immediately used as inoculum for thein vitroincubations.
2.3. Substrates and in vitro incubations
Samples of three forages (alfalfa hay, grass hay and barley straw), either alone or mixed 1:1 with a commercial concentrate for dairy sheep, were used as substrates for thein vitroincubations. The commercial concentrate was composed of barley, corn, soybean meal oat, full fat soya, lupin, oat, fullfat soybean, calcium carbonate, sugarcane molasses, salt, wheat middlings, dicalcium phosphate and mineral-vitamin premix in proportions of 392, 192, 142, 120, 75, 30, 13, 10.2, 7, 4.6, 4.2 and 10 g per kg, respectively, and contained (g/kg DM) 932, 203, 350, 143 and 25.5 g of organic matter, crude protein, aNDF, ADF and acid detergent lignin, respectively. Chemical composition of the forages and the forage:concentrate mixtures is shown in
Table 1.
All substrates were ground to pass through a one mm mesh screen, dried (50◦C for 48 h), and incubated with the fluid obtained by treating the ruminal contents from each sheep by the three processing methods. Samples of each substrate (300 mg of DM) were weighed into 120-mL serum bottles. Ruminal fluids from each processing method were mixed with the buffer solution ofGoering and Van Soest (1970in a proportion 1:4 (mL/mL) at 39◦C under continuous flushing with CO2. Thirty ml of buffered rumen fluid were added into each bottle under CO2flushing. Bottles were sealed with rubber stoppers and aluminum caps and incubated at 39◦C. A total of 48 bottles with substrate (two bottles for each substrate and inoculum) and six bottles without substrate (blanks; two for each inoculum) were incubated for each sheep. Incubation lasted for 8 h in half of the bottles (24 bottles with substrate and three blanks) and for 24 h in the other half. At the end of each incubation time, total gas production was measured following a variation of theTheodorou et al. (1994)method by using a pressure transducer (Delta Ohm DTP704-2BGI, Herter Instruments SL, Barcelona, Spain) and a 20-ml plastic syringe (Dismadel S.L., Madrid, Spain). The syringe plunger was withdrawn until the gas pressure in the head-space of the bottles was returned to ambient pressure, as indicated by a reading of zero on the visual display of the transducer. A gas sample (10 mL) was removed from each bottle and stored in an evacuated tube (Terumo Europe N.V., Leuven, Belgium) for methane analysis. Bottles were then uncapped, the pH was measured immediately, and the fermentation was slowed down by swirling the bottles in iced water. Samples for VFA and ammonia-N analysis were taken as described before. Finally, the contents of the 24 h-incubation bottles were transferred to previously weighed filter crucibles, and the residue of incubation was washed with 50 mL of hot (50◦C) distilled water. Crucibles were dried at 50◦C until constant weight and weighed to calculate apparent DM degradability (DMD). The residue was analyzed for aNDF to calculate true DM degradability (TDMD;Van Soest et al., 1966).
2.4. Analytical procedures
Dry matter (ID 934.01), ash (ID 942.05) and N (ID 984.13) content in the substrates were determined according to the
Association of Official Analytical Chemist (1999). aNDF and ADF analyses were carried out according toVan Soest et al.
(1991)using an ANKOM220 Fibre Analyser unit (ANKOM Technology Corporation, Fairport, NY, USA). Sodium sulfite and
were analyzed by gas chromatography following the procedures described byCarro and Ranilla (2003)andMartinez et al. (2010), respectively.
2.5. DNA extraction, qPCR and automated ribosomal intergenic spacer analysis (ARISA)
To analyze the microbial communities in the ruminal fluids obtained after the different processing methods of ruminal digesta, samples of the ruminal fluid obtained were defrosted, two mL were centrifuged (20,000×g, five min, 4◦C), and the pellets were used for DNA extraction. The pellets were treated with a MiniBeadbeater (three min; Biospec Products, Bartlesville, OK, USA) for mechanical disruption of the microorganisms. Total DNA was extracted in duplicate following the procedure described byYu and Morrison (2004), with the exception that an additional step involving the treatment of samples with cetyltrimethylammonium bromide was included to remove PCR inhibitors. The QIAamp DNA Stool Mini Kit columns (QIAgen, Valencia, CA) were used to purify the DNA. Eluted DNA concentration and absorbance ratios were measured in a Nanodrop ND-1000 (Nano-Drop Technologies, Wilmington, DE, USA).
Absolute quantification of total bacteria and protozoa was performed by qPCR using as standard DNA extracted from bacterial and protozoal pellets previously isolated from the rumen of sheep as described bySaro et al. (2012). The cross-contamination of bacterial DNA in the protozoal DNA was measured by qPCR and subtracted from the concentration determined by spectrophotometry. The populations ofFibrobacter succinogenes, Ruminococcus flavefaciens, Ruminococcus albus, fungi and methanogenic archaea were determined by qPCR in relation to the total bacterial population. A full descrip-tion of the primers used for general bacteria,F. succinogenes, R. flavefaciensand fungi has been given byDenman and McSweeney (2006), and primers used for general protozoa,R. albusand methanogenic archaea have been described by
Sylvester et al. (2004),Koike and Kobayashi (2001)andDenman et al. (2007), respectively. Amplification efficiencies for each primer pair were investigated by examining dilution series (from 10−1to 10−5) of a pooled DNA template in triplicate and plotting the observed Ct values against the logarithm of total DNA concentration. The qPCR was performed in triplicate using an ABI PRISM 7000 Sequence Detection System (Applied Biosystems, Warrington, UK) as described bySaro et al. (2012). Briefly, each PCR reaction mixture (20L final volume) contained 10L SYBR Green PCR Master Mix (Applied Biosystems, Warrington, UK), 0.9L of 20M each primer, 6.2L of milli Q water and 2L of extracted DNA. A no-template (sterile distilled water) negative control was loaded on each plate run to screen for possible contamination and dimer formation and to set background fluorescence for plate normalization.
For the ARISA technique, the DNA was amplified using universal bacterial primers 16S-1392F and 23S-125R as described bySaro et al. (2012). Thermocycling and ARISA technique were conducted in a 2720 Thermal Cycler (Applied Biosystem, Foster City, CA, USA) and a MegaBACE 500 (Amersham Biosciences, Little Chalfont, Bucks, United Kingdom), respectively. Peaks were identified by comparison with an internal size standard using the GeneMarker Software v1.80 (SoftGenetics, State College, PA, USA) and the presence/absence of the different peaks was considered to compare the electropherograms profiles by using a (dis)similarity matrix. The Shannon’s diversity index was used to evaluate the diversity of bacterial communities, and dendrograms were constructed using the percent similarity and unweighted pair-group method using arithmetic averages (UPGMA) options in the MVSP v3.12d software (Kovach Computing Service, Anglesey, Wales, UK). Venn diagrams were constructed with the ARISA presence/absence data to represent the overlapping peaks. Canonical correspondence analysis (CCA) was used to investigate the relationships between the microbial composition of the ruminal fluids (ARISA profiles and microbial populations abundances) and some fermentation measurements after 8 h of incubation using the R package vegan (Oksanen et al., 2015), and the results of the analyses were visualized as ordination biplots. A Monte Carlo permutation test was used (R package ade4;Dray and Dufour, 2007) to test the hypothesis that microbial composition was related to the fermentation measures.
2.6. Calculations and statistical analyses
F. succinogenes, R. flavefaciens,R. albus, fungi and methanogenic archaea DNA abundance was determined relatively to the absolute quantification of total bacteria as described byPfaffl (2001)after correcting for differences in amplification efficiencies between the target and the reference (total bacteria).
Table 2
Influence of processing method of ruminal digesta from sheep and donor animal (SH) on fermentation parameters, total bacterial and protozoal DNA con-centrations and the relative abundance ofRuminococcus flavefaciens,Ruminococcus albus,Fibrobacter succinogenes, fungal and methanogenic archaeal DNA in the fluid, and values of Shannon index and numbers of peaks detected in the automated ribosomal intergenic spacer analysis (ARISA) electropherograms.
Item Processing method (PM)1 SH2 SEM P value
SQ FL STO 1 2 3 4 PM SH
Fermentation parameters
pH 6.83 6.81 6.81 6.70a 6.80b 6.92c 6.83b 0.013 0.60 <0.001
Total VFA (mol) 75.3 74.0 75.9 87.7b 71.3a 70.1a 71.2a 0.58 0.14 <0.001
Individual VFA (mol/100 mol)
Acetate 69.0 69.0 69.1 68.6b 66.3a 69.5c 71.8d 0.21 0.93 <0.001
Propionate 14.5 14.6 14.6 14.7 14.8 14.3 14.4 0.14 0.84 0.21
Butyrate 10.7 10.7 10.4 11.5c 13.2d 9.45b 8.29a 0.161 0.31 <0.001
Isobutyrate 2.03 2.05 2.05 1.67a 1.94b 2.50d 2.05c 0.018 0.86 <0.001
Isovalerate 2.58 2.55 2.67 2.07a 2.44b 3.28c 2.61b 0.038 0.15 <0.001
Valerate 1.02 0.98 1.05 1.13c 1.12c 0.97b 0.85a 0.020 0.13 <0.001
Caproate 0.17 0.16 0.15 0.36c 0.27c 0.05a 0.06a 0.012 0.53 <0.001
Acetate/propionate (mol/mol) 4.76 4.74 4.73 4.68ab 4.47a 4.85bc 4.97c 0.052 0.93 0.005
NH3-N (mg/L) 178 179 179 191c 182b 177b 167a 1.5 0.90 <0.001
Microbial populations
Total bacterial DNA (g DNA/mL) 40.5 43.3 49.5 50.8 36.5 48.9 41.5 2.95 0.17 0.08
Total protozoal DNA (g DNA/mL) 4.00b 2.72ab 1.36a 2.71a 0.66a 5.53b 1.88a 0.578 0.04 0.01
Relative abundance of3
Fibrobacter succinogenes 0.382a 0.386a 0.481b 0.962a 0.361c 0.168b 0.175b 0.0239 0.04 <0.001
Ruminococcus flavefaciens 0.291 0.306 0.327 1.084c 0.083b 0.056ab 0.009a 0.0159 0.35 <0.001
Ruminococcus albus 0.723 0.644 1.165 0.422ab 0.048a 0.868b 2.083c 0.1533 0.09 0.002
Fungi 0.0015 0.0014 0.0014 0.0015 0.0012 0.0024 0.0006 0.00128 0.99 0.16
Methanogenic archaea 0.252 0.285 0.264 0.089a 0.318b 0.376bc 0.285b 0.0182 0.46 <0.001
Bacterial diversity
Shannon index 4.30 4.26 4.27 4.37b 4.23a 4.23a 4.29ab 0.025 0.48 0.04
Number of peaks 74.0 71.0 71.8 78.7b 69.0a 68.7a 72.7ab 1.68 0.47 0.03
For each factor (PM and INO) and within each row, means with a different superscript (a,b) differ (P< 0.05).
1SQ: squeeze through 4 layers of cheesecloth; FL: SQ treatment and further filtration by passing a 100m nylon cloth; STO: treatment with Stomacher®
for 5 min at 230 rpm.
2Numbers 1–4 correspond to individual sheep.
3Microbes DNA measured relative to total bacterial DNA. Values expressed as 102×2−Ct.
3. Results
3.1. Effects of processing methods on fermentation characteristics and microbial populations in the ruminal fluid
As shown inTable 2, there were no effects of the processing method (P= 0.13–0.93) on the pH values and the concentra-tions of ammonia-N and total and individual VFA in the resulting ruminal fluids. In contrast, there were differences (P< 0.01) between individual sheep in all the fermentation parameters analyzed, with the exception of molar proportions of propi-onate (P= 0.84). There were differences (P< 0.05) between individual donors in all the analysed microbial populations, with the exception of total bacteria and fungi (Table 2). However, there were no differences between processing methods (P> 0.05) either in total bacterial DNA concentrations or in the relative abundance ofR. flavefaciens, fungi and methanogenic archaea. Compared with SQ, the STO method increased (P< 0.05) the relative abundance ofF. succinogenesand tended (P< 0.10) to increase that ofR.albus, but decreased (P< 0.05) total protozoal DNA concentrations. There were no differences (P> 0.05) between the fluids obtained by SQ and FL methods in any microbial population. Bacterial diversity in the ruminal fluids, expressed as Shannon index and number of peaks in the ARISA electropherograms, was not affected (P= 0.48 and 0.47, respectively) by the processing method.
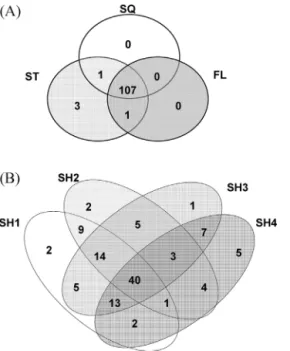
Fig. 1shows the dendrogram of the ARISA profiles of the bacterial communities in the obtained ruminal fluids. The samples clustered into four groups according to the donor sheep, and for sheep 1, 2 and 4 the SQ and FL samples subclustered with a similarity greater than 85%. In contrast, SQ and FL samples from sheep 3 had a similarity lower than 50%, and did not follow the same clustering pattern. As shown in the Venn diagrams (Fig. 2), from the 112 ARISA peaks detected, 107 were present in at least one sample from each treatment, and there were three peaks which were only identified in samples from the STO method. Forty peaks were shared by at least one sample of each sheep, whereas the rest were present in only one animal or shared by two or three animals.
3.2. Effects of processing methods on fermentation parameters
SQ1 FL1 STO1 SQ2 FL2 STO2 SQ3 STO3 FL3 SQ4 FL4 STO4
0.04 0.20 0.36 0.52 0.68 0.84 1.0
Pearson coefficient
Fig. 1.Dendrogram of automated ribosomal intergenic spacer analysis (ARISA) profiles of bacterial communities in ruminal fluid from sheep obtained by squeezing ruminal contents through four layers of cheesecloth (SQ), further filtration of squeezed fluid though a 100m nylon cloth (FL), and treatment with Stomacher®for 3 min at 230 rpm before squeezing through four layers of cheesecloth (STO). Numbers 1–4 correspond to individual sheep.
Fig. 2.Venn diagrams showing the shared and unique peaks in the ARISA electropherograms of ruminal fluid samples obtained by the three treatments (SQ, FL and STO;Fig. 2A) and of ruminal fluid samples from each of the four sheep used as donors (SH1 to SH4;Fig. 2B).
methods of ruminal contents on thein vitrofermentation parameters after 8 and 24 h of incubation are presented in
Tables 3 and 4, respectively. All parameters (P< 0.05) were affected by the individual sheep (averaged values for indi-vidual animals not shown). No processing method×forage, processing method×forage:concentrate ratio, or processing method×forage×forage:concentrate ratio interactions (P= 0.24–0.96) were detected for any parameter measured. Total gas production after 8 h of incubation was not affected by the processing method (P= 0.53), but methane production was greater (P< 0.05) for STO compared with SQ method. The processing method of rumen contents did not influence (P= 0.28–0.88) total or individual VFA production for any substrate after 8 h of incubation (Table 2), with the exception of isovalerate pro-duction, which was lower (P< 0.05) for STO than for SQ method. Using the STO inoculum resulted in increased ammonia-N concentrations (P< 0.05), compared with SQ and FL inoculum.
Table 3
Influence of processing methods to obtain rumen fluid on the fermentation parameters of substrates differing in their forage and forage:concentrate (FC) ratio incubatedin vitrofor 8 h.1
Item Processing method (PM) Forage FC ratio SEM Pvalue2
SQ FL STO AL GR BS Forage FC PM Forage FC Forage×FC
Gas (mol) 1354 1377 1348 1662c 1352b 1066a 1211 1509 46.8 0.53 <0.001 <0.001 <0.001
Methane (mol) 191a 201ab 212b 243c 202b 160a 168 234 13.6 0.04 <0.001 <0.001 0.005
Total VFA (mol) 560 566 571 784c 528b 380a 501 627 35.5 0.28 <0.001 <0.001 <0.001
Individual VFA (mol)
Acetate 370 369 375 522c 347b 248a 341 402 23.0 0.88 <0.001 <0.001 <0.001
Propionate 124 130 132 185c 118b 78a 110 144 9.5 0.12 <0.001 <0.001 <0.001
Butyrate 49.8 51.1 47.6 55.3b 49.3ab 43.9a 36.4 62.7 4.63 0.43 0.001 <0.001 0.04
Isobutyrate 4.19 4.00 4.36 5.15b 3.80a 3.60a 3.59 4.78 0.414 0.33 <0.001 <0.001 0.004
Isovalerate 4.08b 3.55ab 3.31a 4.18b 2.99a 3.77b 2.83 4.47 0.450 0.02 0.001 <0.001 0.002
Valerate 7.32 7.77 7.57 11.9b 5.70a 5.06a 6.77 8.33 0.792 0.62 <0.001 0.001 <0.001
Caproate 0.40 0.83 0.62 0.63 0.61 0.62 0.65 0.59 0.480 0.32 0.99 0.79 0.45
Acetate/propionate (mol/mol) 2.99 2.85 2.85 2.83a 3.00ab 3.21b 3.12 2.81 0.243 0.12 0.006 <0.001 0.25
NH3-N (mg/L) 134a 133a 141b 140b 126a 142b 131 141 4.8 0.01 <0.001 <0.001 0.02
Within PM, forage or FC ratio means with different superscript (a,b,c) differ (P < 0.05).
1Ruminal fluid from sheep obtained by squeezing ruminal contents through four layers of cheesecloth (SQ), filtration of squeezed fluid though a 100m
nylon cloth (FL), and treatment with Stomacher®for 3 min at 230 rpm (STO). Substrates were alfalfa hay (AL), grass hay (GR) and barley straw (BS) either alone (forage) or mixed with concentrate at 50:50 (FC).
2No significant PM×forage, PM×FC or PM×forage×FC interactions were detected (P = 0.24–0.96).
Table 4
Influence of processing methods to obtain rumen fluid on the fermentation parameters of substrates differing in their forage and forage:concentrate (FC) ratio incubatedin vitrofor 24 h.1
Item Processing method (PM) Forage FC ratio SEM Pvalue2
SQ FL STO AL GR BS Forage FC PM Forage FC Forage×FC
Gas (mol) 2254 2287 2285 2719c 2249b 1858a 2024 2526 80.7 0.73 <0.001 <0.001 <0.001
Methane (mol) 480a 471a 510b 604c 481b 376a 432 542 28.4 0.05 <0.001 <0.001 0.006
Total VFA (mol) 956 989 988 1273c 909b 735a 830 1115 60.0 0.27 <0.001 <0.001 <0.001
Individual VFA (mol)
Acetate 610 629 631 821c 586b 454a 541 700 35.3 0.24 <0.001 <0.001 <0.001
Propionate 205 210 213 280c 186b 155a 175 240 11.2 0.16 <0.001 <0.001 <0.001
Butyrate 92.9 101 95.7 111b 94.1a 84.7a 72.0 121 8.99 0.31 <0.001 <0.001 0.15
Isobutyrate 12.0 11.8 12.5 14.3b 10.7a 10.9a 10.5 13.4 0.67 0.12 <0.001 <0.001 <0.001
Isovalerate 16.5 16.3 16.9 19.5b 14.9a 15.3a 14.5 18.7 1.18 0.56 <0.001 <0.001 <0.001
Valerate 16.9 17.7 16.5 24.1c 14.6b 12.4a 15.0 19.1 0.88 0.12 <0.001 <0.001 <0.001
Caproate 2.70 2.81 2.35 2.75 2.76 2.34 2.23 3.01 0.647 0.45 0.44 0.01 0.75
Acetate/propionate (mol/mol) 3.00 3.03 2.98 2.94a 3.15b 2.97ab 3.10 2.94 0.182 0.60 0.03 0.04 0.82
NH3-N (mg/L) 198 201 204 225b 186a 192a 186 216 8.6 0.52 <0.001 <0.001 0.05
DMD (g/100 g) 35.1a 35.4a 38.7b 45.9b 36.9b 27.6a 29.7 43.3 2.23 0.01 <0.001 <0.001 <0.001
TDMD (g/100 g) 49.0a 49.6ab 51.2b 63.2c 48.2b 40.0a 42.7 57.3 1.43 0.03 <0.001 <0.001 <0.001
Methane/DM degraded (mol/g) 3.21 3.14 3.31 3.14 3.33 3.19 3.35 3.08 0.224 0.49 0.58 0.03 0.09
Within PM, forage or FC, means with different superscript (a,b,c) differ (P < 0.05).
1Ruminal fluid from sheep obtained by squeezing ruminal contents through four layers of cheesecloth (SQ), filtration of squeezed fluid though a 100m
nylon cloth (FL), and treatment with Stomacher®for 3 min at 230 rpm (STO). Substrates were alfalfa hay (AL), grass hay (GR) and barley straw (BS) either alone (forage) or mixed with concentrate at 50:50 (FC).
2No significant PM×forage, PM×FC or PM×forage×FC interactions were detected (P = 0.18–0.98).
greater (P< 0.001) productions of gas, methane and VFA (total and individual), but lower (P= 0.02) ammonia-N concentrations than only forage substrates.
Similarly to that observed for the 8 h incubations, no processing method×forage, processing method×forage:concentrate ratio, or processing method×forage×forage:concentrate ratio interactions (P= 0.18–0.98) were detected for any parameter measured after 24 h of incubation (Table 4). The processing method of rumen contents did not affect the production of gas and of total and individual VFA. Using the STO inoculum resulted in increased (P< 0.05) methane production and DMD compared with SQ and FL inocula, but there were no effects of processing method on the ratio methane/DM degraded (P= 0.49) and ammonia-N concentrations (P= 0.52). The STO method also resulted in greater (P< 0.05) values of TDMD compared with those for SQ method.
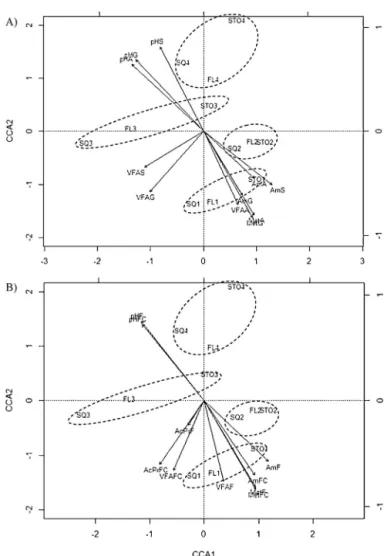
ammonia-Fig. 3.Canonical correspondence analysis (CCA) plot of microbial populations in the inoculum and fermentation parameters in 8 h-incubations of forages (A: alfalfa hay; G: grass hay; S: barley straw;Fig. 3A) or substrates with different forage:concentrate ratio (F: 100% forage; FC: 50:50 forage:concentrate; Fig. 3B), with arrows indicating increasing values of fermentation parameters. Each label corresponds to an individual inoculum obtained by squeezing ruminal contents through four layers of cheesecloth (SQ), filtration of squeezed fluid through a 100m nylon cloth (FL) or treatment with Stomacher® (STO), and numbers 1–4 correspond to individual sheep. Circles were drawn for helping in samples identification. AcPr: acetate:propionate ratio; Am: Ammonia-N; Met: CH4; VFA: total VFA; Bac: Total bacteria; Prt: total protozoa; Arq: methanogenic archaea; Fs:Fibrobacter succinogenes; Rf:Ruminococcus
flavefaciens; Ra:Ruminococcus albus.
N concentrations and productions of gas, methane and total VFA, as well as lower (P< 0.001) DMD and TDMD values than substrates containing concentrate. In contrast, forage substrates had greater (P= 0.03) methane/DM degraded ratios than those containing concentrate.
4. Discussion
Three different processing methods were chosen for this study. The SQ method is widely used forin vitroincubations in batch cultures of mixed ruminal microorganisms (Yá ˜nez-Ruiz et al., 2016), as it separates easily the solid and liquid phases of rumen digesta; however, the SQ inoculum can contain small feed particles with associated microorganisms that can influence the fermentation pattern. To avoid this effect a further filtration through a nylon cloth with a pore size of 100m was performed beforein vitroincubation (FL method). A great proportion of the ruminal microorganisms can be attached to feed particles, especially in animals fed high-forage diets (Cheng et al., 1995;Yá ˜nez-Ruiz et al., 2016). Previous studies (Martínez et al., 2009; Ramos et al., 2009a) showed that treating the ruminal contents with a Stomacher®detached a greater percentage of solid-associated bacteria compared with other treatments, and produced ruminal fluid with the greatest similarity index between the bacterial communities in the rumen contents and in the resulting fluid. Our hypothesis was that including solid-associated bacteria in the inoculum (STO treatment) would result in improved fermentation, especially for high-fiber substrates. To test this hypothesis we used substrates of variable composition, and determined the main fermentation parameters at two incubation times (8 and 24 h), as differences between substrates may decrease or even disappear with increasing incubation time (Kamel et al., 2008; Mateos et al., 2014). Previous studies have investigated the effects of the processing method of rumen contents on gas production profiles (Cone et al., 1996; Lee et al., 2004; Pell and Schofield, 1993) and fermentation parameters (Lee et al., 2004; Rymer et al., 1999; Senshu et al., 1980), but few have looked into the effects on rumen microbial composition (Mackie et al., 1983; Martínez et al., 2009; Ramos et al., 2009a), and to our knowledge none has addressed both of them.
The processing method did not significantly affect total bacterial DNA concentration, but this value was 22.2% higher with STO method than with SQ method, which may have been due to a greater detachment of bacteria from the solid phase. In agreement with this hypothesis,Mackie et al. (1983)found that the treatment of solid rumen digesta with Ultra-Turrax® or Stomacher® for one min almost doubled the counts of total culturable and lactate-utilizing bacteria compared with the counts obtained after manual swirling to suspend solid particles; in contrast, the counts of cellulolytic bacteria were decreased. The study ofMackie et al. (1983)was conducted on the basis of culture viability and the authors discussed that the poor anaerobiosis was responsible for at least some of the lethal action of the Ultra-Turrax®or Stomacher®treatments on cellulolytic bacteria. This effect could help to explain the lack of influence of the processing methods used in our study on most fermentation parameters, despite that the STO method resulted in significantly greater amounts ofF. succinogenesand
R. albusand numerically greater amounts of bacteria. In fact,Mackie et al. (1983)conducted some experiments inside an anaerobic cabinet and observed that both Ultra-Turrax®and Stomacher®treatments increased by 2–3 fold total culturable, lactate-utilizers and cellulolytic bacteria compared with the manual swirling to suspend solid particles.
Previous studies have shown that stomaching the ruminal digesta has an impact on both the amount and profile of bacteria recovered in the fluid.Ramos et al. (2009a)andMartínez et al. (2009)compared different methods of detaching solid-associated bacteria from ruminal digesta from sheep and Rusitec fermenters, respectively. In both studies the treatment with Stomacher®for five min at 230 rpm detached a greater percentage of solid-associated bacteria (68.7%, averaged value) compared with either incubating the digesta with a solution of methylcellulose (54.4%) or freezing before treating with Stomacher®(62.6%). Based on these results, we decided to use the STO method in our study, but the treatment time was reduced to three min to decrease the oxygen exposure, and this may have reduced the amount of bacteria detached.
The relative abundance ofF. succinogenesandR. albuswas, respectively, 25.9 and 65.8% greater in STO than in SQ inoculum, butR. flavefaciensabundance was not affected by the processing method.Kudo et al. (1987)observed that these cellulolytic species differ in the nature of both their attachment to cellulose and their enzymatic attack, which could explain the variable influence of the STO method observed on each species.F. succinogenesis a particularly important species for fiber diges-tion in the rumen, being metabolically active on less digestible fiber tissues (Koike and Kobayashi, 2009), and its greater abundance in STO inoculum could help to explain the observed increase in the DMD and TDMD of the substrates when they were incubated with STO inoculum. Among the major cellulolytic communities, ruminococci are major contributors to H2production (Chaucheyras-Durand et al., 2010), and the greater proportion ofR. albusin STO inoculum agrees with the higher methane production after 8 and 24 h of incubation. The lack of significant differences between SQ and FL inoculum in any of the microbial populations analysed might indicate that those associated to the small feed particles added with SQ inoculum did not represent a significant contribution to total microbial populations. The lack of differences between SQ and FL methods in any fermentation parameter is consistent with this hypothesis.
sheep in the number of peaks and Shannon index values (Table 2). Moreover, although the donor sheep received the same diet, there were differences among them in most of the fermentation parameters and microbial population measured in the rumen fluids, which indicates the strong effect of donor animal. Differences in the fermentation parameters can be explained by differences in the microbial populations and/or in their fermentative activities (Yá ˜nez-Ruiz et al., 2016), which have been associated to variations in passage rate, rumen volume and morphology, and eating behavior, among other factors (Kittelmann et al., 2014).
The processing method had a marked influence on total protozoal DNA concentrations, which were 1.5 and 2.9 times greater in the SQ than in FL and STO samples, respectively. The lower protozoal DNA concentration in FL inoculum was attributed to the retention of bigger protozoa (>100m) in the nylon cloth used for the filtration. The STO inoculum had the lowest protozoal DNA concentration, which could be due to physical damage to the labile protozoa membrane, allowing the liberation and shearing of intracellular DNA during stomaching and its further loss during the centrifugation of the samples prior to DNA extraction. These results are in agreement with those ofMackie et al. (1983), who found out that stomaching ruminal contents for one min decreased the counts of ciliate protozoa by 2.3 fold compared with a treatment consisting in manual swirling to suspend solid particles, and that all large holotrichs and entodiniomorphs (100–150×60–90m) were destroyed.
Despite of the observed shifts of microbial populations, the fermentation patterns of substrates differing in forage and forage:concentrate ratio after 8 or 24 h incubation were only slightly affected by the tested processing methods. The only differences between SQ and STO methods were detected in methane production, DMD and TDMD. In agreement with our results,Rymer et al. (1999)found that the gas production kinetics and VFA production and profile of a single forage were not significantly affected by stomaching the rumen contents for 20 s compared with squeezing the rumen contents through four layers of cheese-cloth, but stomaching significantly increased the organic matter apparent degradability of the substrate. Similarly,Bueno et al. (2005)observed that including increasing proportions of solid-associated bacteria in the ruminal inoculum had no effect on the parameters of gas production kinetics of different feedstuffs commonly fed to ruminants in the tropics, but increased their organic matter apparent degradability. In contrast,Lee et al. (2004)observed that when using either only solid- or only liquid-associated bacteria as inoculum for 24 h-incubations of different substrates (grass silage, concentrate and a 60:40 mixture of silage and concentrate), both the total gas production and VFA production were higher with the inoculum containing solid-associated bacteria. In our experiment, the SQ and FL inoculum contained mainly liquid associated bacteria, but STO inoculum likely contained some detached bacteria from solid phase, as indicated by the greater abundance of some cellulolytic bacteria. Whether the detached bacteria were responsible for the subtle differences observed in methane production and substrate degradation remains unclear. The processing of rumen contents for its use as inoculum implies the exposure of microorganisms to oxygen, and the likely increased exposure by stomaching may have counteracted the expected positive effect of including detached solid-associated bacteria in the inoculum onin vitrofermentation.
The lack of correlation between the microbial populations and fermentation parameters in the CCA analysis may be explained by the complexity of the rumen microbial ecosystem and the intricate interactions among microorganisms in the fermentative process. Moreover, it has to be noticed that both microbial populations and fermentation parameters were only slightly affected by the processing method in our study and this reduced the range of variation in the data, difficulting the detection of correlations among these measurements. In contrast, the ARISA analysis was able to identify subtle differences between the processing methods tested, and the Monte Carlo permutation test revealed a correlation between the ARISA profile and the fermentation parameters. In agreement with these results,Hernandez-Sanabria et al. (2010)andCarberry et al. (2012)observed that the bacterial structure, assessed by PCR-DGGE analysis, in the rumen of beef cattle was associated with fermentation parameters.
In cows fed diets with variable content of carbohydrates and protein,Belanche et al. (2012)analyzed the correlations between the abundance of specific microbial groups and some fermentation parameters. In agreement with their results, the abundance of bacteria, protozoa and methanogenic archaea showed no significant correlation (P> 0.05) with total VFA production after 8 h of fermentation (results not shown), butBelanche et al. (2012)found a significant correlation between VFA concentrations and fungal abundance at five h after feeding that was not detected in our study. In our study, the abundance ofF. succinogenesandR. flavefaciensin the inoculum was positive related (P< 0.05) to the amount of methane produced (for the 3 forages and for the forage and mixed substrates), which is consistent with both the greater abundance of methanogens and the greater methane production observed for STO compared with SQ and FL methods. The negative relationship (P< 0.05) between the abundance ofF. succinogenesandR. flavefaciensin the inoculum and the pH after 8 h of incubation may reflect the greater fermentation (with associated lower pH values) produced by those inocula with greater abundances of these cellulolytic bacteria, as the range of pH values (from 6.90 to 7.56) were adequate for the growth of both of them. Finally, the lack of correlation between the abundance of methanogenic archaea and the production of methane observed in our study agrees well with the results previously reported in the literature (Abecia et al., 2012; Romero-Perez et al., 2014).
concentrate resulted in greater amounts of most fermentation products than that of forage substrates both at 8 and 24 h. The fermentation of the mixed substrates resulted in greater methane productions, but the amounts were lower when methane was expressed per unit of DM degraded.
5. Conclusion
The results of this experiment show that the tested methods of processing the rumen contents to obtain fluid forin vitro
incubations influenced the microbial populations present in the inoculum, but affected only slightly the fermentation char-acteristics of substrates of variable chemical composition. Under the conditions of our study, stomaching the rumen contents did not affect the abundance of fungi and methanogenic archaea in the obtained fluid, but it increased the abundance of total and cellulolytic bacteria and decreased that of protozoa. Stomaching the rumen contents for its use as inoculum introduces an additional step in the procedure and increases the risk of exposing the microorganisms to oxygen, which may have coun-teracted the positive effect of including detached solid-associated bacteria in the inoculum. Studies comparing stomaching the rumen contents inside and outside an anaerobic chamber are needed to confirm this hypothesis.
Conflict of interest
The authors declare that there are no conflicts of interest.
Acknowledgements
This work was supported by the Spanish Ministry of Economy and Competitiveness under the Project AGL2011-22628. We would like to thank Dr. Benjamin Rabanal for his help with qPCR and ARISA analyses.
References
ARC, 1984.The Nutrients Requirements of Ruminant Livestock, Suppl. No. 1. Commonwealth Agricultural Bureaux, Slough, UK. Abecia, L., Toral, P.G., Martín-García, A.I., Martínez, G., Tomkins, N.W., Molina-Alcaide, E., Newbold, C.J., Ya ˜nez-Ruiz, D.R., 2012.Effect of
bromochloromethane on methane emission, rumen fermentation pattern, milk yield, and fatty acid profile in lactating dairy goats. J. Dairy Sci. 95, 2027–2036.
Association of Official Analytical Chemist, 1999.Official Methods of Analysis. Association of Official Analytical Chemists, Gaithersburg, MD, USA. Belanche, A., Doreau, M., Edwards, J.E., Moorby, J.M., Pinloche, E., Newbold, C.J., 2012.Shifts in the rumen microbiota due to the type of carbohydrate and
level of protein ingested by dairy cattle are associated with changes in rumen fermentation. J. Nutr. 142, 1684–1692.
Bueno, I.C.S., Cabral Filho, S.L.S., Gobbo, S.P., Louvandini, H., Vitti, D.M.S.S., Abdalla, A.L., 2005.Influence of inoculum source in a gas production method. Anim. Feed Sci. Technol. 123–124, 95–105.
Carberry, C.A., Kenny, D.A., Han, S., McCabe, M.S., Waters, S.M., 2012.Effect of phenotypic residual feed intake and dietary forage content on the rumen microbial community of beef cattle. Appl. Environ. Microbiol. 78, 4949–4958.
Carro, M.D., Ranilla, M.J., 2003.Influence of different concentrations of disodium fumarate on methane production and fermentation of concentrate feeds by rumen micro-organismsin vitro. Br. J. Nutr. 90, 617–623.
Carro, M.D., Valdés, C., Ranilla, M.J., González, J.S., 2000.Effect of forage to concentrate ratio in the diet on ruminal fermentation and digesta flow kinetics in sheep. Anim. Sci. 70, 127–134.
Chaucheyras-Durand, F., Faqir, F., Ameilbonne, A., Rozand, C., Martin, C., 2010.Fates of acid-resistant and non-acid-resistant Shiga toxin-producing Escherichia coli strains in ruminant digestive contents in the absence and presence of probiotics. Appl. Environ. Microbiol. 76, 640–647.
Cheng, K.J., McAllister, T.A., Costerton, J.W., 1995.Biofilms of the ruminant digestive tratc. In: Lapin-Scott, H.M., Costerton, J.W. (Eds.), Microbial Boifilms. Cambridge University Press, Cambridge, pp. 221–232.
Cone, J.W., van Gelder, A.H., Visscher, G.J.W., Oudshoorn, L., 1996.Influence of rumen fluid and substrate concentration on fermentation kinetics measured with a fully automated time related gas production apparatus. Anim. Feed Sci. Technol. 61, 113–128.
Denman, S.E., McSweeney, C.S., 2006.Development of a real-time PCR assay for monitoring anaerobic fungal and cellulolytic bacterial populations within the rumen. FEMS Microbiol. Ecol. 58, 572–582.
Denman, S.E., Tomkins, N., McSweeney, C.S., 2007.Quantitation and diversity analysis of ruminal methanogenic populations in response to the antimethanogenic compound bromochloromethane. FEMS Microbiol. Ecol. 62, 313–322.
Dray, S., Dufour, A.B., 2007.The ade4 package: implementing the duality diagram for ecologists. J. Stat. Softw. 22, 1–20.
Fliegerova, K., Tapio, I., Bonin, A., Mrazek, J., Callegari, M.L., Bani, P., Bayat, A., Vilkki, J., Kopeˇcn ´y, J., Shingfield, K.J., Boyer, F., Coissac, E., Taberlet, P., Wallace, R.J., 2014.Effect of DNA extraction and sample preservation method on rumen bacterial population. Anaerobe 29, 80–84.
Goering, H.K., Van Soest, P.J., 1970.Forage fiber analyses: apparatus, reagents, procedures, and some applications. In: Agriculture Handbook. Agricultural Research Service, U.S. Dept. of Agriculture, Washintong, DC, USA.
Hernandez-Sanabria, E., Guan, L.L., Goonewardene, L.A., Li, M., Mujibi, D.F., Stothard, P., Moore, S.S., Leon-Quintero, M.C., 2010.Correlation of particular bacterial PCR-denaturing gradient gel electrophoresis patterns with bovine ruminal fermentation parameters and feed efficiency traits. Appl. Environ. Microbiol. 76, 6338–6350.
Kamel, C., Greathead, H.M.R., Tejido, M.L., Ranilla, M.J., Carro, M.D., 2008.Effect of allicin and diallyl disulfide onin vitrorumen fermentation of a mixed diet. Anim. Feed Sci. Technol. 145, 351–363.
Kittelmann, S., Pinares-Pati ˜no, C.S., Seedorf, H., Kirk, M.R., Ganesh, S.V., McEwan, J.C., Janssen, P.H., 2014.Two different bacterial community types are linked with the low-methane emission trait in sheep. PLoS One 9 (7), e103171.
Koike, S., Kobayashi, Y., 2001.Development and use of competitive PCR assays for the rumen cellulolytic bacteria: fibrobacter succinogenes, ruminococus albus and ruminococcus flavefaciens. FEMS Microbiol. Lett. 204, 361–366.
Koike, S., Kobayashi, Y., 2009.Fibrolytic rumen bacteria: their ecology and functions. Asian-Australas. J. Anim. Sci. 22, 131–138.
Kudo, H., Cheng, K.J., Costerton, J.W., 1987.Electron microscopic study of the methylcellulose-mediated detachment of cellulolytic rumen bacteria from cellulose fibers. Can. J. Microbiol. 33, 267–272.
Lee, S.S., Chang, M.B., Ha, J.K., 2004.Effects of bacterial fraction and proportion of silage and concentrate on rumen fermentation and gas production profile. Asian Australas. J. Anim. Sci. 17, 643–647.
120 I. Mateos et al. / Animal Feed Science and Technology 220 (2016) 109–120
Martínez, M.E., Ranilla, M.J., Ramos, S., Tejido, M.L., Saro, C., Carro, M.D., 2009.Evaluation of procedures for detaching particle-associated microbes from forage and concentrate incubated in Rusitec fermenters: efficiency of recovery and representativeness of microbial isolates. J. Anim. Sci. 87, 2064–2072.
Martinez, M.E., Ranilla, M.J., Tejido, M.L., Ramos, S., Carro, M.D., 2010.The effect of the diet fed to donor sheep onin vitromethane production and ruminal fermentation of diets of variable composition. Anim. Feed Sci. Technol. 158, 126–135.
Mateos, I., Ranilla, M.J., Saro, C., Díaz, A., Carro, M.D., 2014.Influence of diet of donors and substrate characteristics onin vitromethane production at different incubation times. Proc. Aust. Soc. Anim. Prod. 30, 162 (Abstract).
Mateos, I., Ranilla, M.J., Saro, C., Carro, M.D., 2015.Comparison of fermentation characteristics and bacterial diversity in the rumen of sheep and in batch cultures of rumen microorganisms. J. Agric. Sci., 1–10.
Mould, F.L., Kliem, K.E., Morgan, R., Mauricio, R.M., 2005.In vitromicrobial inoculum: a review of its function and properties. Anim. Feed Sci. Technol. 123–124, 31–50.
Oksanen, J., Blanchet, F.G., Kindt, R., Legendre, P., Minchin, P.R., O’Hara, R.B., Simpson, G.L., Solymos, P., Stevens, M.H.H., Wagner, H. 2015. Vegan: Community Ecology Package. R package version 2. 3-2. http://CRAN.R-project.org/package=vegan.
Pell, A.N., Schofield, P., 1993.Computerized monitoring of gas production to measure forage digestionin vitro. J. Dairy Sci. 76, 1063–1073. Pfaffl, M.W., 2001.A new mathematical model for relative quantification in real time RT-PCR. Nuc. Acids Res. 29, e45.
Ramos, S., Tejido, M.L., Ranilla, M.J., Martínez, M.E., Saro, C., Carro, M.D., 2009a.Influence of detachment procedure and diet on recovery of solid-associated bacteria from sheep ruminal digesta and representativeness of bacterial isolates as assessed by automated ribosomal intergenic spacer analysis-polymerase chain reaction. J. Dairy Sci. 92, 5659–5668.
Ramos, S., Tejido, M.L., Martínez, M.E., Ranilla, M.J., Carro, M.D., 2009b.Microbial protein synthesis, ruminal digestion, microbial populations, and N balance in sheep fed diets varying in forage to concentrate ratio and type of forage. J. Anim. Sci. 87, 2924–2934.
Romero-Perez, A., Okine, E.K., McGinn, S.M., Guan, L.L., Oba, M., Duval, S.M., Kindermann, M., Beauchemin, K.A., 2014.The potential of 3-nitrooxypropanol to lower enteric methane emissions from beef cattle. J. Anim. Sci. 92, 4682–4693.
Rymer, C., Huntington, J.A., Givens, D.I., 1999.Effects of inoculum preparation method and concentration: method of inoculation and pre-soaking the substrate on the gas production profile of high temperature dried grass. Anim. Feed Sci. Technol. 78, 199–213.
Rymer, C., Huntington, J.A., Williams, B.A., Givens, D.I., 2005.In vitrocumulative gas production techniques: history, methodological considerations and challenges. Anim. Feed Sci. Technol. 123–124, 9–30.
Saro, C., Ranilla, M.J., Carro, M.D., 2012.Postprandial changes of fiber-degrading microbes in the rumen of sheep fed diets varying in type of forage as monitored by real-time PCR and automated ribosomal intergenic spacer analysis. J. Anim. Sci. 90, 4487–4494.
Saro, C., Ranilla, M.J., Cifuentes, A., Rossello-Mora, R., Carro, M.D., 2014.Technical note: comparison of automated ribosomal intergenic spacer analysis and denaturing gradient gel electrophoresis to assess bacterial diversity in the rumen of sheep. J. Anim. Sci. 92, 1083–1088.
Senshu, T., Nakamura, K., Sawa, A., Miura, H., Matsumoto, T., 1980.Inoculum forin vitrorumen fermentation and composition of volatile fatty acids. J. Dairy Sci. 63, 305–312.
Sylvester, J.T., Karnati, S.K.R., Yu, Z.T., Morrison, M., Firkins, J.L., 2004.Development of an assay to quantify rumen ciliate protozoal biomass in cows using real-time PCR. J. Nutr. 134, 3378–3384.
Theodorou, M.K., Williams, B.A., Dhanoa, M.s., McAllan, A.B., France, J., 1994.A simple gas production method using a pressure transducer to determine the fermentation kinetics of ruminant feeds. Anim. Feed Sci. Technol. 48, 185–197.
Van Soest, P.J., Wine, R.H., Moore, L.A., 1966.Estimation of the true digestibility of forages by thein vitrodigestion of cell walls. In: 10th International Grassland Congress Proceedings, Helsinki.
Van Soest, P.J., Robertson, J.B., Lewis, B.A., 1991.Methods for dietary fiber, neutral detergent fiber, and nonstarch polysaccharides in relation to animal nutrition. J. Dairy Sci. 74, 3583–3597.
Weatherburn, M.W., 1967.Phenol-hypochlorite reaction for determination of ammonia. Anal. Chem. 39, 971–974.
Yá ˜nez-Ruiz, D.R., Bannink, A., Dijkstra, J., Kebreab, E., Morgavi, D.P., O’Kiely, P., Reynolds, C.K., Schwarm, A., Shingfield, K.J., Yu, Z., Hristov, A.N., 2016. Design, implementation and interpretation ofin vitrobatch culture experiments to assess enteric methane mitigation in ruminants—a review. Anim. Feed Sci. Technol. (in press).