A methodology to compute emission projections from road
transport (EmiTRANS)
Julio Lumbreras Rafael Borge Alberto Guijarro Jose M. Lopez M. Encarnacion Rodriguez
A B S T R A C T
Atmospheric emissions from road transport have increased all around the world during the last decades more rapidly than from other pollution sources. For instance, they contribute to more than 25% of total CO, C02, NOx, and fine particle emissions in most of the European countries. This situation shows the importance of road transport when complying with emission ceilings and air quality standards applied to these pollutants.
This paper presents a modelling system to perform atmospheric emission projections (simultaneously both air quality pollutants and greenhouse gases) from road transport including the development of a tailored software tool (EmiTRANS) as a planning tool. The methodology has been developed with two purposes: 1) to obtain outputs used as inputs to the COPERT4 software to calculate emission projections and 2) to summarize outputs for policy making evaluating the effect of emission abatement measures for a vehicle fleet.
This methodology has been applied to the calculation of emission projections in Spain up to 2020 under several scenarios, including a sensitivity analysis useful for a better interpretation and confidence building on the results. This case study demonstrates the EmiTRANS applicability to a country, and points out the need for combining both technical and non-technical measures (such as behavioural changes or demand management) to reduce emissions, indirectly improving air quality and contributing to mitigate climate change.
1. Introduction
Economic growth generates a sequence of environmental problems that become noticeable at the local scale [1] before causing evident regional or global effects. Increased mobility demands and consequent road transport growth constitute an example of this issue. Road transport is a major source of air pollutant emissions all around the world, particularly in urban areas. Moreover, its contribution to total emissions has increased during the last decades more rapidly than other sources [2,3]- According to the International Energy Agency, this tendency may continue in the mid-term. The World Energy Outlook Reference Case foresees a 50% increase of transport energy use in OECD countries between 2000 and 2030, despite
recently adopted and ongoing policy initiatives intended to dampen this growth [4],
the need to develop strategies to control vehicular emissions through technological and socioeconomical measures in order to achieve a more sustainable mobility [11]. Such abatement measures usually entail relevant economic and social costs [12]. As a consequence, to prevent the implementation of costly and unpopular measures with limited effect on emission re-ductions, model-based assessment systems are needed for the evaluation of emission abatement strategies and emission scenarios, especially in the transport sector [13,14], during the political decision making process and prior to their performance.
As shown in Borge et al. [15], these road transport models have evolved from formulations based on the average speed to those that define different traffic situations and more realistic vehicle driving patterns. A comprehensive literature review is provided in Smit et al. [16], were the authors present a meta-analysis of 50 studies dealing with the validation of various types of traffic emission models with increasing complexity (from Average-speed' models, to 'Modal' models through 'Traffic-situation' models, 'Traffic-variable' models, and 'Cycle-variable' models). A more elaborated discussion on their complexity, advantages and disadvantages is presented in Smitetal. [17].
In Europe, the main model applied to estimate road traffic emissions at either national or regional level for reporting purposes has so far been the European Environment Agency (EEA) software called COPERT4 [18]. This model is able to estimate the fuel consumption and exhaust emissions from vehicles within a specific area and is currently integrated in the EMEP/EEA methodology for emission computation [19],
The development of abatement strategies implies not only emission models, but also methodologies to assess the effect of policies and measures, even assuming their associated uncertainties that could demand alternative approach to policymaking, especially for long-term transport policies [20]. In this sense, some important efforts have been made worldwide in the last few years. Most studies rely on a common methodological framework based on the projection of activity data and emission factors taking into account socio-economical drivers, legislation and technological fac-tors [21]. This approach is conceptually rather simple but its implementation may vary widely depending on the target sectors and pollutants and the temporal horizon and detail of the projections. Very often emission projections are related to very specific location, sources and/or pollutants. Inter alia Seika et al. [22] estimated the changes in the concentration of NOx and other pollutants from vehicle emissions under different traffic control strategies; Saslensminde [23] presented cost-benefit analyses of walking and cycling, planning to reduce the effect of motorized transport revealing that the investment in walking and cycling networks has a net benefit for the society. Turton and Moura [24] looked into potential benefits of the penetration of electric vehicles under several long-term scenarios whilst McDowall [25] identified hydrogen technologies as an important option for deep decarbonisation of the transport sector. Other studies such as Shrestha et al. [26] focused on determining cost effective transport technologies and energy options to reduce atmospheric emissions in a city for future years, resulting in scenarios where gasoline and diesel vehicles were replaced by LPG, electric and hybrid vehicles improving local air quality for all pollutants except CO.
At the European Level, Giannouli et al. [27] investigate the effects of specific emission control measures on the air quality of urban centres and local area hotspots applying a sequence of regional, urban and local scale models.
All these examples apply different methodologies with their advantages and disadvantages mainly concerning the level of detail of policies and measures, types of vehicles affected and spatial scale. However, as authors are aware, only the TREMOVE model [28] evaluates emission reductions in road transport planning involving both technical and non-technical measures. Technical measures are those end of pipe actions that reduce emissions by technological changes (catalytic systems, filter, etc.) whilst non-technical measures include behavioural changes (e.g. downsizing cars), demand management, and changes in energy mix. Its scope, however, avoids detailed calculations for specific countries.
This paper presents a methodology to estimate detailed atmospheric emissions from road transport for a country/region including the development of a tailored software tool and considering technical and non-technical measures. This contri-bution reports the development and application of the emission projection methodology for road TRANSport (EmiTRANS), a model to evaluate emission under particular conditions for the road transport model, providing therefore a necessary comple-ment to forecast models used for general planning and sectoral analysis [29]. The aim of the EmiTRANS model is twofold:
- to generate the inputs needed to run COPERT under any particular scenario,
- to provide a platform for the study of the effect of the implementation of policies and measures (P&M) on emis-sions, including both technical and non-technical options.
The methodological approach and model structure are described in Section 2. Afterwards, a case study is shown for a better understanding of the model capabilities. The system was used to calculate emission projections from road transport in Spain up to 2020 under several scenarios. The application includes a preliminary sensitivity analysis that may be relevant to build the confidence needed for the decision-making process. This can also be used to identify areas in the model that need better refinement to reduce uncertainty. The main results from this application are reported in Section 3. Discussion and conclusions regarding both, the system itself and the case study are presented in Section 4.
2. Methodology
2.1. Model objectives and theory
The aim of the paper is to develop a model to help policy making on road transport sector at any spatial level. Consid-ering that COPERT4 was selected as the software to estimate air emissions and it needs several inputs to be run, the model has to meet the following two objectives: 1) to obtain outputs (MS Excel™ spreadsheets) to be directly used as inputs to COPERT4, and 2) to summarize some other outputs that are particularly useful for policy making (e.g. mileage, technology distribution, and driving mode sharing).
adapted for the transport sector, analysing the factors that affect atmospheric emissions and developing specific algorithms to estimate future evolution according to main social drives (population, economic growth) and considering different tech-nical and non-techtech-nical policies and measures. This method has limitations, including consistency, measures applicability, etc. as discussed in Lumbreras et al. [21 ]. However, the main issue when dealing with emission projections is the associated uncertainty. Several options to quantify this uncertainty are presented in Lumbreras et al. [30],
2.2. Model development
To meet the abovementioned purposes, a software tool called EmiTRANS was developed. This tool may be applied to any vehicle fleet (e.g. for a city, a company, a country, and a region) and for a future temporal period up to 50 years.
EmiTRANS methodology consists of three parts as shown in Fig. 1 The first part consists of the incorporation of input data which are divided into two types: i) factors that are highly influenced by P&M (referred to as variables) and ii) factors that do not depend on P&M because they are related to climatic issues or need structural or long-term changes to evolve (referred to as parameters, e.g. average temperatures and vehicle life curves).
Inputs related to vehicle mobility (i.e. every variable and parameter but those constant for the country such as tem-peratures) should be split into six different vehicle types (or sectors): passenger cars, light duty vehicles, buses, heavy duty vehicles, mopeds, and motorcycles. For each sector,
information on fuel consumption, technologies, driving modes, average speed, etc. according to the list in Table 1 is required. To maximize the flexibility of the system, some of the inputs are optional or can be provided in a more aggregated manner depending on data availability. That is, it is not necessary to introduce information for all the variables as the programme can derive them from other related variables or use default values included in the model. For instance, if there is no available data for future mileage per vehicle, the tool applies the mileage used in the reference year (i.e. the last year with official data used as a reference for emission projections). However, when non-specific data are used, uncertainties in-crease and model applications might be limited, especially for policy making purposes.
The second part of the EmiTRANS transforms implicit variables (those that are not directly used in the EMEP/EEA methodology, e.g. mileage in units of passenger-km) into explicit variables (e.g. mileage in veh-km) through the application of factors (e.g. occupancy rates). Afterwards, Quality Assurance/ Quality Control (QA/QC) procedures are applied (e.g. checking that the sum of subsectors' percentage in each sector is equal to 100 and contrast if parameters are within a user-predefined range), that reduce model uncertainties.
The third part performs the corresponding computations to obtain COPERT variables. As an example of how algorithms were designed, Fig. 2 shows the procedure to disaggregate future new vehicles by technology. This method is similar to the procedure followed by Zachariadis et al. [31 ] to simulate the fleet turnover considering not only vehicle number but also total mileage. Consequently, the composition of future-year
Policies and Measures (P&M)
• Scrapping systems • Urban planning • Biofuel promotion •Taxes
• Reduction of mobility
•Etc. 1=>
Input variables
Passengers & Freight Fuel use
Driving modes Vehicles Technologies
Temporal assumptions: Data are kwon for year n Hypothesis adopted for the period:
n + 1 - > n + k
EmiTRANS
Input Parameters Average minimum and maximum temperatures Life vehicle curves Factor for mileage reduction for vehicle ageing
£
Calculation algorithms
^
^
Outputs
Vehicles number Average mileage Average speed Driving mode distribution Total mileage per vehicle
Other outputs
Mobility distribution % of old vehicles Others
H
COPERT4 • EmissionsTable 1
Selection of factors with influence in emissions generation.
Scope Factors determining emissions Units
Passengers & freight
Fuel use
Driving modes
Vehicles
Technologies
Meteorological factors
Passenger mobility Freight transport
Occupancy rate for passenger vehicles Load factor for freight vehicles Fuel quality/specifications Fuel distribution by vehicle type
Fuel consumption by vehicle type % mileage by driving mode Average speed
Efficient driving
Frequency of private transport use Average mileage per vehicle Vehicle distribution by ages Vehicle distribution by engine cylinder capacity and maximum weight Life curves
Factor for mileage reduction for vehicle ageing Average load for freight vehicles New technology distribution for the vehicle sales by year
Maximum day temperatures Minimum day temperatures Average day temperature variation Average day temperature
Passenger • km Tonnes • km Passengers/vehicle TONNES/vehicle
Sulphur content, RVP, lead content % of petrol, diesel, LPG, natural gas, hydrogen, hybrid and electric. 1/100 km
% mileage for urban, rural and highway mode km/h
Reduction in fuel consumption % of mobility by private vehicle km/year
% vehicles by registration year
Tonnes/vehicle
% of technology-i from total sales by year
X (for each month calculated as an average weight by mileage per region)
fleet is estimated using vehicle life curves, reduction of mileage due to vehicle ageing and age distribution of actual fleet. The total number of projected vehicles for future years (old vehicles that remain moving since the reference year and new ones) is derived using foreseen mobility expressed in passenger-km
Life vehicles curves Factor for mileage reduction Dates of technology penetration
Occupancy rates and load factors Mileage distribution by driving modes
Projection of reference year fleet
(year n -» year n+k)
Transformation of future mobility into
mileage
(year n -» year n+k)
£
&Average distance by vehicle type
Vehicle aggregation by sector and subsector
(year n -> year n+k)
Change from mileage to vehicles
(year n -» year n+k)
<^
tf
New vehicles by sector and subsector
(year n -> year n+k)
&
Penetration of new technologies
New vehicles disaggregation by
technology
(year n -> year n+k)
Fig. 2. Process for disaggregating vehicles by technology.
and freight-km after transforming them through occupancy rates, load factors, expected average distance driven by vehicle type, etc. Finally, new vehicles are calculated subtracting the projection of the reference year vehicles to total projected vehicles for each future year. This approach has the limitation of using specific life curves that might not be generalized worldwide [31],
A more detailed description of the EmiTRANS data relationships can be found in Lumbreras et al. [32]. Output data are calculated through different steps from input data using intermediate data, which also hold valuable informa-tion (e.g. mobility calculated for the base year). The main elements included in this part together with their relation-ships are illustrated in the following paragraphs.
The main input consists of the projected mobility expressed in passenger-km and freight-km. To convert these passenger-km and freight-km into vehicle-km, occupancy rates and load factors are used, and they are finally transformed into total vehicles, using annual mileage per vehicle type.
Other relevant input information introduced to the system is: vehicle distribution by ages, fuel, engine cylinder capacity and maximum weight for the reference year as well as mileage vehicles by driving modes, sector, subsector and technology. All these data configure the situation for the reference year "n", and together with life curves and mileage reduction for vehicle ageing are included in the algorithm to estimate future old vehicle contribution to future fleet.
after the reference year. If no future passenger and freight mobility are available, an alternative option to estimate the future fleet distribution can be used introducing an inference of future vehicle variation and its technology distribution regarding base year.
Finally, EmiTRANS generates output data for emission calculations in the appropriate format to run COPERT4 (i.e. the corresponding MS Excel™ templates). At the same time, other outputs are obtained to extract conclusions for policy making.
The tool has been developed under SQL Server, and the execution time may take from some seconds to several minutes, depending on the number of years that are considered.
2.3. Case study
EmiTRANS was applied to calculate atmospheric emission projections for road transport emissions in Spain from the reference year (2005) up to 2020 under five different scenarios. The main considerations for each scenario are summarized in Table 2. The main assumptions are derived from Spanish transport plans and programmes [33]. The pollutants consid-ered are those related to current air quality problems in urban areas (S02, NMVOC, NH3, NOx and PM) along with C02 and N20 as the main GHG emitted by mobile sources. Nonetheless, the designed methodology can be applied to other pollutants such as CO, Persistent Organic Pollutants (POPs) and heavy metals.
Several scenarios were considered assuming different hypotheses related to mobility, penetration of new technologies or biofuel use, as reflected in Table 2. The assumed increase in private mobility is moderate compared to developing countries where expected economy development will produce much higher mobility rise and reduce room for emission reductions [34].
The Baseline scenario (with measures) corresponds to the most likely situation including implemented policies and measures and constitutes a starting point to reduce emis-sions. It presents a moderated increment of mobility of 3.6% for passenger cars and 5.1% for heavy duty vehicles in 2006, that is reduced to a 0.5% and 0.2% increase, respectively, up to 2020, and includes the effect of P&M planned by the Spanish Administration [29]. Besides, it includes the use of more environmental friendly technologies such as hybrid vehicles, electric vehicles and hydrogen or natural gas vehicles.
Biofuels, New Technologies and Mobility scenarios intro-duce specific improvements compared to the Baseline scenario (Table 2). For instance, the Biofuel Promotion Scenario assumes a higher penetration of biofuels (from 6.88% in 2010 to 20% in 2020) that involves a shift from conventional fuels (diesel and petrol) to biofuels (biodiesel and ethanol). It should be noted that emission factors are not part of EmiTRANS, and therefore, those of COPERT were applied.
Technological scenario considers a higher penetration of alternative cars (mainly electric and hybrid) and natural gas urban buses. The lower mobility scenario involves a reduction in passenger and freight mobility to the same values as in the reference year (2005), for the projected period 2006-2020.
Finally, a combined scenario including previous assump-tions on biofuel promotion, higher technological penetration and lower mobility was included to show the results of a "green" scenario. It was called Maximum Feasible Reduction (MFR) to reflect the hypothetical situation of the maximum emission reduction, even though it would be very unlikely.
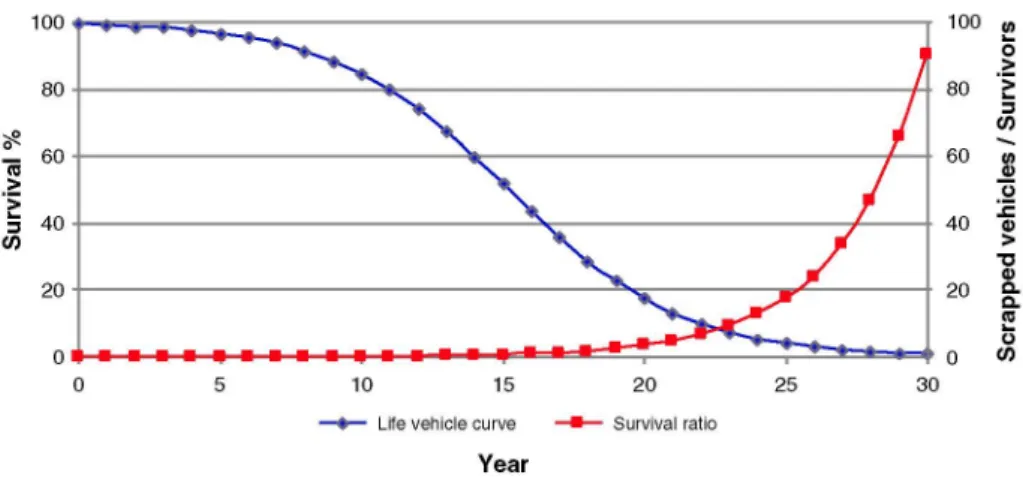
Vehicle life curves (Fig. 3) are common to all scenarios and were calculated from vehicle registration data and scrap cycles obtained from the Spanish traffic agency. As men-tioned in Section 2.2, this constitutes a limitation to use the model outside Spain since vehicle lifetime could vary around
Table 2
Assumptions considered under the scenarios calculated for Spain.
Scenario Mobility Technology in 2020 Vehicle power Biofuels
Baseline
Technological
Lower road mobility Biofuel promotion
Maximum Feasible Reduction
2006-2020 annual variation:
-3.6-0.5% PC mobility (passenger-km)
-5.1-0.2% HDV mobility (t-km)
Same as baseline
No mobility increase Same as baseline
No mobility increase
Penetration in total PC mobility: 0.03% Euro 1
0.28% Euro 2 3.16% Euro 3 24.02% Euro 4 34.27% Euro 5 33.57% Euro 6 1.40%electric/H2
3.27% hybrid
Penetration in total HDV mobility: 16% NG urban buses Penetration in total PC mobility:
10%electric/H2
20% hybrid
Penetration in total HDV mobility: 50% NG urban buses Same as baseline Same as baseline
Penetration in total PC mobility: 10%electric/H2
20% hybrid
Penetration in total HDV mobility: 50% NG urban buses
Petrol:
41%<1400cm3
52% E (1400 cm3-2000 cm3) 7% > 2000 cm3
Diesel:
86% <2000 cm3
14% > 2000 cm3
Same as baseline
Same as baseline Same as baseline
Same as baseline
2010 5.83%
2012: 8% 2016-2020: 10%
Same as baseline
Same as baseline 2010
2012 2020 2010
6.88% 9.5% 20% 6.88%
2012: 9.5% 2020: 20%
100
—•— Life vehicle curve —• — Survival ratio
Year
Fig. 3. Life curves applied to estimate vehicle substitution for passenger cars.
countries [35]. Nonetheless, this drawback can be easily overcome by incorporating national-specific life curves for a particular country.
2.3.1. Analysis of variables influencing road transport emissions for sensitivity analysis
The application of the EmiTRANS model (case study) includes a preliminary sensitivity analysis. This analysis, which was carried out for the most influential variables, is important to provide an idea of the potential of a series of abatement options to the users involved in the decision-making process [36]. It is also useful to identify areas in the model that need further development or refinement to minimize model uncertainties or even to show those model limitations that may not be improved. This study was done accordingly to the traffic emission model COPERT, which is an 'Average-speed' model [17] routinely used for regulatory and reporting purposes in Spain. Models such as COPERT rely on emission factors (g-veh-km-1) that are a function of mean travelling speed [18]. In order to apply the relevant emission factors and to evaluate emissions over a given domain, an annual run requires an input dataset including appropriate information for more than 1510 variables that can be gathered on a number of scopes (Table 1). The effect on emissions of the variables listed in Table 1 was analysed and the most influential parameters were selected. The main variables influencing emissions (according to the COPERT methodology) are as follows:
• mileage (veh-km) or mobility (passengers-km or tonnes-km) per vehicle type (passenger cars, buses, light commercial vehicles, heavy duty vehicles, mopeds, and motorcycles), • fuel used (diesel, petrol, biofuels, natural gas, and LPG), • driving mode (urban, rural, and highway) and associated
vehicle speed,
• technology used (Euro types, hybrid vehicles, Enhanced Environment-friendly Vehicle (EEV) and electric vehicles by power), and
• vehicle characteristics (power, load factor, age, operational life, etc.)
Once the target variables are selected, their evolution in the past was scrutinized considering that the recent evolution provides meaningful information about expectable trends and feasible variation ranges in the future. Fig. 4a shows the
historical evolution of some relevant parameters for Spain during the period 1990-2005 according to MMA [37]. A remarkable increase in the number of passenger cars and mileage was observed in this period (74% and 89% respectively). The phenomenon of fleet dieselization can be clearly seen, with a 184% augmentation of diesel consumption and a decrease on petrol sales of 11%. This phenomenon also implicates changes in air pollutant emissions and air quality [38,39]. Despite vehicle fleet increase, some air pollutant emissions were stabilised or even reduced due to penetration of new technologies (i.e. Euro standard vehicles). To illustrate this phenomenon, the trend of these factors was plotted against the main road transport emissions (Fig. 4b to d) using MMA data [36]. Fig. 4b clearly reflects the importance of exhaust after treatment technologies that have slowed down the tendency of NOx and PM emissions and have decreased global VOC and CO emissions in Spain. These technologies were implemented in cars following Euro standards as shown in Table 3. S02 emissions were drastically reduced due to low sulphur fuel usage. However, C02 emissions show an increasing tendency, although much more moderate than the number of vehicles because engine improvements have not counteracted the increase of average power of vehicles. Fig. 4c and d shows the large effect of deNOx technologies and the slightly lower effect of oxidation catalyser on diesel engines than on spark ignition ones.
3. Results
3.1. Road traffic emission projections in Spain up to 2020
Although EmiTRANS was used to estimate emission projec-tion for all the pollutants included in the EMEP/EEA method-ology, the results shown in this section are limited to C02, NOx and PM2.5 since they are representative of the main impacts of road traffic and provide meaningful information for the devel-opment of environmental policies in the area of climate change, air quality and health.
a
b
1990 1991 1992 1993 1994 1995 1996 1997 1998 1999 2000 2001 2002 2003 2004 2005
990 1991 1992 1993 1994 1995 1996 1997 1998 1999 2000 2001 2002 2003 2004 2005
Fig. 4.
petrol
(a) Factor emission trend for period 1990-2005 in Spain. Passenger car atmospheric emission trend for the same period compared to total mileage (b), mileage (c) and diesel mileage (d).
a 22% C02 reduction in 2020 from the Baseline scenario. This demonstrates that the most effective measure to reduce C02 emissions is mobility cutback through instruments like modal shifts, planning improvements or promotion of home-working. The maximum reduction associated to MFR compared to baseline attains a 26%.
Table 3
Euro standard main features including their penetration years.
Euro standard
Euro 1
Euro 2
Euro 3b
Euro 4
Euro 5
Euro 6
Temporal application
Gasoline: 1993-1996 Diesel: 1993-1996 Gasoline: 1997-1999 Diesel: 1997-1999 Gasoline: 2000-2004 Diesel: 2000-2004 Gasoline: 2005-2010 Diesel: 2005-2010 Gasoline: 2011-2014 Diesel: 2011-2014 Gasoline: Diesel:
2015-Main features (emission limit values for certain pollutants in g/l<m)
HC + NOx
HC + NOx
HC + NOx
HC + NOx
NO, NO, NOx
NOx
NO, NOx
NOx
NO,
0.97 0.97, PM: 0.14 0.5
0.7, PM: 0.08 0.15
0.5, PM: 0.05 0.08
0.25, PM: 0.025 0.060, PM: 0.005c
0.180, PM: 0.005 0.060, PM: 0.005c
0.080, PM: 0.005
a 1990-1996 for gasoline cars with an engine capacity greater than 2000 cm3.
b Since the Euro 3 stage, hydrocarbon and nitrogen oxide emission limit values are given separately.
c Applies only to vehicles with direct injection engines.
The other scenarios yielded lower but still relevant emission reductions: the promotion of biofuels implies a 6% emission decrease from the Baseline. The technology penetration considered under the "Technological scenario" leads to a 9% reduction. Nevertheless, despite the amount of measures taken into account, only the "lower mobility" scenario presents a net C02 decrease in 2020 compared to 2005 (-2%). At the end of the period, emissions under Baseline scenario would exceed those of 2005 in 25% whilst the expected increase under the "Biofuel promotion" and "technological" scenarios would be 18 and 14%, respectively.
Emission projections for NOx and PM2.5 are shown in Figs. 6 and 7, reflecting a descending trend in all cases. The measures included in the Baseline, New Technologies and Mobility scenarios yield relevant emission reductions with respect to 2005. Baseline scenario would achieve reductions of 53% and 78% for NOx and PM25, respectively. The most effective scenarios for reducing NOx and PM25 emissions are, barring the MFR scenario, the "lower mobility" followed by "new technologies" scenario. However, for PM25, those measures included in the presented scenarios are not achieving substan-tial additional reductions, compared to the baseline.
130
2005 2006 2007 2008 2009 2010 2011 2012 2013 2014 2015 2016 2017 2018 2019 2020
year
| A Baseline —*— Technological A Lower Mobility —*— Biofuel Promotion —•— MFR | Fig. 5. C02 emission projections for road transport in Spain relative to 2005 (2005 value corresponds to 100).
(i.e. Selective Catalytic Reduction for NOx and Particulate Matter filter for PM2.5). Furthermore, an extra emission reduction is obtained in the Mobility scenario when less freights and passengers are considered. Although scenarios seem to be close to each other, this is caused by both the graph scales and the P&M nature, which only affect to a percentage of the vehicle fleet.
Concerning the MFR scenario, it reduces NOx and PM2.5 emissions compared to baseline in 68% and 85%, respectively, showing that emission reduction effects are not addable.
Results from the Baseline scenario are similar to those from the TREMOVE model (www.tremove.org). As an example, Kousoulidou et al. [40] projected emission reductions for 2020 under a Baseline scenario (CLE) with NOx emission reductions per km of 10%, 50%, 53% and 89% for diesel passenger cars (PC), trucks, light duty vehicles and gasoline PC, respectively, whilst this paper considers a 55% decrease for total vehicle emissions in Spain. As for PM2.5, the TREMOVE application presents a range of diminution from 47% to 65% whilst Spanish emissions are estimated to decrease a 72% due to a widespread use of
Diesel Particle Filters (DPF) that increase emission reductions for trucks and diesel PC to 72% and 83%, respectively.
3.2. Sensitivity analysis
A sensitivity analysis for the factors presented in Section 2 was carried out to identify their influence in atmospheric emissions from road transport using Spain as a case study. The analysis has been done accordingly to the changes included in Table 4 which are compared to the values considered for the Baseline scenario (reference values). Parameter variation leads to possible scenarios although this paper does not deep on how realistic the variations are (this issue might be addressed in a separate contribution). However, variation ranges were defined taking into account the feasibility of policies and measures (e.g. penetration of new Euro standards, increase of biofuel use, and scrapping systems).
Figs. 8 to 10 show the influence of some of the above-mentioned changes on road transport emissions. For in-stance, C02 emissions experiment a 5% rise when average
2005 2006 2007 2008 2009 2010 2011 2012 2013 2014 2015 2016 2017 2018 2019 2020
year
* Baseline - • - Technological A Lower Mobility » MFR
100
2005 2006 2007 2008 2009 2010 2011 2012 2013 2014 2015 2016 2017 2018 2019 2020
year
A Baseline Technological Lower Mobility
Fig. 7. PM25 emission projections for road transport in Spain relative to 2005 (2005 value corresponds to 100).
speed increased 20% from the reference value. These results are the consequence of the non-linearly increasing rolling and drag resistance with speed. Concerning CO emissions, the enrichment of the mixture at higher speeds causes its large augmentation.
The effect of old passenger car substitution by vehicles with Euro 5 technology is studied, reducing the current number of pre-Euro vehicles between 20% and 80%, that corresponds to a 5% and 21% renew of total passenger car fleet, respectively (in line with the assumptions of Rexeis and Hausberger [8]). It can be seen in the graphs how aftertreatment technologies have a decisive effect on the reduction of all pollutants. The high efficiency of three way catalytic converters reduces CO, NMVOC and NOx emissions up to 95% in spark engines. C02
Table 4
Factor changes for sensitivity analysis.
Factor
Fuel distribution for vehicles
Urban average speed
Highway average speed
% of large vehicles (>2000 cm3)
Number of old passenger cars
Sensitivity analyses
Reference: 46.6% petrol, 53.4% diesel 30% petrol, 70% diesel
40% petrol, 60% diesel 60% petrol, 40% diesel 70% petrol, 30% diesel Reference: 25 km/h 20 km/h 22.5 km/h 27.5 km/h 30 km/h
Reference: 105 km/h 84 km/h
94.5 km/h 115.5 km/h 126 km/h
Reference: vehicles with engine cylinder larger than 2000 cm3 are 6.2% for petrol and 14.2% for diesel
Number of large vehicles are tripled Number of large vehicles are doubled Number of large vehicles are divided by 2 There are no large vehicles
Reference: 5375 M vehicles (26.5%) 20% substitution by Euro 5 vehicles 40% substitution by Euro 5 vehicles 60% substitution by Euro 5 vehicles 80% substitution by Euro 5 vehicles
emissions decline slightly because Euro standards include neither C02 limits nor significant efficiency improvements.
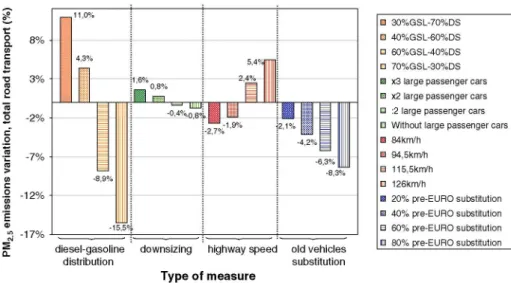
The relevance of passenger car engine size is also presented. In the reference situation used for comparison, 6% of petrol cars and 14% of diesel cars have engines above 2 1. For instance, doubling the contribution of larger cars (reducing the cars below 2 1) raises PM2.5 and C02 emissions ( + 0.8% and +1.9%, respectively) due to the increase of 1.9% in fuel consumption, but reduces CO (in a 2.2%) and NMVOC (1.2%), due to a more efficient combustion. Consequently, downsizing mea-sures produces opposite effects in these pollutants.
As for the influence of diesel and petrol mileage distribution for passenger cars, 47% of total mileage is driven by petrol cars and the remaining 53% by diesel cars in the reference situation. If diesel mileage increases to 70%, PM25 emissions would grow 11% whilst NMVOC and NOx emissions would decrease 25% and 4%, respectively.
4. Discussion and conclusions
The development of a methodology to calculate emission projections from road transport is presented in this contribu-tion. It includes a software tool called EmiTRANS that allows the quantification of the effect of policies and measures on emission reductions, contributing to incorporate scientific criteria on decision making processes. Flexibility and consis-tency were two major criteria in the design and development of EmiTRANS. The system is fully consistent with the emission computation methods of the EMEP/EEA methodology and therefore with the official inventories in many European countries. Moreover, it may be applied to different regions with diverse data availability since it allows runs with less detailed input datasets using default values, although disparity on vehicle life curves, technical specifications, average mileage, occupancy rates, or load factors could reduce its applicability for policy making due to uncertainty increase.
£ 6%
o. 5%
2 4 %
I 3
%I
2%
(I
o - 1 %-2%
-3%
0,0% 0,0% 0,1°/
diesel-gasoline downsizing highway speed old vehicles
distribution substitution
Type of measure
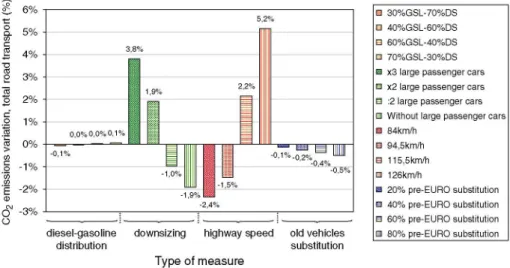
Fig. 8. Comparison of the effect of measures analysed on C02 emissions.
a
•
B
a m
E3
B
ED
m ® B m m m B m
30%GSL-70%DS
40%GSL-60%DS
60%GSL-40%DS
70%GSL-30%DS
x3 large passenger cars
x2 large passenger cars
:2 large passenger cars
Without large passenger cars
84km/h
94,5km/h
115,5km/h
126km/h
20% pre-EURO substitution
40% pre-EURO substitution
60% pre-EURO substitution
80% pre-EURO substitution
According to the sensitivity analyses performed, the most influent variables (Table 5) for CO, NMVOC and NOx emissions are vehicle substitution (through scrapping systems) and the ratio of petrol/diesel vehicles. The substitution of 60% of old passenger vehicle (Pre-Euro) by Euro 5-equiped cars (equivalent to a 16% renew of the total passenger car fleet, to assess the potential of scrapping systems incorporating the newest avail-able vehicles) would allow a 34% reduction on total road transport emissions of CO and NMVOC and 14% of NOx. Reducing mileage from petrol passenger cars from 47% to 30% abates CO emissions by 27%, and NMVOC by 25%. Although having also a positive effect on NOx emissions (reduction of 4%), this measure brings about higher PM2.5 emission (11%) due to diesel consumption increase.
Measures aimed at substituting old vehicles and limiting highway speed produce similar reduction on all pollutants, whilst petrol/diesel percentage and car size measures generate opposite effects. This situation shows the complexity of reducing air quality pollutants and greenhouse gas emissions at the same time, an issue that may be overlooked when applying emission
projection methods exclusively for particular pollutants, such as C02 (e.g. Yang et al. [41 ]). Furthermore, to obtain C02 reductions, non-technical measures such as decreasing average speed in highways or downsizing are more effective for this case than scrapping systems, although in several national mobility plans vehicle's scrapping was found to be very effective for both air quality improvement and C02 reduction. For instance, a 20% speed reduction from the reference situation (year 2005) produces a decline of 2.4% in carbon dioxide emissions from the road transport as a whole. However, scrapping systems aimed at renovating 80% of the pre-Euro passenger cars only reduce C02 emissions by 0.5%. Those results suggest that additional measures regarding passenger and freight mobilities are needed to achieve significant C02 reductions. It has been proven that reducing passengers' mobility between 10% and 20% could decrease C02 emissions in road transport sector below 4% and 8%, respectively. However, the model is not able to discriminate measure feasibility. Therefore, a previous check of the feasibility of each measure should be done by the modelling team.
5%
- 0%
o -5%
-10%
$ - 1 5 %
-20%
:-0,3%0,2%
u
diesel-gasoline downsizing highway speed old vehicles
distribution substitution
Type of measure
m a
a
• B m m B B m B B a m B B
30%GSL-70%DS
40%GSL-60%DS
60%GSL-40%DS
70%GSL-30%DS
x3 large passenger cars
x2 large passenger cars
:2 large passenger cars
Without large passenger cars
84km/h
94,5km/h
115,5km/h
126km/h
20% pre-EURO substitution
40% pre-EURO substitution
60% pre-EURO substitution
80% pre-EURO substitution
t o
3 %
o - 2 %
- 7 %
-12%
a.
-17%
• ^ w
-15,5%
diesel-gasoline downsizing highway speed old vehicles
distribution substitution T y p e o f m e a s u r e
Fig. 10. Comparison of the effect of measures analysed on PM2.5 emissions.
30%GSL-70%DS
40%GSL-60%DS
60%GSL-40%DS
70%GSL-30%DS
x3 large passenger cars
x2 large passenger cars
:2 large passenger cars
Without large passenger cars
84km/h
94,5km/h
115,5knrVh
126km/h
20% pre-EURO substitution
40% pre-EURO substitution
60% pre-EURO substitution
80% pre-EURO substitution
EmiTRANS allows the user to evaluate the expectable effects on emission levels of policies and measures and to develop abatement plans and strategies for future years. The application to Spain for the period 2006-2020 under several scenarios shows that reducing passenger and freight mobilities is the most effective measure to abate C02 and air quality pollutants whilst vehicle scrapping systems are also very effective but only to reduce air quality pollutants. Mobility measures are most influential for C02, although decreasing highway speed and downsizing policies also have a considerable effect. Fleet renewal however, brings about quite limited reductions. Concerning NOx, the implementation of scrapping systems to renew the passenger car fleet increasing Euro 5 vehicles constitutes the better way to reduce emissions according to the emission factors considered in COPERT. Mobility measures, highway speed decrease and petrol/diesel ratio changes are less effective although they also have substantial effects. Finally, for PM2.5 reduction, increasing petrol passenger car percentage yields relevant reductions. Old vehicle substitution, mobility measures and, to a lower extent, decreasing highway speed were found effective to cut down PM2.5 emissions.
These results are coherent to the sensitivity analysis carried out to evaluate the effect of several factors on atmospheric emissions. However, the model is not prepared to detect unfeasible or unrealistic measures, so it could be of interest to develop a feasibility check system based on the analysis historic situations.
Overall, this methodology has been found suitable to support transport planning for a country and could be exported to any other vehicle fleet structure. Nevertheless, to improve its policy applications, future work should focus on inclusion of a cost module and extend emission calculation to life cycle of both fuel and vehicle production.
Acknowledgements
This software development was partially funded by the Spanish Ministry of Environment under the Project All9/ 2007/1-13.3. The authors also acknowledge the use of data from the SNAEI produced by the same Ministry and the programming carried out by Javier Agudo and Ignacio Casillas.
Table 5
Comparison of the influence of different factors on emission reductions.
CO NMVOC NOx
PM2.5
co
2Factor ranking
Old vehicle substitution
1st 1st 1st 2nd 3rd
based on emission
Fuel distribution
2nd 2nd 3rd 1st 3rd
relevance
Highway speed
3rd 4th 2nd 3rd 1st
Size cars