Optimising TransMilenio BRT system operation:
a mathematical model
Francisco J . Peña*
Insight – Centre for Data Analysis, University College Cork,
Western Gateway Building, Washington Street, Cork, Ireland
Email: [email protected]
*Corresponding author
Antonio Jiménez-Mart´ın and Alfonso Mateos
Decision Analysis and Statistics Group,
Escuela Técnica Superior de Ingenieros Informáticos, Universidad Politécnica de Madrid,
Campus de Montegancedo S/N, Boadilla del Monte, 28660, Madrid, Spain
Email: [email protected]
Email: [email protected]
Abstract: In this paper we review the proposals in the literature to optimise bus rapid transit (BRT)
system operation, which are based on bus scheduling and focused on varying the times between each bus departure of the different bus routes. We propose a mathematical model that adapts elements of the above proposals and incorporates novel elements accounting for the features of TransMilenio, which is Bogot´a’s most important mass transportation system and one of the biggest BRT systems in the world.
This paper is a revised and expanded version of a paper entitled ‘First approach to the optimization of Bogotá’s TransMilenio BRT system’ presented at FORS40 – Finnish Operations Research 40th Anniversary Workshop, Lappenranta University of Technology, Finland, 20–21 August.
1 Introduction
Bus rapid transit (BRT) systems are public transport systems with medium/high capacity, high quality service and low infrastructure and operating costs (Wright and Hook, 2007). They are considered to be a good affordable alternative for developing cities seeking to provide their citizens with a high-quality self-sustaining public transport alternative comparable with rail systems, but without the high costs and without taking cities to high levels of debt, leaving the possibility of investing the city funds in priority areas such as health or education.
BRT systems have a lot in common with rail systems, particularly performance and passenger service. The main difference is that operation and implementation costs are 4 to 20 times lower than the costs of a light rail system, and 10 to 100 times lower compared to a heavy rail and metro system (Wright and Hook, 2007).
They can operate as limited stop services (also called stop-skipping services), in which a bus service omits stops along certain routes. This has two advantages, the reduction of travel times due to fewer stops and the reduction of operator costs, because they can meet the demand with fewer vehicles thanks to shorter bus cycles (Leiva et al., 2010).
New plans have been made to expand it due to its success, and similar systems have been constructed in other cities of Colombia.
There are very few proposals in the literature focused on optimising the BRT system operation, mainly because they are relatively recent phenomena, and many of the currently operating BRT systems are far from reaching maximum capacity. To the best of our knowledge, there are no proposals for automatic route design. The closest to this is the model proposed in Leiva et al. (2010) that evaluates and selects the best routes from a given set.
In this paper we review of the proposals in the literature to optimise BRT system operation, with a special emphasis on TransMilenio, and propose a mathematical model that adapts elements of the above proposals and incorporates novel elements accounting for the features of TransMilenio. Specifically, we introduce a new model for evaluating TransMilenio routes, given the trip demand in the form of an origin-destination matrix. Section 2 introduces BRT systems and their main elements. Section 3 focuses on TransMilenio, Bogot´a’s most important public transportation system and one of the biggest BRT systems in the world. In Section 4, we review the different studies in the literature on the optimisation of BRT systems and, specifically, on TransMilenio. In Section 5, we introduce a new mathematical model approach to the optimisation of TransMilenio. Finally, some conclusions and future research are discussed in Section 6.
2 BRT systems
A BRT system was defined in Wright and Hook (2007) as a system based on high quality buses, that provide fast and a comfortable urban mobility and with a favourable cost-benefit through the provision of segregated infrastructure of exclusive use, fast and frequent operations, and marketing and customer/user service excellence.
The first BRT system started operating in Curitiba in 1974, but until the decade of 1990 this type of system was seen as a public transportation solution for small cities or as complementary systems of a metro network. Many experts considered that they were not able to reach a capacity beyond 12,000 passengers per hour per direction (pphpd). This perception radically changed in 2000 with the creation of TransMilenio in the city of Bogot´a (Colombia). Nowadays, TransMilenio transports nearly 500 million people yearly (Observatorio de Movilidad, 2011). It introduced a series of improvements that raised the capacity of BRT systems enormously to 45,000 pphpd, and has inspired many cities around the world to implement this type of systems (Wright and Hook, 2007).
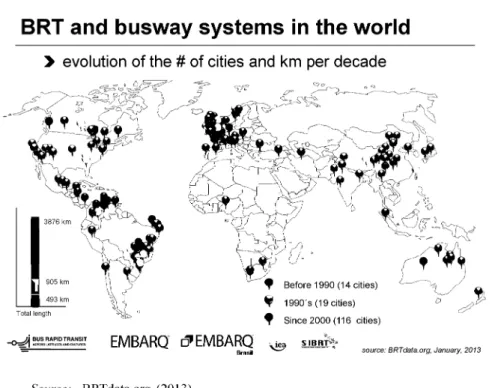
Nowadays, there are 149 cities with BRT systems, and 84 more are planned. The majority of systems were built after the year 2000. This fact can be attributed to TransMilenio’s success, as illustrated in Figure 1, which shows the evolution in the number of cities with BRT systems per decade and the respective number of kilometres. Table 1 shows the price range for mass transportation systems based on a comparison of infrastructure costs real data (Wright and Hook, 2007).
costs per kilometre of the metro systems and elevated train were US$142.9 million and US$72.5 million. The projected costs per kilometre for the proposed light rail and BRT are US$25 million and US$2.34 million. This means that with a budget of US$1,000 million they could build 7 km of underground train, 14 km of elevated train, 40 km of light rail train or 426 km of BRT system (Wright and Hook, 2007).
Figure 1 Evolution of number BRT of cities and km per decade (see online version for colours)
BRT and busway systems in the world
• evolution of the # of cities and km per decade
9 Before 1990 (14 cities)
9 1990's (19 cities)
^ Since 2000 (116 cities)
_Q_M BUS RAPID RAPID TRANSIT
EMBARQ d»EMBARQ source: BRTdata.org, January, 2013
Source: BRTdata.org (2013)
Table 1 Capital costs for different mass transportation systems
Type of system Cost per kilometre (US$ million/km)
BRT
Tram and light rail transit Elevated systems Underground metro
0.5-15 13 -40 40 -100 45 -350
BRT systems can be planned and implemented in short time periods, which can be covered in one government term. The two most successful and complete BRT systems (Curitiba and Bogot´a) were planned and implemented in a three year span.
Formerly it was thought that bus-based services could operate within a range up to 6,000 pphpd. If the demand was higher, a light rail-based system should be considered, with capacity between 6,000 and 12,000 pphpd. A heavy metro system had to be considered for a higher demand, since its capacity ranges from 25,000 to 80,000 pphpd. The arrival of BRT systems with a capacity range from 3,000 to 45,000 pphpd changed the situation. BRT systems turned into a real mass transportation alternative for big cities, and the myth that says that BRT systems cannot compete with metro systems in terms of capacity was broken. As a matter of fact, it is not necessarily true that big cities need overflowing levels of capacity, an example is the London metro system, which has a capacity of 30,000 pphpd, but thanks to its multiple parallel lines it has distributed corridors demand across the entire transportation network.
2.1 Main components of a BRT system
A BRT system has seven main components (Levinson et al., 2003; Hinebaugh, 2009): busways, stations, vehicles, fare collection, intelligent transportation systems, service and operation plans, and branding elements.
The busways or corridors are the main component of the BRT systems and it is where the vehicles circulate; they are like the rails of a metro system. They are also the most expensive and one of the most visible elements of the whole system. Therefore, they have a direct impact on the image and perception the users have of the system (Hinebaugh, 2009). The busways must be exclusive for the system buses. Furthermore, the busways must be located in the centre and not at the side of the road (Wright and Hook, 2007).
The stations are the link between the passengers, the BRT system and other transportation systems. They are the element that has most influence on the system’s image, that is why they must have comfortable facilities so that the passengers feel at ease. The stations must accommodate many more people than a bus stop, so they must have a wide infrastructure (Hinebaugh, 2009) since they are located in high demand busways. Besides, the stations must protect the users from climate conditions. The boarding platforms must be at the same height as the buses floor to ease and speed up passenger’ access. There must be also large capacity header stations at the ends of each busway to integrate busways and feeder routes (Wright and Hook, 2007).
The vehicles are the system’s element in which the passengers spend most of their time. They have a direct impact on speed, capacity, comfort and environment friendliness. They are the element that most non-users see, becoming one of the elements with most influence over the public’s perception of the system (Hinebaugh, 2009).
Currently, there are three types of vehicles: articulated, bi-articulated and simple. Articulated buses have the capacity for 160 passengers and operate within the busways. Bi-articulated buses have the capacity between 240 and 270 passengers and operate within busways. Simple buses have the capacity for 90 passengers and in some cities they operate only in mixed traffic corridors as feeder routes. In other cities with low capacity BRT systems operate in busways.
efficiency. This is especially useful for bus routes that have high levels of demand (Hinebaugh, 2009). The fare may be collected outside the bus at the station entrance. Furthermore, fares should be integrated, that is, users should be able to transfer from one bus route to another, including feeder routes, without having to pay an extra fare (Wright and Hook, 2007).
The intelligent transportation system is a technological component that helps to improve overall system performance. It is a combination of different technologies to retrieve all kind of data about system operation, from the number of passengers that enter the system to the positioning of every vehicle using GPS, vehicle departure times, traffic conditions, the traffic lights, etc. The goal of this component is to collect and transform all the possible information into useful knowledge for operators, and ultimately benefits for the passengers.
The service and operation plans directly affect the user’s perception of the system. A good plan allows to adjust to the levels of demand present along the busways. Frequencies should be high to reduce waiting times, and a good design will also help to reduce the number of passenger transfers. Furthermore, the route maps must be easy to understand for users (Hinebaugh, 2009). The busway and feeder routes must be physically integrated, forming a network. Besides, the entry of other public transport operators must be restricted (Wright and Hook, 2007).
The BRT systems must have a distinctive brand image from other transportation systems. A good marketing strategy can position the brand and improve its image to attract more users. The BRT system should have a positive brand image.
3 TransMilenio BRT system
TransMilenio is Bogot´a’s most important mass transportation system and one of the biggest BRT systems in the world. It is based on the Curitiba BRT system, and due to its success there are new plans to expand it. Similar systems have been constructed in other Colombian cities. Currently, the system has completed its third construction phase out of a total of eight.
A clear definition of TransMilenio is given in Chaparro (2002):
“TransMilenio is defined as an urban mass transportation system that privately operates high capacity articulated buses that circulate through segregated busways, which are integrated into a system of feeder services that cover circular peripheral services with medium capacity buses. The system has stations with platform level boarding and automatic doors synchronised with the buses, where passengers take or get off the buses and the service is limited for those who have bus tickets. A satellite control system permanently supervises the buses, and the one-payment fee allows the passenger to board both busway and feeder services.”
3.1 Infrastructure
TransMilenio’s infrastructure is composed of three fundamental elements that are vital for the operation: busways, stations and buses.
passing lanes at stations so that buses can pass each other, thereby providing for express routes. The busways are located on the city’s main roads and are physically separated from the mixed traffic lanes. The busways are in the central lanes of the roads (Ángel et al., 2010; Chaparro, 2002). Internal rules of circulation and operation control can be imposed to improve system performance because the lanes are used exclusively by buses.
As a complement for the buses that circulate on busways, there are lower capacity buses that circulate on the other roads of the city. These routes are called feeder routes and have predefined stop points (Cain et al., 2006).
TransMilenio has a total of 143 stations. These stations form the area where the users can move and board bus routes (the ‘paid area’). The station platforms are at the same height as the bus doors, and that makes it easy to board the buses (Ángel et al., 2010; Chaparro, 2002). There are three types of stations: portal, intermediate and standard. The portal stations are the main stations of the system and are located at the ends of each busway. They are the starting and final destination points for the buses. Furthermore, they have access to feeder routes, which depart from and arrive at these stations like the busway routes. In this way, the transfer between routes becomes easier. The intermediate stations are similar to the portal stations (passengers can transfer between busway and feeder routes) but are located at intermediate points of the busways and not at the ends (Ángel et al., 2010). The standard stations are smaller than the other two and only allow access for busway routes. They are located along the busways with an average separation of 500 metres. Their size varies and they can serve 1, 2 or 3 buses simultaneously in each direction.
TransMilenio has three types of busway services: normal, express and super-express. The normal services are routes that stop in all stations along the way. They have a higher frequency than the other types of services. The express services stop only at some stations (from 40% and 60%), and have a higher average speed than normal services. The stop plan of these services has been designed according to the levels of demand of the stations along the busway (Cain et al., 2006). The super-express services are very similar to the express services. The only difference is that they stop at fewer stations (about 20%) of the stations along the busway. These services are better for users that have long journeys because they stop at fewer stations (Cain et al., 2006). Currently, TransMilenio has 1,392 busway buses (articulated or bi-articulated) and 574 feeder buses.
3.2 Speed
System buses operate at average speeds of 19 and 32 km/h for normal and express services, respectively (Cain et al., 2006).
TransMilenio increased the average speed of the city’s corridors. For instance, the Caracas corridor had speeds of 12 km/h and Calle 80 of 18 km/h due to the oversupply of private bus operators that there was before TransMilenio and which generated traffic jams.
Nevertheless, the speeds are not the same in all busways for different reasons, such as the number of traffic lights along the busways, the number of lanes and even the type of material the street is made of Gleave (2007).
3.3 Capacity
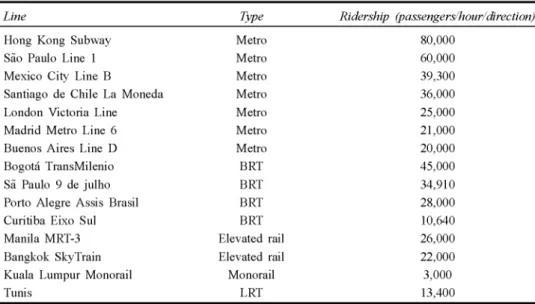
TransMilenio has a maximum load capacity of 45,000 passengers per hour per direction (pphpd), the highest-capacity BRT system in the world and even outperforming many heavy rail or metro systems (Wright and Hook, 2007; Gleave, 2007), see Table 2.
Table 2 Maximum capacity of mass transportation systems around the world
Line Type Ridership (passengers/hour/direction)
Hong Kong Subway S˜ao Paulo Line 1 Mexico City Line B Santiago de Chile La Moneda London Victoria Line Madrid Metro Line 6 Buenos Aires Line D Bogota TransMilenio S˜a Paulo 9 de julho Porto Alegre Assis Brasil Curitiba Eixo Sul Manila MRT-3
Bangkok SkyTrain Kuala Lumpur Monorail Tunis Metro Metro Metro Metro Metro Metro Metro BRT BRT BRT BRT Elevated rail Elevated rail Monorail LRT 80,000 60,000 39,300 36,000 25,000 21,000 20,000 45,000 34,910 28,000 10,640 26,000 22,000 3,000 13,400
Table 3 Vehicles and platform capacities
Maximum vehicle Type of vehicle
capacity (passengers) Articulated 160 Bi-articulated 240 Average dwell time (seconds) 13 14 Average bording and alighting time (seconds) 0.3 0.3 Vehicle Corridor capacity capacity
(pphpd) (vehicles/
hour)
9,779 61 12,169 51
Table 4 Stations capacity according to the number of platforms
Type of station
One boarding platform and no storage space One boarding platform with storage space Two boarding platforms and no storage space Two boarding platforms,
Recommended saturation (%)
one with storage space and the other one with no storage space
Two boarding platforms with storage space
Three boarding platforms where just one of them has storage space Three boarding platforms with storage space in each Four boarding platforms with storage space in each
40
60
40 and 40
40 and 60
60 and 60
40, 60 and 60
60, 60 and 60
60, 60, 60 and 60
Capacity (vehicles/hour)
48
72
96 = 48 + 48
120 = 48 + 72
144 = 72 + 72
192 = 48 + 72 + 72
216 = 72 + 72 + 72
288 = 72 + 72 + 72
Source: Gleave (2007)
Articulated buses carried an average of 1,596 passengers in 2006, which is five times the average number of passengers carried by traditional buses. Furthermore, the number of kilometres a bus travels has increased due to the expansion of the busways, the extension of operating hours and the increase of express services. Each bus travelled 370 km daily in 2006 (Cain et al., 2006).
TransMilenio was the first BRT system to include multiple boarding platforms inside each station. In this way, it reached levels of capacity that only heavy rail systems had (Wright and Hook, 2007). Some TransMilenio stations may have up to five different platforms, each used for a different route.
Besides, it is possible to distribute the different routes along each platform in such a way that each route stops only at one platform. It is then easier for users to find routes, because the user will associate each bus route with a platform.
In theory, one station with five platforms may have five times the capacity of a station with only one platform (Wright and Hook, 2007). To make this possible, the platform saturation level should be between 40% and 60%.
A TransMilenio capacity study was conducted in Gleave (2007) and revealed which capacity values could be achieved according to the number of boarding platforms at each station, see Table 4. Note that it is assumed that each platform has space to keep a vehicle in line (storage space).
In BRT systems, the busway capacity is much higher than the station capacity. Bogot´a’s City Council transit and transport administration manual (Valderrama et al., 2005) states that the saturation flow of the busways is reached when there are between 692 and 750 articulated buses per lane. The interval is between 470 and 730 for right turns and between 465 and 735 for left turns. Note that this capacity does not contemplate elements such as intersections or traffic lights. It is clear that the busways capacity is much greater than the stations capacity.
The basic capacity of each busway is equal to the least capacity station along the busway (Gleave, 2007). It does not account for features that may increase system performance, such as express routes. The values for the different busways are (Calle 26 and Carrera décima busways are not considered since they were opened after the date of the study) (Gleave, 2007):
• Caracas Centro Busway: 192 buses/hour
• Autopista Norte Busway: 144 buses/hour
• Avenida Suba Busway: 144 buses/hour
• Calle 80 Busway: 48 buses/hour
• NQS Busway: 72 buses/hour
• Américas/Calle 13 Busway: 144 buses/hour
• Eje Ambiental Busway: 72 buses/hour
• Caracas Sur Busway: 96 buses/hour
• Caracas Sur ramal Tunal Busway: 72 buses/hour.
4 Existing studies
There are very few proposals in the literature that focus on optimising the BRT system operation. This can be explained because BRT systems are relatively recent (until the year 2000 there were only 19 BRT systems in the world (BRTdata.org, 2013). Another possible reason could be that many of the currently operating BRT systems are far from reaching their maximum capacity. For instance, none of the BRT systems operating in USA has reached maximum capacity and all of them have plenty of space for expanding their operation capacity (Hinebaugh, 2009).
knowledge, there are no proposals that cover automatic route design. The closest to this is the model proposed in Leiva et al. (2010) that evaluates and selects the best routes from a given set of routes.
In the following we review of different proposals in the literature to manage and optimise the operation of different BRT systems and, specifically, for TransMilenio.
4.1 Proposals for optimising of BRT systems
Most of the proposals in the literature for optimising BRT systems are based on bus scheduling and are focused on varying the times between each bus departure (i.e., the headway) of the different bus routes.
In Sun et al. (2008) a model for optimising BRT systems is proposed on the basis of two elements, the headway, which is assumed to be uniform, and the order in which the bus routes depart.
The optimisation model is characterised by a set of predefined bus routes (normal, zone and express routes). A random number is generated and assigned to the headway. Then, the algorithm finds an optimal solution to the order in which the routes have to depart that minimises a cost function. For instance, the algorithm may determine that for a headway of five minutes the best departure order is [normal, express, express, normal, zone]. This solution means that a normal bus route should depart at minute 0, an express route at minute 5, a normal route at minute 10 and an express route at minute 15 and a zone route at minute 20. This solution may be better than for example [express, express, zone, express].
The cost function accounts for the passengers waiting time at the stations, the waiting time inside the buses and the operating costs. It is very complete and includes several variables, such as the number of boarding/alighting passengers by station, the stops of each route, the monetary value of the waiting time costs and the vehicle operating costs, among others.
The model chooses a headway for the given routes and shuffles the order of departure. A genetic algorithm is used to reach an optimal solution. The article presents a novel codification that is a vital element for the model and includes a combination of the headway and route design variables.
In Chen et al. (2012) a very complete model is proposed, with good granularity and with greatly detailed costs. An application to Line 2 of the BRT in Beijing is used to illustrate the model. The total cost of a solution accounts again for passenger waiting time at the station, passenger waiting time inside the bus, and the vehicle operating costs. Passenger walking time from home/office to the station is excluded, because bus scheduling has no influence on that time.
The model considers variables such as the bus departure frequency, the distance between stations, average speed between stations, the rates and boarding times, acceleration and deceleration times, the number of traffic lights between stations, the traffic lights cycle times and others. Furthermore, it assumes that the waiting time is equal to half of the frequency time or headway.
Fixed costs are removed from the analysis because they are unaffected by bus scheduling. The variable costs are composed of operating cost per kilometre, operating hours, vehicle depreciation, etc.
minimise the total costs and is subject to capacity constraints, vehicle availability and headway limitations. To accomplish this an all-stop route and an express route are combined and their headways are calibrated to minimise the total costs. The algorithm complexity increases exponentially along with the number of stations, and this is the main reason why the authors use a genetic algorithm (it would be too costly to use a deterministic algorithm). Another reason its that genetic algorithms are able to naturally represent binary variables.
Leiva et al. (2010) and Larrain et al. (2010) introduce an optimisation model for the minimisation of waiting time, travelling time and operating costs for an express bus service, given the travel demand. A mathematical model is built to minimise costs given a set of stations, the distance between stations, the passenger origin-destination matrix and a set of a priori attractive set of routes. For each suggested route the model outputs the frequency of the services and the size of the buses to use.
For the construction of this model the travel demand is assumed to be fixed and known, represented by a origin-destination matrix for the analysed stations, which must be satisfied. It is also assumed that passengers arrive at an average fixed rate, passengers choose the route to their destination that minimises travel time and there is no limit on the available vehicle fleet.
The operating costs are computed on the basis of the cycle cost of a full bus route, the frequency of each route and the operating set of routes. The passengers costs are given by the waiting time at stations, travel time and transfer time.
Dong et al. (2011) apply a line scheduling plan that only requires information about the congestion level inside the station to the Zhongshan Avenue BRT system in Guangzhou (China). This congestion level can be calculated using the video cameras that are located inside the stations. Once the congestion level inside the stations has been determined, departure frequencies directly related to the congestion levels are set for each line. The higher these congestion levels are, the higher the buses’ departure frequencies are. In summary, Dong et al. (2011) propose a real-time scheduling scheme based on passenger’ congestion levels inside the stations which can be determined from video cameras.
There are also various proposals to improve the operation of BRT systems through the prioritisation of transit signals. Ma and Yang (2007) describes the mathematical relationship between the departure frequency of a route, the cycle length of the transit signals and the number of different signal states when the buses arrive at an intersection. It proposes various strategies for prioritising signals that decrease the headway time deviation, i.e., decrease the punctuality deviation of the buses, without having a significant impact in the delay of the mixed traffic.
Since the construction of TransMilenio in the year 2000, various proposals have been made to optimise its operation. Most of these proposal focus on the reduction of systems costs, to strike a balance between passengers waiting time and operating costs.
For instance, Petri networks are used to model TransMilenio in López et al. (2011). The proposed model is classified as a macroscopic deterministic simulation model, due to its detail level, process and operation representation. The model uses a multi-agent approximation to model three important system components: the passenger behaviour (how many passengers take the bus per hour), the busway dynamics, and the interaction between the passengers and the buses. Since Petri networks are unable to deal with time, trigger times are added to the nodes to represent temporal relationships.
Two Petri networks are designed. One models the whole system and randomly assigns buses to routes, and the other separates the routes from the buses. Random models have the advantage of being able to simulate the interaction between routes. The random model outperforms non-random models to satisfy the demand with the minimum number of resources. Finally, the random model works as an integrated system and it is capable of solving perturbation by itself. The result of this simulation shows that there is a point at which adding more buses to the system does not improve the performance.
In Duarte et al. (2008), a genetic algorithm is used to find the best frequency for pre-established bus routes that minimises passenger waiting time. The frequency is determined by the assignment of buses to each route. The model tries to minimise the time the passengers spend on the system, which is composed of the travel time plus the waiting time at the stations.
The genetic algorithm chromosome size is equal to the number of routes and the population is initialised randomly with the constraint that each route has at least one bus assigned. A random matrix is also created along with the initial population, this matrix contains all origin-destination trips. This algorithm assumes the user is ‘smart’ and will always choose the best route to go to his/her destination.
The arrival of buses at the station and the passengers waiting time are modelled by a Poisson process and a distributed Erlang event, respectively. It accounts for the scenario where buses are full and passengers cannot board. In these cases the passengers have to wait to the next bus.
A graph with the routes was designed to measure the time, where each node represents a station and the arcs represent the connections between them. The arc costs are the travel time between the stations that the arcs connect. Additionally, arcs with the possible express routes are included. Dijkstra’s algorithm is then used to compute the shortest routes, and it is executed before running the algorithm.
In Valbuena and Hidalgo (2005), a model to evaluate TransMilenio routes is built based on the data provided by a origin-destination matrix. The trip probabilities between stations and passenger arrival rate to each station are computed from this matrix, assuming that the users know which is the best route to reach their destination. The model is implemented in a commercial simulation software package.
associated with each pair. TransMilenio data is also required, such as existing routes, their frequency, vehicle capacity, speed, the distance between stations and other network characteristics.
The model is composed of three modules. The network module stores information about the physical infrastructure, such as stations, the distance between them, busways, and others; the stations module is in charge of the boarding and alightment at each station and the arrivals module assigns passenger origin and destination.
The time that the passenger spends inside the station is given by the travel time, the bus stopping time and passenger waiting time at the station. The bus arrival times are assumed to be uniform. Therefore, the waiting time of each passenger is equal to half of the route’s headway.
4.3 Analysis of proposed models
Most of proposed models are far from being able to represent what goes on in the real world because they are not detailed enough to represent what happens within a BRT system. We are going to describe the advantages and drawbacks of each model.
The model presented in Duarte et al. (2008) does not account for vehicle operating costs. This fact is clearly reflected in the results, where the best solution is to increase bus departure frequencies and use the entire bus fleet. The models do not adequately represent constraints concerning capacities within the system, which is modelled for the whole corridor but not for each station individually. This overlooks the fact that there are some stations that have more demand than others. The model does not account for deceleration and acceleration times, passengers boarding and alighting times or dwell times at signalised intersections. An advantage of this proposal is that it builds a graph that pre-calculates the travel times between each pair of stations for each route. This is helpful to find the optimal route between two stations.
The model presented in López et al. (2011) has several voids, such as the fact that it does not account for passenger waiting time or vehicle operating costs. Neither does it account for passenger congestion within the stations, vehicle congestion at stations, discriminated speeds between each pair of stations, or assign distribution times to passenger and vehicle arrivals at stations. On the other hand, it has several advantages, such as considering that when buses are full passengers must wait for the next bus. The model is a user-friendly graphic tool that can model a system in which equations are not known.
The model presented in Valbuena and Hidalgo (2005) refers to some important constraints but the model does not include any. Other constraints included as assumptions are not necessarily realistic. For instance, it is assumed that if a passenger is going to make a trip that is five or less stations of long, he/she will only take normal (all-stops) services. It does not consider decelerating and accelerating times, passenger boarding and alighting times or dwell times at signaled intersections either.
vehicle operating costs. It also introduces an innovative variable-sise codification and the use of binary variables to indicate whether or not a bus stops at a station.
The model presented in Chen et al. (2012) is one of the most complete. In fact, it incorporates most cost variables. It is the only model that includes passenger boarding and alighting times and the stop times at the signaled intersections. Nevertheless, it has some drawbacks. For example, it only considers one express route, i.e., scenarios with several express routes cannot be evaluated. The model is aimed at reaching the best departure frequency for a normal and an express route that operate along the same busway. Its parameters are the origin-destination matrix, the stations in which the express routes stops and the bus fleet size. Note, finally that the model does not consider vehicle congestion or passenger congestion at stations.
The model presented in Leiva et al. (2010) is also very complete and perhaps the best at representing the costs of a real BRT system. This is accomplished thanks to the inclusion of several express routes on one busway and because it is good at differentiating travel time and operating costs. But it is not free of drawbacks. For instance, it does not include acceleration and deceleration times, boarding and alighting times or stop times at signaled intersections. The proposed model searches the departure frequencies that optimise BRT operation according to a defined cost function.
In summary, none of the reviewed proposals considers vehicle congestion at stations or passenger congestion at stations. This is worrying, because, as stated in Cain et al. (2006), Gleave (2007) and Wright and Hook (2007), the capacity bottleneck of a BRT system is the vehicle capacity at the stations. There are not many proposals that account for this point because hardly any BRT systems have reached maximum capacity, which could be the reason why the proposals have focused mainly on the minimisation of passenger waiting times an operating costs, and not on the increase of system capacity. We found that none of the proposals offer automated route design. Chen et al. (2012) and Leiva et al. (2010), which offer validation models for routes that can be given to the model as a parameter, come the closest. We also found that none of the proposals take a multi-objective approach to the problem.
A major point to be considered when modelling BRT systems correctly is passenger’ behaviour. Is important to successfully model which lines passengers will choose given an origin-destination pair. Passengers are likely to choose the line gets them to their destination in the shortest possible time, but this may not always be the case because passengers may be unfamiliar with the system, want to avoid transfers or decide not take the fastest line because its frequency is low and they prefer not to wait. This is one of the less explored topics in the BRT systems literature.
5 Proposed optimisation model for TransMilenio
In this section, we provide a mathematical model for the optimisation of TransMilenio that adapts elements of the above proposals, mainly Chen et al. (2012) and Leiva et al. (2010), and incorporates novel elements accounting for the features of that system.
The set of stations determines the size of the BRT system. The number of stations is directly related to the complexity of the problem to be solved. Information about the system stations, the busways to which they belong, and each station’s neighbouring stations must be considered. The set of TransMilenio stations is denoted by E = {e1,..., e143}, where eH refers to the ith station, i = 1,..., 143.
The routes are paths between two stations (usually main stations) that buses must take and are composed of the set of station at which buses must stop. The set of TransMilenio routes is denoted by R = {r1 ... ,r90}, where rj is the jt h route, j = 1,...,90.
Operating hours is the time during which the BRT system is operating, denoted by T.
The decision variables for the proposed model are the the frequencies associated with each route, denoted by F = {f1 ..., f9 0} , where frk is the frequency for the buses
of the kth route. The headways can be computed from the frequencies and vice-versa.
The costs function is usually divided into passenger waiting time costs and the BRT system operating costs. The model that we propose accounts for three types of costs (Chen et al., 2012; Leiva et al., 2010; Sun et al., 2008): passenger waiting time at station costs, Cs; passenger travelling time costs, CB; and vehicles operating costs, C0. These
first two costs can be grouped as the passenger total trip costs (Chen et al., 2012). Fixed costs, such as station cleaning, electricity, administrative wages, rents, and others, are not considered because they are independent of the BRT system operation (Chen et al., 2012). The unit cost per kilometre, the unit cost for waiting time at the station and the unit cost for waiting time inside the buses, are denoted by /x0, Ms and
Ms, respectively. These values are used in the cost function to evaluate the quality of the sets of routes. Then, the function to be optimised (minimised) is:
min C = CS + CB + C0.
The waiting time at station costs can be computed as follows:
C-S = MS X / Qeiej —^
ei,ej£E rkER frk X X k ~ Se'lej
where xre>°e. is a binary variable that indicates whether a route rk is a good option for
travelling* from the station a to the station &j (its value is 1 if the route is attractive
and 0 otherwise), and e is the bus arrival distribution at the stations, which are assumed Poisson distributions.
Note that an origin-destination matrix is available, which contains information about passenger demand, i.e., the amount of users travelling from station a to station ej. We
use an origin-destination matrix with rush hour data, because this is the time window when the system is closer to maximum capacity. We denoted by qeiBj the number of
passengers that travel from station a to station eh used in the waiting time at station
costs expression.
The travel time costs can be computed by:
E *2W X frk X Xre%.
rkER
CB= MB X qeie X
C P Z2 frk X Xe'tej
ei'e3'fc& rk£R
where /J,B is the travel time unit cost, and tr£e. is the travel time in route rk for the
(eu ej) origin-destination pair, with
= tr + tr
where t^. and tfj. are the travel time and delay time from station a to station ej,
T, — deiei T, —
E <
eiePr
TL
frk
+
E
P%
eiePr
T>-frk
+ N^ x d,
and deiej is the distance between station a to station eh NeiBj is the number of stations
betweenstation a and station eh and Prfc is the set of stations at which route rk stops.
Speeds between each pair of stations, denoted by se^, are very important because
not all busways have the same characteristics and therefore the speed is not always the same. Some busways have signaled intersections, whereas others are built over highways where they can travel at faster speeds.
In the above expression, the boarding and alighting times along with acceleration and deceleration times are used to determine the total stop time of a bus at a station. The stop time increases with the amount of people that board or alight the bus. Based on the model proposed in Chen et al. (2012), we can calculate passenger boarding time at a station as de\ x ra, where de\ is the passenger boarding rate for route rj at station
e; and ra is the passenger boarding time. In the same way, the alighting time is denoted
by fill x T/3, where /? is used for alightings.
Acceleration and deceleration times are constant and independent of the passenger demand level in the system. Based on the model proposed in Chen et al. (2012), we assume that the times are the same for all stations, denoted by d.
The operating costs can be calculated by:
Co no x y
rkeR
T x frk x Drk
where ^o is the unit cost per kilometre for a BRT vehicle, R is the set of all routes in the system and DTk is the length of the path covered by route rk. DTk can be computed
from the distances (deiBj) between the consecutive stations included in the kth route.
The constraints considered in the proposed model are the bus fleet size, the bus passenger capacity, the choice of best route and the station vehicle capacity. The bus fleet size constraint prevents the set of routes from operating with more buses than
are available in the system. This assures that the system is working with the available resources:
T
< y , Vri e R,
where Nr* is the number of vehicles that can operate along the route rj.
buses may be full when they arrive at stations and passengers will have to wait for the next bus. The bus capacity is denoted by kbr., j = 1,..., 90 which is the passenger
capacity of the vehicles that operate the rth route.
v ^ A frh X XP\
kbr xfrh> V V qe.e. x *, ^ — , VrkGR, VoePrt,
k *-^ *-^ % 3 > fr X Xeme
-( • ! CI J- ri C7 Vl J- ri , - 7-)
k J k TmEH
where Prk is the set of stations at which route rk stops, qeiej is the passenger trip
demand for the {eu ej) origin-destination pair, and a%e, indicate whether a route rj is
a good option for travelling from the station e* to the station ej.
The choice of best route constraint helps to model passenger behaviour when choosing a route to travel to their destination. It models the possibility of passengers often being able to take more than one route to reach their destination in the same time.
MS + MB X J2 teTe • X frm X xeTe •
Xe - e , = l O MB X trek < ^ ^ j - ,
* 3 * ° )> fr X Xe
e-rm^rk
Vrfc €R,yei,ej €E.
The station vehicle capacity constraint is very important, even more so in cases where the BRT system is near its full capacity, like the TransMilenio. When the system is nearly at maximum capacity the problem is to find feasible solutions that can meet the trip demands. The station vehicle capacity e; is denoted by kse, i = 1,..., 143.
K
%>
Yl
VZ
x^ '
Vei
eE>
r.-G-Rwhere kesi is the vehicle capacity of station ei, and verij are binary variables that point
out whether station ei is visited on the route rj.
Note that the vehicle station capacity is the bottleneck of the BRT systems (Cain et al., 2006; Wright and Hook, 2007), like TransMilenio.
6 Conclusions and future research
There are very few proposals in the literature that focus on optimising BRT system operation, mainly because BRT systems are relatively a recent form of transport and many of the currently operating BRT systems are nowhere near full capacity. Most of them, and specifically for TransMilenio, are based on bus scheduling and focus on varying the times between each bus departure (i.e., the frequencies) of the different bus routes to minimise costs, whereas the set of routes remain constant during the execution of the model.
In this paper we have provided a mathematical model for the optimisation of TransMilenio that adapts elements of the proposals in the literature and incorporates novel elements accounting for the features of that system.
routes by modifying at most 30% of the stations on the original route. This 30% was fixed by TransMilenio experts at meetings.
The reasons for just modifying rather than redesigning routes is that the social impact of modifying the routes is not too high, whereas, the search space is greatly reduced and, therefore, better solutions can be found in less time. An important drawback is that it may not be possible to find a global optimum, because the best routes may have less than 70% of the stations in common with the original routes. In this case it is more important to reduce the social impact on passengers that comes with the modification of the routes.
We are now working with TransMilenio experts on extending and solving the proposed optimisation problem. We have selected evolutionary algorithms to solve the problem since they have previously proven to be efficient tools. Additionally, the research team is experience in solving other complex optimisation problems using this metaheuristic.
Another future research line that we propose is the possibility of adding transfer times to the model, i.e. the time it takes to a passenger to switch from one route to another, usually because the first bus that a passenger takes does not stop at the station for which he or she is heading. These times are normally penalised because transfers are an inconvenience for passengers.
Finally, another open research line, and a key aspect for correctly modelling BRT systems is user’s behaviour. It is important to correctly model which routes users given an origin/destination pair will choose. They are likely to choose the fastest route, but this is not always the case, because users may not know which the fastest route is or because the frequency of the fastest route is low and they opt for an alternative route. This is one of the least explored issues in the BRT systems literature.
Acknowledgements
The paper was supported by Madrid Regional Government project S-2009/ESP-1685 and the Spanish Ministry of Science and Innovation project MYTM2011-28983-C03-03. The authors would also like to acknowledge the Ministry of Information and Communication Technologies of Colombia and its Talento Digital scholarship programme for funding the studies of Francisco J. Peña, and Alirio Garc´ia for the useful information he provided about TransMilenio.
References
Ángel, S.L., García, C., Santiago, O., Concha, J. and Caldas, M.R. (2010) Plan Marco 2010
Sistema TransMilenio, Technical report, Dirección de Planeación de Transporte.
BRTdata.org (2013) ‘Panoroma of BRT and bus corridors in the world’ [online]
http://BRTdata.org/ (accessed 11 January 2013).
Cain, A., Darido, G., Baltes, M.R., Rodriguez, P. and Barrios, J.C. (2006) Applicability
of Bogotá’s TransMilenio BRT System to the United States, Technical report, National
Cao, S., Zhang, L. and Zhao, F. (2009) ‘An RFID signal capturing and controlling system for BRT priority system’, in Proceedings of the 2009 First IEEE International Conference on
Information Science and Engineering, pp.4725–4729, IEEE Computer Society, Washington,
DC, USA.
Chaparro, I. (2002) Evaluación del impacto socioeconómico del transporte urbano en la ciudad
de Bogotá: el caso del sistema de transporte masivo, TransMilenio, Serie Recursos Naturales
e Infraestructura, United Nations Publications.
Chen, X., Hellinga, B., Chang, C. and Fu, L. (2012) ‘Optimization of headways for bus rapid transit system with stop-skipping control’, in Transportation Research Board 91st Annual
Meeting, No. 12.
Dong, X., Xiong, G., Fan, D., Zhu, F. and Lv, Y. (2011) ‘Research on bus rapid transit (BRT) and its real-time scheduling’, in IEEE International Conference on Service Operations, Logistics,
and Informatics, pp.342–346.
Duarte, S., Becerra, D. and Niño, L. (2008) ‘Un modelo de asignación de recursos a rutas en el sistema de transporte masivo TransMilenio’, Avances en Sistemas e Informática, Vol. 5, No. 1, pp.163–172.
Gleave, S.D. (2007) Estudio de determinación de la capacidad del sistema TransMilenio, Technical report, TransMilenio SA, Bogotá.
Hinebaugh, D. (2009) Characteristics of Bus Rapid Transit for Decision-making, Technical report, Federal Transit Administration, USA.
Kittelson and Associates and the United States Federal Transit Administration and Transit Cooperative Research Program and Transit Development Corporation (2003) Transit
Capacity and Quality of Service Manual, Vol. 100, Transportation Research Board, USA.
Larrain, H., Giesen, R. and Muñoz, J.C. (2010) ‘Choosing the right express services for bus corridor with capacity restrictions’, Transportation Research Record, Vol. 2197, pp.63–70. Leiva, C., Muñoz, J.C., Giesen, R. and Larrain, H. (2010) ‘Design of limited-stop services
for an urban bus corridor with capacity constraints’, Transportation Research Part B:
Methodological, Vol. 44, No. 10, pp.1186–1201.
Levinson, H., Zimmerman, S., Clinger, J., Rutherford, S., Smith, R.L., Cracknell, J. and Soberman, R. (2003) Bus Rapid Transit, Volume 1: Case Studies in Bus Rapid Transit, Technical report, Transportation Research Board, USA.
López, D., Triana, A. and Chamorro, H. (2011) ‘Simulation model of public transportation system using multiagent approach by means of petri nets: Bogotá study case’, in Robotics
Symposium, 2011 IEEE IX Latin American and IEEE Colombian Conference on Automatic Control and Industry Applications, pp.1–6.
Ma, W. and Yang, X. (2007) ‘A passive transit signal priority approach for bus rapid transit system’, in Intelligent Transportation Systems Conference, pp.413–418, IEEE.
Observatorio de Movilidad (2011) Comportamiento de los indicadores de movilidad de la ciudad
a diciembre de 2010, Technical Report 6, Cámara de Comercio de Bogotá y Universidad
de Los Andes, Colombia.
Sun, C., Zhou, W. and Wang, Y. (2008) ‘Scheduling combination and headway optimization of bus rapid transit’, Journal of Transportation Systems Engineering and Information
Technology, Vol. 8, No. 5, pp.61–67.
Valbuena, M.A. and Hidalgo, D. (2005) Propuesta metodológica para la evaluación de rutas del
sistema TransMilenio, Technical report, Universidad de Los Andes, Bogotá.
Valderrama, A.F.G., Pérez, S.H., Benítez, M.C., Grisales, J.C., Hinojosa, M.A., Duenas, D.E., Gomez, J.C.T., Guzmán, L.A., Acosta, N.C., Ropero, M.V. and Edna, P.J.G.H. and Aleman, R. (2005) Manual de Planeación y Diseño para la Administración del Tránsito y
Wang, K. and Zhu, F. (2012) ‘A real-time BRT signal priority approach through two-stage green extension’, in 9th IEEE International Conference on Networking, Sensing and Control, pp.7–11.
Wright, L. and Hook, W. (2007) Bus Rapid Transit Planning Guide, Institute for Transportation & Development Policy, New York.
Xu, H., Sun, J. and Zheng, M. (2010) ‘Comparative analysis of unconditional and conditional priority for use at isolated signalized intersections’, Journal of Transportation Engineering, Vol. 136, No. 12, pp.1092–1103.
Yong, L., Yun, Y. and Hongli, G. (2008) ‘The design of the BRT signal priority control at the intersection’, in International Conference on Intelligent Computation Technology and