Hydration of C
3S, C
2S and their Blends.
Micro- and Nanoscale Characterization
1,2Puertas F1*, 1,2Goñi S, 1Hernández M.S
,
1,2Guerrero A, 1C. Varga1 Instituto de Ciencias de la Construcción Eduardo Torroja (IETcc-CSIC), 28033 Madrid, Spain 2 Nanostructured and Eco-efficient Materials for Construction Unit,
LABEIN-Tecnalia Associated Unit /IETc-CSIC, Spain.
3Palacios M
3Institute for Building Materials. ETH Zurich, 8093 Zurich, Switzerland
2,4Dolado J.S.
4 Centre for Nanomaterials Application in Construction (NANOC), LABEIN-Tecnalia. Parque Tecnológico de Bizkaia, C/ Geldo, 48160 Derio, Bilbao, Spain.
5Zhu W, 5Howind T.
5University of the West of Scotland. Paisley, PA1 2BE, UK
Abstract
This study forms part of wider research conducted under a EU 7th Framework Programme (COmputationally Driven
design of Innovative CEment-based materials or CODICE). The ultimate aim is the multi-scale modelling of the variations in mechanical performance in degraded and non-degraded cementitious matrices. The model is being experimentally validated by hydrating the main tri-calcium silicate (T1-C3S) and bi-calcium silicate (β-C2S), phases
present in Portland cement and their blends.
The present paper discusses micro- and nanoscale studies of the cementitious skeletons forming during the hydration of C3S, C2S and 70 % / 30 % blends of both C3S/C2S and C2S/C3S with a water/cement ratio of 0.4. The hydrated pastes
were characterized at different curing ages with 29Si NMR, SEM/TEM/EDS, BET, and nanoindentation.
The findings served as a basis for the micro- and nanoscale characterization of the hydration products formed, especially C-S-H gels. Differences were identified in composition, structure and mechanical behaviour (nanoindentation), depending on whether the gels formed in C3S or C2S pastes. The C3S gels had more compact
morphologies, smaller BET-N2 specific surface area and lesser porosity than the gels from C2S-rich pastes. The results
of nanoindentation tests appear to indicate that the various C-S-H phases formed in hydrated C3S and C2S have the
same mechanical properties as those formed in Portland cement paste. Compared to the C3S sample, the hydrated C2S
specimen was dominated by the loose-packed (LP) and the low-density (LD) C-S-H phases, and had a much lower content of the high density (HD) C-S-H phase.
Originality
Different micro- and nanoscale characterization techniques were used to study calcium silicate hydration. This thorough characterization provided evidence for verifying the relationship between type of silica hydrate and the nature and strength of the C-S-H gels formed.
Chief contributions
The composition, morphology, structure, porosity and strength of gels forming from different calcium silicates were determined with micro- and nanoscale characterization studies. The C3S gels were shown to have more compact
morphologies and smaller BET specific surface areas, and to be less porous and denser than the gels from C2S-rich
pastes.
Introduction
The hydration of Portland cement is a very complex phenomenon, due to the different composition, the presence of impurities, the variations in crystal structure, and, therefore, the reactivity of its components and the synergies established among them. The knowledge of the behaviour of every phase separately will be a reference to establish the degree of synergy in case of the cement. The hydration processes of the main calcium silicates of Portland cements: C3S and β-C2S, have been
studied extensively over the years, and more recently they are taking up again due to the need to validate experimentally the models which, increasingly, are carrying out on the Portland cement pastes and especially the advances in the characterization of the C-S-H gel [Allen et al. 2007, Constantinides et al. 2004, 2007, Costoya 2008, Dolado et al. 2007, Jennings 2008, Vandamme 2010].
The present research is involved in a European project (namely CODICE project, 2008), which main objective is the multi-scale modelling of the evolution of the mechanical performance of non-degraded and degraded cementitious matrices. For that, a series of experiments were planned with pure synthetic tri-calcium silicate (C3S) and bi-calcium silicate (C2S) (main components of the Portland cement) and
their mixtures, in order to obtain different C-S-H gel structures during their hydration. The characterization of those C-S-H gels and matrices will provide experimental parameters for the validation of the multi-scale modelling scheme proposed.
Previous studies on the hydration of pure synthetic tri-calcium silicate (T1-C3S) and di-calcium silicate
(β-C2S) and their mixtures showed that the hydraulic activity of the β-C2S strongly increased by the
presence of T1-C3S, mainly at early ages, avoiding its inactive induction period [Goñi et al. 2010,
Hernandez et al. 2010].
Studies of mechanical properties of various micro/nano-scale features/phases in cement paste have been reported using nanoindentation [Jennings 2008, Mondal et al 2008, Ulm et al, 2007, Zhu et al, 2007, 2009]. Particularly, a so called statistical or grid-mapping nanoindentation technique, which involves testing and statistically analysing hundreds of grid points on cement paste, has shown to give access to the study of the mechanical properties of individual hydrate phases (e.g. LP, LD, HD-C-S-H and CH) in cement pastes [Jennings 2008, Zhu et al 2007, 2009]. Such a statistical nanoindentation technique was used in this study to investigate the different hydrate phases in C3S, C2S and their
mixtures.
The present paper discusses micro- and nanoscale studies of the cementitious skeletons forming during the hydration of C3S, C2S and 70 % / 30 % blends of both C3S/C2S and C2S/C3S.
Experimental
Materials
Triclinic (T1) tri-calcium silicate, (T1-Ca3SiO5, C3S), and bi-calcium silicate (β-Ca2SiO4, C2S) were
used as starting products, details of the synthesis and characterization can be consulted in [Goñi et al. 2010]. Two mixtures samples were prepared: A (70% C3S/30% C2S) and B (30% C3S/70% C2S). The
particle size distributions of calcium silicates and their mixtures are presented in Table 1.
Table. 1. Particle size distribution for anhydrous C3S, β-C2S and A and B samples
Paste preparation
Pastes were prepared by mixing the powders (C3S, β-C2S, A and B) with distilled and decarbonated
water using water to solid ratio of 0.4. Pastes were cast in 1x1x6-cm3 moulds and consolidated by tapping. All these operations were conducted in an inert N2 atmosphere inside an “Atmosbag". The
specimens were removed from the moulds 24 hours after casting, wrapped in aluminium foil and
<10% <50% <90%
C3S 2.31-3.27 μm 8.71-9.77 μm 22.71-31.19 μm
C2S 1.52-1.41 μm 6.84-7.55 μm 23.09-33.99 μm
A 1,85 μm 9.12 μm 32.26 μm
-6 5 -7 0 -7 5 -8 0 -8 5 - 9 0 -9 5 p p m
-6 5 - 7 0 -7 5 -8 0 -8 5 -9 0 -9 5 p p m
-6 5 -7 0 -7 5 -8 0 -8 5 - 9 0 -9 5 p p m
-6 5 - 7 0 -7 5 -8 0 -8 5 -9 0 -9 5 p p m
C3S
anh
C3S 28d
-6 5 -7 0 -7 5 -8 0 -8 5 -9 0 -9 5 p p m
-6 5 -7 0 -7 5 -8 0 -8 5 -9 0 -9 5 p p m
-6 5 -7 0 -7 5 -8 0 -8 5 -9 0 -9 5 p p m
-6 5 -7 0 -7 5 -8 0 -8 5 -9 0 -9 5 p p m
C2S
anh
C2S 28 d
-6 5 - 7 0 -7 5 -8 0 -8 5 -9 0 -9 5
p p m
-6 5 - 7 0 -7 5 -8 0 -8 5 -9 0 -9 5 p p m
-6 5 - 7 0 -7 5 -8 0 -8 5 -9 0 -9 5
p p m
-6 5 - 7 0 -7 5 -8 0 -8 5 -9 0 -9 5 p p m
A anh A 28d
- 6 5 -7 0 -7 5 -8 0 -8 5 -9 0 -9 5
p p m
- 6 5 - 7 0 -7 5 -8 0 - 8 5 - 9 0 - 9 5
p p m
- 6 5 -7 0 -7 5 -8 0 -8 5 -9 0 -9 5
p p m
- 6 5 - 7 0 -7 5 -8 0 - 8 5 - 9 0 - 9 5
p p m
B anh B 28d
stored in containers with distilled and decarbonated water at ~100 % relative humidity. At the end of each hydration period: 1, 3, 7 and 28 days for C3S and A sample and 3, 7, 28 and 90 days for β-C2S
and B sample, the specimens were crushed and the powder dried with acetone (45 seconds) and ethanol (15 seconds) and put into the “Atmosbag” until the following tests. Immediately prior to characterization analysis, the samples were vacuum dried in desiccators for 1 hour at ambient temperature.
Instrumentation
29Si MAS NMR was likewise used to monitor the anhydrous and hydrated samples and the mean
length chain (LMC) of the C-S-H gels formed. A Bruker MSL400 spectrophotometer operating at 79.49 MHz was used and tetramethyl silane (TMS) as external standard for the 29Si spectra. Spectral
analyses were performed using Winfit software (Bruker). Component intensity, position and line width were determined with a standard interactive least squares method. Polished surfaces of the samples studied were examined with backscattered electron imaging (BSE). The samples were impregnated with epoxy resin, cut, polished and carbon-coated. The scanning electron microscope used was a JEOL JSM 5400 model, fitted with a solid-state backscattered detector and a LINK-ISIS EDX microanalyser. Surface area measurements were made by the BET multipoint method (Model ASAP 2010, Micromeritics Instrument Corp., Norcross, GA), using N2-77 K gas. Micro-mechanical
properties were studied using the statistical nanoindentation technique. A Nanoindenter G200 (Agilent Technologies) fitted with a Berkovich indenter was used. Based on previous experience [Zhu et al, 2009] and an extensive trial, well polished epoxy resin impregnated specimens were used.
Results and Discussion
C-S-H structure was study by 29Si MAS NMR and the corresponding spectra of anhydrous calcium
silicates and the pastes at 28 days of hydration are shown in Fig. 1. The spectra for the C3S pastes
studied had six signals ranging from -69.0 ppm to -74.7 ppm, attributable to isolated Q0 tetrahedra
present in anhydrous C3S. The three signals observed at around -79.0, -82.0 and -85.0 ppm were
attributed, respectively, to Q1, Q2B and Q2 Si units in the C-S-H gel. The deconvolution data together
with the mean chain length (MCL) (calculated according the equation 1) of the C-S-H gel forming at 28 days of hydration are given in Table 2.
MCL = [(2(Q1+Q2(0Al)+ Q2B(0Al))/Q1] (1)
Fig 1. 29Si MAS NMR spectra of anhydrous calcium silicates and hydrated pastes at 28 days
Table 2. Deconvolution data for 29Si MAS NMR spectra for pastes at 28-days and Mean Chain Length (MCL)
MCL ΣQ2/Q
TOTAL ΣQ2/Q1
C3S 3.80 0.47 0.90
A 3.65 0.45 0.83
B 3.53 0.43 0.76
Fig. 2. Pore volume distribution versus mean pore diameter (nm) measured by nitrogen sorption isotherms
0 5 10 15 20
0 20 40 60 80 100
Hydration time (days)
su
rf
a
ce ar
ea
(m
2 /g
) C3S C2S
A B
0.0000 0.0005 0.0010 0.0015
1 10 100 1000
Average pore diameter (nm)
d
V
/d
(D
) P
o
re
v
o
lu
m
e
(c
m
3 /g
-n
m
)
C3S C2S A B 28 days
Fig. 3. Evolution of surface area with hydration time
The 29Si MAS NMR spectra of anhydrous mixtures showed nine signals ranging from 69.0 ppm to
-74.7 ppm. The signal at -71.6 ppm is attributable to isolated Q0 tetrahedra present in anhydrous C 2S
and the other eight signals are associated to the isolated Q0 tetrahedra present in anhydrous C
3S. In the
spectrum of the hydrated B (C3S + β-C2S) paste, only five signals between -69.0 to -74.7 ppm could be
resolved due to the overlap of several signals. Three additional signals are observed at around 79.0, -82.0 and -85.0 ppm attributed to Q1, Q2B and Q2 Si units in the C-S-H gel, respectively. In the 29Si
MAS NMR spectrum of the hydrated A (C3S + β-C2S) paste four signals are observed, one at – 72.1
ppm assigned to the Q0 tetrahedron present in anhydrous C
2S and also three signals at -79.0, -82.0 and
-85.0 ppm attributed to Q1, Q2B and Q2 Si units in the C-S-H gel, respectively. In this spectrum, no
signal attributed to the Q0 Si unit present in anhydrous C
3S is detected because according to previous
studies [Goñi, et 2010] at 28 days of curing around 81% of C3S has already reacted, consequently the
amount of anhydrous C3S is too low to be detected.
In Table 3, the Ca/Si atomic ratio obtained by BSE/EDX is presented; each value is the mean of 30 analyses. As can be seen, the ratios obtained for the outer C-S-H were slightly lower than those of the inner-C-S-H gel, especially for the plain C2S.
Table 3. Ca/Si atomic ratio determined with BSE/EDX in C3S, C2S, A and B -28 days hydrated pastes
The pore-size distributions, obtained from the nitrogen sorption isotherms, for different pastes at 28 days of hydration, in the range of pores from 1nm to 100nm of diameter (Figure 2), shows in all the cases, a bi-modal distribution with two maxima centred at 10-20 nm and 3 nm, which indicates high volume of pores per gram of dried sample of ~12 nm and ~3 nm diameter.
In the case of the C2S and B mixture, the intensities are higher than those of C3S and A mixture;
besides, higher proportion of small pores can be seen in the case of the C2S and B pastes. These two
populations of pores can be related to two packing of particles of C-S-H gel, in which the type of morphology plays an important role. The surface area values (see Figure 3) increase with hydration time with a fast gain at earlier ages (acceleration period) and very small gain at later ages (deceleration period). The surface area values corresponding to the A mixture are located practically on the line of the C3S. This seems to indicate close textural characteristics of C-S-H gels for both C3S and A
mixture. When the proportion of C2S in the mixtures increases, the surface area values are higher than
those of the C3S and A mixtures, mainly at early ages of hydration, where the amount of C-S-H is
markedly lower for the C2S. These values diminish at later ages of hydration and they spread to be
equalled to those of the C3S.
One of the most important parameter, which is responsible of the changes in textural characteristics of the C-S-H gel, including morphology is the free space (capillary porosity) available for the C-S-H growing.
C3S C2S A B
Inner C-S-H 1.8 ± 0.3 1.6 ± 0.2 1.8±0.1 2.0±0.2
Fig 4. Porosity measured by MIP versus the amount of C-S-H gel.
0 20 40 60 80 100
0 10 20 30 40
Porosity (6nm-500um) (%)
C-S
-H g
e
l (
%
) C3S A B C2S In fact, although the same water to mixture ratio of 0.4
has been used in all the cases, nevertheless, the very slow hydration rate of the βC2S causes higher free space
(capillary porosity) compared with that of T1C3S, for
the same hydration time.
As the amount of C-S-H gel increases, the free space (capillary porosity) decreases as can be seen in Figure 4, giving rise to the texture changes observed into the C-S-H gel.
The space available also can influence in the morphology of the particles, which can be fibrous or globular, in the case of the C-S-H gel. The growth of like-fibrous or acicular particles is favoured in the capillary pores (outer product). On the contrary, the growth of like-globular and more compact particles is favoured when the space is reduced (inner product).
Examples of those morphologies can be seen in Fig. 5, where packed particles of globular morphology covering of portlandite are detected in C3S and A samples (Fig. 5 (a-b)).
The fibrous morphology or of C-S-H gel particles are formed in the case of the C2S and B mixtures
where the space available to grow is higher (Fig. 5 (c, d)). Details of the globular and fibrous morphologies of the C-S-H gel particles can be better seen at higher magnifications, by TEM (Fig. 6 (a and b.)).
Fig. 6. TEM images of globular (a) and fibrous (b) C-S-H gel particles
The nanoindentation test in this study was based on testing a total of 320 grid points with an indent spacing of 20 µm for each specimen. At each testing point, a progressive two-step load-unload cycles with a maximum load 1 mN were carried out. The E modulus and hardness values at the test point were calculated using the 2nd unloading cycle, with a maximum indentation depth about 200 – 250 nm.
C-S-H
10 (a)
C3S (7 d)
C-S-H
C-S-H (c)
C2S (7 d)
10 μm
Portlandite
(b)
A (7 d)
C-S-H gel
10 μm
C-S-H
P
B (7 d)
10 μm (d)
Fig. 5. SEM images of C-S-H gel of C3S, A, B and C2S mixtures
hydrated for 7 days.
C2S
A
Statistical analysis of all the test results from the 320 indents obtained was undertaken to extract the micromechanical properties of each individual phases in the tested area using the deconvolution technique presented previously [Constantinides and Ulm 2007, Ulm et al 2007, Zhu et al 2007]. Fig.7 presents an illustration of the technique used.
Fig.7.Statistical distribution of the test results and the possible model fits with multi-modal Gaussian distribution curves within the range of mechanical properties for the hydration phases – Model fits 1, 2, 3 and 4 representing the loose-packed (LP)C-S-H, LD-C-S-H, HD-C-S-H and CH phases respectively.
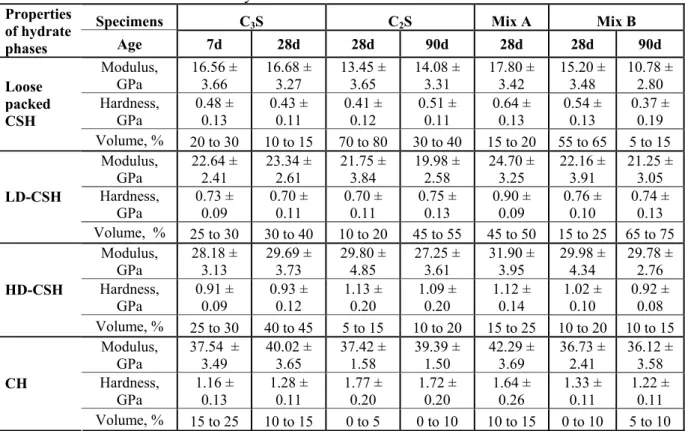
Table 4. Summary of the statistical nanoindentation test results
Specimens C3S C2S Mix A Mix B
Properties of hydrate
phases Age 7d 28d 28d 90d 28d 28d 90d
Modulus, GPa
16.56 ± 3.66
16.68 ± 3.27
13.45 ± 3.65
14.08 ± 3.31
17.80 ± 3.42
15.20 ± 3.48
10.78 ± 2.80 Hardness,
GPa
0.48 ± 0.13
0.43 ± 0.11
0.41 ± 0.12
0.51 ± 0.11
0.64 ± 0.13
0.54 ± 0.13
0.37 ± 0.19
Loose packed CSH
Volume, % 20 to 30 10 to 15 70 to 80 30 to 40 15 to 20 55 to 65 5 to 15 Modulus,
GPa 22.64 ± 2.41 23.34 ± 2.61 21.75 ± 3.84 19.98 ± 2.58 24.70 ± 3.25 22.16 ± 3.91 21.25 ± 3.05 Hardness,
GPa
0.73 ± 0.09
0.70 ± 0.11
0.70 ± 0.11
0.75 ± 0.13
0.90 ± 0.09
0.76 ± 0.10
0.74 ± 0.13
LD-CSH
Volume, % 25 to 30 30 to 40 10 to 20 45 to 55 45 to 50 15 to 25 65 to 75 Modulus,
GPa 28.18 ± 3.13 29.69 ± 3.73 29.80 ± 4.85 27.25 ± 3.61 31.90 ± 3.95 29.98 ± 4.34 29.78 ± 2.76 Hardness,
GPa 0.91 ± 0.09 0.93 ± 0.12 1.13 ± 0.20 1.09 ± 0.20 1.12 ± 0.14 1.02 ± 0.10 0.92 ± 0.08
HD-CSH
Volume, % 25 to 30 40 to 45 5 to 15 10 to 20 15 to 25 10 to 20 10 to 15 Modulus,
GPa 37.54 ± 3.49 40.02 ± 3.65 37.42 ± 1.58 39.39 ± 1.50 42.29 ± 3.69 36.73 ± 2.41 36.12 ± 3.58 Hardness,
GPa 1.16 ± 0.13 1.28 ± 0.11 1.77 ± 0.20 1.72 ± 0.20 1.64 ± 0.26 1.33 ± 0.11 1.22 ± 0.11
CH
Volume, % 15 to 25 10 to 15 0 to 5 0 to 10 10 to 15 0 to 10 5 to 10
Table 4 presents a summary of results of the mechanical properties of individual phases and their volume fractions for the tested C3S, C2S pastes and their selected mixtures at different ages. The
mechanical property values for the individual hydrate phases in Table 4 are in good agreement with the values reported for those phases in cement paste specimens [Mondal et al 2008, Ulm et al 2007, Zhu et al 2007, 2009]. This suggests that the C-S-H and CH phases formed in hydrated C3S and C2S
are essentially the same as those formed in Portland cement paste. The HD-C-S-H and LD-C-S-H were dominant phases in the C3S whereas in the C2S sample loose packed C-S-H and LD-C-S-H
dominated. Also, the volume content of the different C-S-H phases were found to shift from the loose-packed to LD (for C2S and Mixture B) and from LD to HD-C-S-H (for C3S) when the age of hydration
Conclusions
The main findings obtained in present study have showed that C-S-H gels formed from C3S rich phase
hydration had more compact morphologies, smaller BET-N2 specific surface area and lesser porosity
than the gels from C2S-rich pastes. The space available also can influence in the morphology of the
particles, which can be fibrous or globular, in the case of the C-S-H gel. The growth of like-fibrous or acicular particles is favoured in the capillary pores (outer product). On the contrary, the growth of like-globular and more compact particles is favoured when the space is reduced (inner product). The fibrous morphology of C-S-H gel particles are formed in the case of the C2S and B mixtures where the
space available to grow is higher. A evolution to globular morphologies are observed when increases the hydration time.
The results of nanoindentation tests appear to indicate that the various C-S-H phases formed in hydrated C3S and C2S have the same mechanical properties as those formed in Portland cement paste.
Compared to the C3S sample, the hydrated C2S specimen was dominated by the loose-packed (LP) and
the low-density (LD) C-S-H phases, and had a much lower content of the high density (HD) C-S-H phase.
Acknowledgement
This research was funded by European Commission under project FP7-NMP3-SL-2008-214030.
COmputationally Driven design of Innovative CEment-based (CODICE project).
References
- Allen A.J., Thomas J.J., and Jennings H.M 2007, Composition and density of nanoscale calcium–silicate– hydrate in cement, Nature Materials, 6, 311-316.
- COmputationally Driven design of Innovative CEment-based materials (CODICE) project - contract NMP3-SL-2008-214030, www.codice-project.eu.
- Constantinides G, Ulm F-J., van Vliet KJ., 2003 On the use of nanoindentation for cementitious materials. Materials and Structures; 36(3): 191-196.
- Constantinides G., and Ulm F-J.2004, The effect of two types of C-S-H on the elasticity of cement based materials: results from nanoindentation and micromechanical modelling, Cement and Concrete Research, 34, 67-80.
- Constantinides G. and Ulm F-J. 2007, The nanogranular nature of C-S-H, J. Mechanics and Physics of Solids, 55, 64-90.
- Costoya Fernandez M.M. 2008 Effect of Particle Size on the Hydration Kinetics and Microstructural Development of Tricalcium Silicate. Ph.D. Thesis Work no 4102, École Polytechnique Fédérale de Lausanne. - Dolado J. S., Griebel M., and Hamaekers J 2007, A molecular dynamic study of cementitious calcium silicate hydrate (C-S-H) gels, Journal of American Ceramic Society, 90 (12)3938-3942.
- Goñi S., Puertas F., Hernández M.S., Palacios M., Guerrero A., Dolado J.S., Zanga B. and Baroni F., Quantitative study of hydration of C3S and C2S by thermal analysis. Evolution and composition of C-S-H gels formed, J Therm Anal Calorim. Published on line 06 May 2010. DOI:10.1007/s10973-010-0816-7.
- Hernández M.S., Goñi S., Puertas F., Guerrero A., Palacios M., and Dolado J.S.2010, “Synergy of T1-C3S and
β-C2S Hydration Reactions, J. Am. Ceram. Soc., DOI: 10.1111/j.1551-2916.2010.04214.x.
- Jennings H.M.2008, Refinements to colloid model of C-S-H in cement: CM-II, Cement and Concrete Research 38, 275-289.
- Mondal P., Shah S.P., Marks L.D.2008 Nanoscale characterisation of cementitious materials, ACI Materials Journal; 105:174-9.
- Vandamme M., Ulm F-J., and Fonollosa P.2010, Nanogranular packing of C–S–H at substochiometric conditions, Cement and Concrete Research 40, (1) 14-26.
- Zhu W, Hughes JJ, Bicanic N, Pearce C.2007, Nanoindentation mapping of mechanical properties of cement paste and natural rocks. Materials Characterization; 58(11-12): 1189-1198.