Congestion pricing and inter-temporal preferences rate integration in social welfare function
First and corresponding author: Luis A. Guzman Affiliation: Ph.D
Grupo de Estudios en Sostenibilidad Urbana y Regional, Universidad de los Andes Address: Carrera 1 Este No. 19A-40, Edificio Mario Laserna
Bogota, Colombia
Second author: Floridea Di Ciommo
Affiliation: Senior Research Associate, TRANSyT Transport Research Universidad Politecnica de Madrid.
28040 Madrid, Spain.
Third author: Daniel Hoz
Affiliation: Associated Professor, Transport Department. Independent Consultant Universidad Politecnica de Madrid.
Abstract
INTRODUCTION AND RELATED WORK
Research on "welfare economics" focuses on the pursuit of the statement "X has higher welfare in scenario A rather than B" which implies that "X prefers scenario A to B". This value judgment, innocent and independent at first, involves many questions: whose preferences should count? Over what period of time? How should these preferences be counted? All these concerns must somehow be integrated into a social policy formulation.
They exists different manner for defining a welfare function. Traditionally, welfare economic theory foundation is based on a Net Present Value (NPV) calculation where the time dependent preferences of considered agents need to be taken in account. However, the time preferences, remains a controversial subject. Currently, the traditional approach employs a unique discount rate for various agents. However, this way of discounting appears to be inconsistent with the rhetoric and spirit of 'sustainable development' (1). New research work suggests that the discount rate may not be a homogeneous value. The discount rates may change during time following the individual's preferences. A significant body of evidence suggests that people do not behave following a constant discount rate (2), (3). In fact, UK Government has quickly recognized the power of the arguments for time-varying rates, as it has done in its official guidance to Ministries on the appraisal of investments and policies (4). Other authors deal with not just time preference but with uncertainty about future income (precautionary saving). In a situation in which economic growth rates are similar across time periods, the rationale for declining social optimal discount rates is driven by the preferences of the individuals in the economy, rather than expectations of growth (5). However, these approaches have been mainly focused on long-term policies where intergenerational risks may appear (6), (7).
The traditional cost-benefit analysis (CBA) uses a unique discount rate derived from market interest rates or investment rates of return for discounting the costs and benefits of all social agents included in the CBA (8). However, the costs of opportunity may differ amongst individuals, firms, governments, or society in general, as do the returns on savings. In general, the firms or operators require an investment rate linked to the current return on savings, while the discount rate of consumers-users depends on their time preferences with respect of the current and the future consumption, as well as society can take in account the intergenerational well-being, adopting a lower discount rate for today's generation. Time discount rate of social actor (users, operators, government and society) places a lower value in a future gain and the uncertainty about future income strongly determine the individual preferences These time and uncertainty dependent preferences must be integrated into a transport policy formulation that has significant social impacts. The use of individual social agent discount rate drives the optimization process by a LUTI model more credible. The discount rate of a user cannot be the same than the operator's discount rate. The preferences of both are different.
In addition, another school of thought suggests that people, such as a social group, may have different attitudes towards future costs and benefits (9). Particularly, the users have different discount rates related to their income. Some research work tried to modify user discount rates using a compensating weight which represents the inverse of household income level. The discount rate is important in order to make acceptable or not a policy or investment by considering if the discounted value of benefits exceeds the discounted value of the costs. Therefore, the economic theory on which welfare assessment is based has various implications for investment policies including transport policies (10).
Extra travel time has been one of the main motivations for investment in transport infrastructure and services.
One of the measures proposed for road congestion is congestion pricing following the Pigouvian thinking of charging for the external costs (11). Congestion pricing has been studied in a very large amount of settings: with steady-state congestion models, using queuing models, taking into account network equilibrium and considering all sorts of secondary issues such as time-dependent charges (12), (13). But from the earliest Walters (14), Vickery (15), UK Ministry of Transport (16), to the most recent works (17), (18), (19) one of the main interests has been to define the optimal price in order to maximize the social welfare.
Traditionally, congestion pricing strategy welfare is assessed using a static CBA (20), (21), (22). However the analysis of the congestion pricing should take into account interaction between urban subsystems (social, environmental, land-use or activity allocations). The integrated approach of transport and land-use dynamic systems allows to estimate a social welfare function with respect to the time and space when a transport policy is implemented. The optimization of the welfare function is achieved using the NPV related to the inter-temporal preferences (i.e. discount rates) of different socials agents included in the welfare function. However, the current social welfare functions used in transport policies appraisal mainly consider a unique value of discount rate. This paper looks at identifying whether the use of various discount rates following social agents' inter-temporal preferences has an effect on the definition of optimal strategy of congestion pricing implemented in a metropolitan environment.
Therefore, following the economic, transport and environmental literature about the variability of the discount rates, a new welfare function using different social rates is propounded (23). This approach intends to better reflect the real inter-temporal preferences of the single agent, their expected benefits and costs. An optimization procedure is implemented over a Land-Use and Transport Interaction model (LUTI model) in order to search for the optimal transport strategy. Three time periods (+5, +10 and +20 years) are studied to evaluate the effects of the planning process at short, medium and long terms.
This paper is organized as follows: after the introduction and related works presentation, the second section defines the methodology based on the simulation and the optimization of a congestion pricing based on a LUTI model. The optimization process of the objective function (OF) is detailed in the third section. The fourth section describes the case study of the metropolitan area of Madrid and presents the congestion pricing scenario to optimize. Section five presents an analysis of results and the comparison between the optimization process using welfare functions characterized by the same discount rate or by different discount rates related to each agent. This section includes as well a micro-territorial analysis. The last section offers conclusions about the impacts in terms of policy recommendations derived by the adoption of different welfare functions.
GENERAL METHODOLOGY FRAMEWORK
STRUCTURE OF THE EVALUATION AND OPTIMIZATION MODEL.
The core of this procedure deals with the definition of an OF which summarizes policy-makers" objectives with respect of economic efficiency, sustainability and equity and includes the utilities of all agents (users, operators, governments and society). Finally the OF is a welfare function whose optimization depends on the discount rate adopted. In general, the optimization of the welfare function considers the same discount rate for all agents included in the welfare function. This paper introduces different rates of discount, depending on the time preferences of each agent and compares the results of the optimization process using a unique discount rate or different discount rates. The optimal transport strategy is defined as the set of transport measures that maximizes the value of this function.
The LUTI Model
MARS-Madrid was developed to simulate the future development of the land-use and transportation over time. The model is able to support policy evaluation and scenario testing over short, medium and long-term horizons. It uses the concepts of causal loop diagrams (CLD) from the system dynamics, which provide the basis to study the cause and effect among the variables of the transportation system and the land-use. The current version of MARS is implemented in Vensim, a System Dynamics programming environment based on the analysis of speed vs. O-D demand relationships, and includes speed-flow functions that simulate the current transport network. These functions are calibrated for Madrid Network with the VISUM® specialized transport modeling.
The implementation of a LUTI model for evaluating the impacts of transportation policies is a major improvement with respect to the use of traditional four-step travel demand models. MARS-Madrid includes a land-use component and explicitly simulates the interaction between the transportation system components and the relocation of residences and economic activities over time. The direct and complex relationship between transportation and the urban activity system (33) sets the basis for the instable equilibrium that exists between transportation supply and demand.
MARS-Madrid includes a transportation model, a housing development model, a household location choice model, a workplace development model, and a workplace location choice model. The transportation model simulates the travel behavior of the population that lives in each studied area, depending on the location of residences and work places. This model uses the concept of a constant travel time budget (34). The land-use model simulates the generation and allocation of new housing units and the location of workplaces for two main categories, production and services. In addition MARS-Madrid can compute energy consumption from transportation and the generation of a set of greenhouse gases (GHG) and other pollutant emissions produced by transport. Table 1 shows the main characteristics of MARS-Madrid Simulator.
TABLE 1. MAIN FEATURES OF LUTI MODEL
Model Feature MARS-Madrid Model
Number of zones Travel modes Congestion effects Generalized costs Journey purposes Household features
Mode and destination choice Demand response
Land-use response
90
Car, transport public (bus and rail), slow
OD-specific speed-flow curves for trips V/C ratios)
In-vehicle time, access/egress time, parking search time, waiting times, transfer times, car costs, PT fares
Commute, others
Employed population, car ownership, household income Simultaneous choice
Commute trips inelastic. Constant time budget Yes
FIGURE 2. PROJECTED SOCIOECONOMIC VARIABLES [2011=1.0]
The MARS-Madrid model has been calibrated for the regional and metropolitan area of Madrid (MARS-Madrid). Table 2 shows the modal split data that were used in the calibration of MARS-Madrid for the base year. The modal split for both commuting trips (home-work) and other trips (home-other) is calculated using the Madrid 2004 mobility survey (37). Other data inputs that were used in the project include:
• Constant travel time budget: 87 min (37). • Average trips by worker: 2.04.
• Time value (commuting and other at prices 2004): 10.45 €/h and 5.70 €/h (38). TABLE 2. MODAL SPLIT CALIBRATION DATA
Mode Commuting trips Other trips Total
Slow 12.3% 24.2% 20.5%
Bus 15.7% 18.2% 17.4%
Rail 26.3% 19.3% 21.5%
Car 45.7% 38.3% 40.6%
The cost unit values for externalities (Table 3) were obtained from the European Project "Developing Harmonized European Approaches for Transport Costing and Project Assessment" (39). As shown in the above equation, the investment costs are not taken into account.
TABLE 3. ESTIMATED EMISSIONS VALUE AND CASUALTIES AVOIDED Year Avg. C02 value Avg. NOx value Avg. PMio value
2004-2009 22
2010-2019 26
5,300 2,873
2020-2029 32 5,300 2,873
2030-2039 40
Fatality 1.193.686
Severe injury 147,755
The Optimization Process
The optimization process enables the level of intensity of the application of certain transport policies to be defined. Optimization techniques have been an important field of research in transportation planning (40), (41), (42), (43), (44), (45), (46), (17). This paper focuses on the method developed by Powell in 1964 (47). This method is an algorithm that searches for a local minimum/maximum of OF for a set of linearly independent direction vectors without calculating the derivatives. A detailed discussion of the algorithm is given in Brent (48), and the complete algorithm is given in Press et al. (49).
The procedure of the optimization process can search through a large space of parameter values looking for optimal solutions. Firstly, it is necessary to define the OF you want to optimize. An efficient hill climbing algorithm searches through the parameter space looking for the best cumulative objective function value. Secondly, the constants of the model are chosen. Thirdly, the optimization process finds the values for those parameters that optimize the objective function (23).
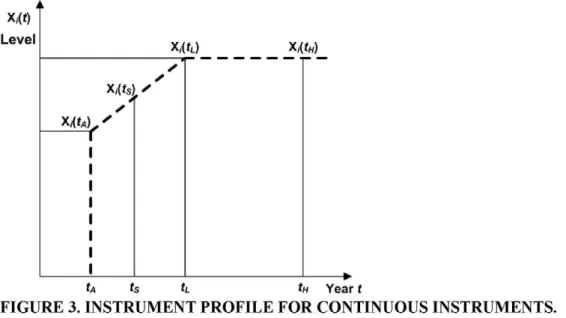
This method can be applied to optimize several types of transport and land-use policies; however in this case, the optimization process to choose the best transport policy levels (i.e. toll value) is proposed with an application of two variables: a toll-pricing policy profile for passenger vehicles (initial and final toll value) in Madrid city center. The introduction of the concept of "policy profiles" allows specifying policy instrument levels and optimized them for two points over time.
We develop scenarios that simulate specific "policy profiles": each policy can in fact be implemented with different characteristics over time: we define the main characteristics of a policy profile through X(tA) and X(t,J as the levels of the policy attributes respectively in the initial year tA (the value of the policy when it is introduced) and in the short, medium and long-run (the final policy value after the intermediate adjustments). Similarly, tA is the year in which the policy is introduced (tA =2012 in this study) and tL identifies the end of the evaluation period on which the policy is evaluated (/, =2017, 2022 or 2034, according the scenario). The levels of instrument in intermediate years X{t) are determined by interpolating a linear function, and the level is then assumed constant for any year after the tL year as depicted in Figure 3.
A,
x,( tL) x,(
x,(fs]
4
UU),'\ 1 1
•
s
s
x,(fs]
4
UU),'\ 1 1 1 1 1 1 1 1
1 •
U ts tL tH Year t
THE WELFARE OBJECTIVE FUNCTION
The OF identified with the social welfare function assembles the strategic variables that have been optimized. The objective function of the LUTI model is the welfare function (WF), including the sum of all social benefits optimized throughout the complete period of time.
Thus the WF showed in Eq. (1) measures the change in social welfare compared to the do-nothing scenario (reference scenario). This function is defined by the following elements: the change in consumer surplus (ACSljm), which includes either the monetary costs (or savings) and time savings for users, resulting through the implementation of strategy X. The variation of the operator benefits (A0ljm) includes gains linked to revenues from fares and charges. The change of government benefits (AGljm) includes fuel tax revenues, and investment savings related with road costs maintenance. Finally, the variation of benefits for the society related with the external costs (AEljm) includes reduction of accidents, greenhouse gas emissions and pollution costs.
WF = luiijmkva + r
uy
)
• A C Si y m( t ) + ( 1 / ( 1 + r0)t) •A
O
i j m(t) + ( 1 / ( 1 + r
gY) •
A
G
i j m(t)
+ (1/(1 + r
e)
t) • A
E
i j m(t)]
(1)
The final evaluation is expressed by net present value (NPV) over the different scenarios, and using different discount rates (/'„, ra, rg, re,) according with the considered social agents (users, operators, government, society). The government and the society social discount rate in this paper will be the same. The variable t represent the period of time. The variable m is the transport mode. The /' and j subscripts refer to origin and destination zones, respectively.
It is well known that the consumer surplus from a change in travel times and/or travel costs should in general be calculated at the level of origin-destination pairs.
ACSjym(t) ~ ~'Zt'Zijm[Tijm(.t) + ( 0 ] " [G(°ym(t) - Gfjm(t)]
*
l2ItI
ipn[Tu
m(t) + n
jm(t)} • (Cl
jm(t) + tf
jm(t) • VOT[ - C?
jm(t) - t ° -
m( t ) • VOTt) (2)
Where fl j m is the demand for trips between i and j by mode m, in the k scenario; G ijm is travel generalized cost; CkiJm is total travel cost including charging and operation cost; ikljm is the travel time; and VOT1 is the value of time. The superscript k is used to denote either the do-nothing scenario (k=0) or the scenario that is tested (k= 1).
Consumer surplus (i.e., the difference between user utility and its cost) implied a higher consideration for the high income users because it increases with the income of users. In other words, the consumer surplus of high income people has a higher weight with respect of the low income people. In this work, the income of people is included in the user utility, to partially correct this possible distortion. Travel cost Ckijm includes the cost of charging (like a congestion toll or parking charging) and operation costs, as shown in Eq. (3).
^ ( 0 = ^ ( 0 + ^ ( 0 (3) Where is the operation costs (including fuel) between i and j by mode m, in the k scenario;
MLJm (t) = I t lijm Tijm(0 • h V X O + c}rm(t)] - r °?„ ( 0 • [/?°,„(0 + eg.m ( t )] (4) /<l|m consists in two parts, one is revenue from private vehicles in the case of an urban toll or parking charge fee; another part is constituted by the revenue collected from public transport services, e.g. trip tickets, while C,, represents the cost of administration, operation and maintenances costs.
Equation (5) represents the government's benefits or losses resulting from changes of fuel tax revenue (AF„) and the variation of the cost of road maintenance (AM,,). Finally, equation (6) represents the value of external costs, associated with green-house gas emissions (AGHE,,). air pollution (AP„) and road safety (AS,,).
AGijmit) = It Iijm[T^Jm(t) - r ° , „ ( 0 ] • [Fijm + Mijm] (5)
A % n ( 0 = I tI i j m [ T lJ m( t ) - T°Jm(t)] • [GHEijm(t) + PLjm(t) + Sijm(t)] (6) Equations (2), (4), (5) and (6), represents each agent and their costs and benefits and discount
rates, are included in the equation (1). The NPV is calculated according to the discount rate for each agent.
The different discount rates for each kind of social agents are defined following the micro-economic and CBA literature (50). In general the users prefer to consume today than tomorrow (10). Hence, the social time preferences estimated for users is between 0.5 and 1% higher than the government discount rate (51). Some studies in Spain recommend a discount rate of 4.8% (51). Another studies that present methodologies for the design of optimal transport strategies using LUTI models in UK, use a discount rate of 3.5% to reflect UK practice (46) (44). Actually, the society is the social agent having the higher preference for the future generation, having a discount rate lower than the current users. Hence the considered discount rate for users is 5.5%, while for government is 4.5% (52). Finally, the operators' discount rate is related with the expected investment value, i.e. between 7% and 10% (53).
MADRID CASE DESCRIPTION
The Madrid city center area is about 54.8 km2. In 2004, around 250,000 of the inhabitants of this area travel by car to their workplaces outside the cordon. Additionally, almost 260,000 people live outside the cordon and have their workplaces inside, and commute by car from outside to inside of the cordon area (54). Figure 4 shows the basic geographical information used in the model.
The MARS- Madrid model includes 90 zones covering the whole region, 61 of which correspond to urban and metropolitan areas. The cordon area defines a zone of the city in which access is restricted to private vehicles, in order to reduce pollutant emissions in the center of Madrid. For this case the zone selected as a trial was the area inside the ring road known as the M-30 (Figure 4). The area of study has a high provision of public transportation, both in terms of coverage and service. In the forecast scenarios, projections were made for economic and population growth based on data from the Institute of Statistics in Madrid (36).
toll regardless of the car type or the resident zone in which he lives (except for CBD residents). In the do-nothing scenario there is no toll to pay for travel to the city center.
Madrid Region Toll&Parking Scheme Area (CBD)
Tolled Zone Rest of Modeled Area Modeled Area
CBD Periphery Metropolitan Ring Regional Ring Total
Population 1.013.364 2.256.497 2.722.751 501.891 6.494.503
Workplaces 443.370 1.000.630 531.395 92.561 2.073.956
Area (km:) 41,18 565,20 2.272,60 5.151,70 8.031
Modal Split (PC/PT) [%] 43/57 42/58 68/32 89/11 52/48
Car/1,000 inhabitants 438,18 388,68 521,39 816,81 511,96 FIGURE 4. MODELED AREA AND CITY CENTER AREA - MADRID.
SCENARIOS DEFINITION
By combining discount rates and time periods, the scenario framework is defined. Hence, six groups of scenarios were identified (the first three for the same rates for all social agents, and 4, 5 and 6 for different discount rates for each agent) for metropolitan area of Madrid:
TABLE 4. OPTIMIZED SCE] VARIOS
Scenario Code
Initial year
Final
year Discount rates (ra)
tA tL Users Operators Government Externalities
Same rates and short term [SR-ST] 2012 2017 4.8% 4.8% 4.8% 4.8% Same rates and medium term [SR-MT] 2012 2022 4.8% 4.8% 4.8% 4.8% Same rates and long term [SR-LT] 2012 2034 4.8% 4.8% 4.8% 4.8% Different rates and short term [DR-ST] 2012 2017 5.5% 7.0% 4.5% 4.5% Different rates and medium term [DR-MT] 2012 2022 5.5% 7.0% 4.5% 4.5% Different rates and long term [DR-LT] 2012 2034 5.5% 7.0% 4.5% 4.5%
ANALYSIS OF RESULTS
As expected, car traffic entering the cordon zone is reduced at the end of the time period (2017, 2022 and 2034). There is a modal shift from car to PT in radial trips (periphery to center). This modal shift results in a PT fare revenue surplus. In addition, the capacity surplus produces a scenario with lower congestion in radial corridors (Figure 4). The increasing speed improves the trip time for car users, as well as for road-shared PT services. A general time savings for private and PT users is generated. However, a percentage of radial car trips (between 3 and 5%, according to the scenario) have changed their destination pattern, intensifying the loss of attractiveness of the tolled city center compared to the rest of the region. In the case of internal city center mobility, the current scenario produces a reduction of the use of roads in the city center that decreases the delays. The main consequence is an increasing of car use by the city center residents excluded from paying atoll. These dynamics may require an adaptation of the tolling scheme or it may need to be complemented with other transport policies, e.g., a new parking scheme (55). Table 5 summarizes the optimal strategies for the welfare function maximization.
TABLE 5. SURPLUS ALTERNATIVE SCENARIO/REFERENCE SCENARIO OF THE MADRID R O A D C H A R G E SCHEME FOR THE OPTIMAL TOLL VALUE [NPV M€]
Scenario [SR-ST] [SR-MT] [SR-LT] [DR-ST] [DR-MT] [DR-LT]
Welfare (M€) 93.57 169.18 309.11 74.85 119.08 167.58
Toll value optimum
Year tA 11 tA 11 tA 11 tA 11 tA 11 tA tL
Toll value optimum
Year
2012 2017 2012 2022 2012 2034 2012 2017 2012 2022 2012 2034 Toll value
optimum
Value (€) X(tA) X(tL) X(tA) X(tL) X(tA) X(tL) X(tA) X(tL) X(tA) X(tL) X(tA) X(tj)
Toll value optimum
Value (€)
1.6 2.3 1.8 2.5 2.3 2.1 1.5 2.5 1.7 2.2 2.3 0.2
Users (M€) Time savings
Car users 126.10 232.73 418.64 124.43 211.07 285.64
PT users 93.67 169.79 290.40 92.60 153.72 201.59
Money savings
Car users -483.91 -891.37 -1,556.11 -484.36 -788.94 -995.88
PT users 0.00 0.00 0.00 0.00 0.00 0.00
Total benefit users -264.14 -488.85 -847.07 -267.33 -424.15 -508.66
Operators (M€)
PT fares revenue 18.32 33.26 56.32 17.49 27.84 34.58
Parking charges revenues -97.98 -176.56 -298.92 -94.17 -147.32 -180.94
Congestion pricing
revenues 453.22 830.39 1,451.61 434.96 690.08 859.41
Total benefit operators 373.56 687.09 1,209.32 358.28 570.59 713.04
Government (M€)
Fuel tax revenues -18.35 -34.10 -63.65 -18.76 -32.10 -43.80
Road maintenance costs 1.90 3.53 6.38 1.95 3.27 4.24
Total benefits government -16.45 -30.57 -57.28 -16.81 -28.82 -39.53
Externalities (M€)
Environmental benefits 3.53 6.80 13.41 3.62 6.38 8.91
Accidents costs -2.93 -5.29 -9.27 -2.91 -4.93 -6.15
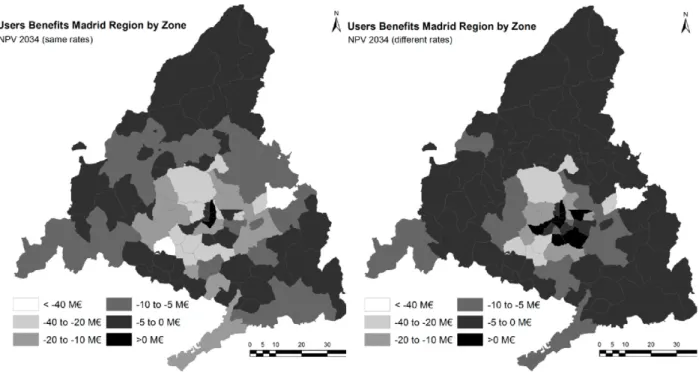
Usera District (Low income zone 1,200
Pinto municipality income zone 3,000
-2 to -1 M€ -1 to 0 M€ >0M€
Users Benefits Madrid Region by Zone NPV2017 (same rates)
Colmenar municipality (High income zone 3.500 €)
Users Benefits Madrid Region by Zone NPV 2017 (different rates)
FIGURE 5. USERS BENEFITS BY ZONE AND SCENARIO
The time saving, is significant after the cordon toll implementation. The increased accident rate caused by a higher speed in the charging area leads to higher accident costs. Anyway travelers pay a higher price (time and costs including the pricing policy) than the time costs they save with the congestion pricing. Total social welfare is positive because the operators" revenue collection dominates travelers" surplus reduction. These results highlight that this policy may have a strong social opposition as user surplus in negative. Nevertheless, the real case of congestion pricing shows an increasing acceptability of an urban congestion toll (56). The main reason is the jointly implementation of a public transportation policy that increase PT services and pay a major attention to the more losing zones. Congestion pricing schemes generate significant positive present value of revenue which may lead to promote complementary public transport measures compensating the increasing generalized costs for users.
Comparing the results between the optimization process using same rate or different rates among social agents, we observe that in general the use of discount rates following the suitable social time preferences for each kind of actors decreases the social welfare in the medium and long terms. The short term, seems to be the same. The use of different discount rates for agents shows that the optimal value for toll is strongly decreasing with respect to the use of the same discount rate. As above said a positive social welfare is generated because toll charges revenues dominates the travelers" surplus reduction. But, as the value of potential future revenues for operators decreases in time faster than the disutility to users because of the differences on time preferences (translated into different discount rates), the tolling scheme undergoes a relevant change through de different DR-n scenarios. Values for X(tA) and X(t,J vary from
This is a very important advance in the literature of the CBA analysis implemented to appraise transport policies: the use of the real social inter-temporal preference rate for each actor represents at more realistic utility of each social actor. A future development could be the introduction of different discount rates with respect of the different groups of users, or government or operators.
From a time perspective of marginal changes of social welfare, it declines overtime for all scenarios (Figure 6). This trend is more pronounced when we apply different discount rates (DR scenarios). Individual user interests prevail over the rest of agents, especially over the interest of operators in creating new revenues due to his higher discount rate that undervalue future gains. This causes an inconsistency of the policy between operators and the rest of social agents.
CONCLUSIONS
Discounting future benefits and costs is almost universal in CBA approach. In general, future benefits and costs receive smaller weight than the imminent ones. The chosen discount rates determine the magnitude of the difference between current and future costs/benefits. Different agents with different time preferences, risk, and opportunity may be affected by transportation projects. Therefore using a unique discount rate to homogenize time dependent costs and benefits in a social welfare may be inaccurate. This research looks to identify whether the use of more suitable discount rates for each social actors had an effect on the selection and definition of optimal strategy of congestion pricing. At the same time, different conclusions regarding impacts of the policy are also revealed.
The following four conclusions could be addressed:
1. Optimal congestion pricing increases the costs of passenger vehicle use and therefore reduces the traffic volume, especially for periphery-CBD trips. This in turn increases demand for PT as well as reduces travel time for all traffic flows. Hence, congestion pricing leads to an improvement in environmental conditions as it reduces passenger private vehicle traffic. In general, the total social benefit for cordon toll scheme is positive in all scenarios. Even though in all cases, optimal congestion pricing scheme produce a decreasing consumer surplus, especially for lower income people.
3. If the revenue from a congestion toll is not returned to users, the social welfare declines. In particular, when all road users suffer identically from a delay and the toll revenue is not recycled in favor of the users, the toll just reduces users' welfare and this may lead, not only to a social unacceptable measure but to an ineffective measure from a social welfare point of view. However, congestion pricing have an important role for city planners. Other transport measures, improving PT measures for example, may have a positive user surplus at the expenses of generating negative financial impacts on operators which may lead to increase subsidies to PT. Revenues from congestion pricing may be recycled to cover these subsidies required making both measures complementary. Instruments may mutually reinforce as the effectiveness, acceptability and economic support are improved. The acceptability problem of the congestion charge is overcome and mitigated. Added to this, congestion pricing instrument may finance complementary instruments and, thus, subsidization is less necessary if congestion pricing are in place. This highlights the need for planners in the packaging of different policy instruments to form an overall strategy. Moreover, if complementary measures were optimized jointly, an optimal level for recycling revenues from congestion pricing would be achieved.
4. A social welfare analysis from a geographical point of view illustrates that aggregate social welfare as a sum of surpluses ignores equity issues, which may be socially unacceptable because tolls penalize some people for the benefit of others. The analysis showed that the charge discourages car trips of lower income travelers more than the trips of higher incomes people. Toll revenues can be used to compensate those who might otherwise "lose" as a result of congestion pricing. Without recycling of the toll revenues, the congestion toll is definitely a regressive measure. Recycling revenues is thus a way of redistribution of wealth.
REFERENCES
1. Pearce, D., Groom, B., Hepburn, C. and Koundouri, P. (2003) 'Valuing the Future: Recent advances in social discounting', World Economics, 4(2), pp. 121-141.
2. Frederick, S., Loewenstein, G. and O'Donoghue, T. (2002) 'Time Discounting and Time Preference: A Critical Review', Journal of Economic Literature, 40(2), pp. 351-401.
3. Gollier, C. (2002) 'Time Horizon and the Discount Rate', Journal of Economic Theory, 107(2), pp. 463-473.
4. HTM (2003) 'Green Book: Appraisal and Evaluation in Central Government', London : HM Treasury. 5. Gollier, C. (2002) 'Discounting an uncertain future', Journal of Public Economics, 85(2), pp. 149-166. 6. Weitzman, M L . (1999) '"Just Keep Discounting, But...'", in Portney, P.R and Weyant, J.P. (eds)
Discounting and Intergenerational Equity, RFF Press, Washington DC.
7. Weitzman, M.L. (1998) 'Why the Far-Distant Future Should Be Discounted at Its Lowest Possible Rate', Journal of Environmental Economics and Management, 36(3), pp. 201-208.
8. Maass, Arthur. (1966). Benefit-Cost Analysis: Its Relevance to Public Investment Decisions. The Quarterly Journal of Economics, 80(2), pp. 208-226.
9. Goodin, R.E. (1982) 'Discounting Discounting', Journal of Public Policy, 2(1), pp. 53-71.
10. Feldstein, M. S. (1964) The Social Time Preference Discount Rate in Cost Benefit Analysis. The Economic Journal, 70(294), pp. 360-379.
11. Pigou, A.C. (1932) The Economics of Welfare, Macmillan, London.
12. Small, K.A. and Verhoef, E.T. (2007) The Economics of Urban Transportation, Routledge, London. 13. Tsekeris, T. and VoB. S. (2009) 'Design and evaluation of road pricing: state-of-the-art and
methodological advances', Netnomics, 10(1), pp. 5-52.
14. Walters, A.A. (1961) 'The Theory and Measurement of Private and Social Cost of Highway Congestion', Econometrica, 29(4), pp. 676-699.
16. Ministry of Transport (1964) 'Road Pricing: The Economic and Technical Possibilities', London: HMSO.
17. Guzman, L.A., de la Hoz, D. and Monzon, A. (2011) 'Dynamic Long-Term Optimization Procedure for Pricing Transport Policies Based on Social Welfare Assessment', Washington DC: 90th Annual Meeting. Transportation Research Board.
18. Light, T. (2009) 'Optimal highway design and user welfare under value pricing', Journal of Urban Economics, 66(2), pp. 116-124.
19. Safirova, E., Gillingham, K., Parry, I., Nelson, P., Harrington, W. and Mason, D. (2004) 'Welfare and distributional effects of road pricing schemes for metropolitan Washington DC', in de Palma, A., Lindsey, R. and Proost, S. (eds) Research in Transportation Economics, Elsevier, Cambridge.
20. Rich, J. and Nielsen, O.A. (2007) 'A socio-economic assessment of proposed road user charging schemes in Copenhagen', Transport Policy, 14(4), pp. 330-345.
21. Eliasson, J. (2009) 'A cost-benefit analysis of the Stockholm congestion charging system', Transportation Research Part A, 43(4), pp. 468-480.
22. Rotaris, L., Danielis, R., Marcucci, E. and Massiani, J. (2010) 'The urban road pricing scheme to curb pollution in Milan, Italy: Description, impacts and preliminary cost-benefit analysis assessment', Transportation Research Part A, 44(5), pp. 359-375.
23. Guzman, Luis A., Hoz, Daniel de la and Monzon, Andres. (2012) 'Optimal and Long-Term Dynamic Transport Policy Design. Seeking Maximum Social Welfare through a Pricing Scheme'. International Journal of Sustainable Transportation, In press.
24. Pfaffenbichler, P.C. (2008) MARS - Metropolitan Activity Relocation Simulator, VDM Verlag Dr. Miiller, Saarbriicken.
25. Guzman, Luis A. Optimizacion Dinamica de Estrategias de Movilidad Sostenible en Areas Metropolitanas. Madrid: Universidad Politecnica de Madrid, Transport Research Centre - TRANSyT, 2011. Doctoral Thesis. ISBN: 978-84-694-3127-6.
26. Sterman, John D. Business Dynamics: Systems Thinking and Modeling for a Complex World. Boston: Irwin/McGraw-Hill, 2000. ISBN: 0-07-231135-5.
27. Haken, Hermann. Advanced Synergetics: Instability Hierarchies of Self-Organizing Systems and Devices. 3. Berlin : Springer-Verlag, 1993.
28. May, A.D., Shepherd, S.P. and Timms, P.M. (2000) Optimisation of Policies for Transport Integration in Metropolitan Areas. Leeds: European Commission, 4th Framework Programme.
29. May, Anthony D. and Timms, Paul M. (2000) Financial Assistance for Transport Integration in Metropolitan Areas. Institute for Transport Studies, University of Leeds. Leeds: European Commission, 4th Framework Programme.
30. Minken, Harald, et al., et al. A Methodological Guidebook. Oslo: Institute of Transport Economics. European Commission, 2003. Deliverable 14. ISBN: 82-480-0313-2.
31. Becker Lopes, Simone. Uma ferramenta para planejamento da mobilidade sustentavel com base em modelo de uso do solo e transportes. Sao Paul : School of Engineering of Sao Carlos, 2010. Doctoral Thesis.
32. Hardy, Matthew (2012) Using Open Source Data to Populate, Calibrate and Validate a Simplified Integrated Transportation and Land Use Model. Washington D.C. Transportation Research Board (TRB) 91th Annual Meeting.
33. Manheim, Marvin L. Fundamentals of Transportation Systems Analysis. 1. Cambridge, Mass.: The MIT Press, 1979. p. 674. Vol. 1. Basic Concepts. ISBN: 0-262-63289-6.
34. Levinson, D.M. and Kumar, A. (1994) 'The Rational Locator: Why Travel Times Have Remained Stable', Journal of the American Planning Association, 60(3), pp. 319-332.
35. Pfaffenbichler, Paul C., Emberger, Giinter and Shepherd, Simon P. (2008) The Integrated Dynamic Land Use and Transport Model MARS. Networks and Spatial Economics, Vol. 8, 2-3, pp. 183-200. 36. INE (2010) 'Institute) de Estadistica de la Comunidad de Madrid', www.ine.es.
38. Monzon, Andres, Fernandez, Alvaro and Jorda, Pablo. (2008) Environmental Costs Account: A Base for Measuring Sustainability in Transport Plans, [ed.] Sebastian Rauch, Gregory M. Morrison and Andres Monzon. Madrid: Springer. Proceedings of the 9th Highway and Urban Environment Symposium, pp. 23-30. ISBN: 978-90-481-3042-9.
39. Bickel, Peter, et al., et al. Developing Harmonised European Approaches for Transport Costing and Project Assessment. European Commission, Directorate General Energy and Transport. Stuttgart: Sixth Framework Programme 2002-2006, 2005. Deliverable 5.
40. May, A.D., Shepherd, S.P. and Timms, P.M. (2000) 'Optimal transport strategies for European cities', Transportation, 27(3), pp. 285-315.
41. Mayhew, L. and Hyman, G. (2002) 'Optimizing the benefits of urban road user charging', Transport Policy, 9(3), pp. 189-207.
42. de Palma, A., Kilani, M. and Lindsey, R. (2005) 'Congestion pricing on a road network: A study using the dynamic equilibrium simulator METROPOLIS', Transportation Research Part A, 39(7-9), pp. 588-611.
43. Void, A. (2005) 'Optimal land use and transport planning for the Greater Oslo area', Transportation Research Part A, 39(6), pp. 548-565.
44. Shepherd, S.P., Zhangb, X., Emberger, G., Huds, M., May, A.D. and Paulley, N. (2006) 'Designing optimal urban transport strategies: The role of individual policy instruments and the impact of financial constraints', Transport Policy, 13(1), pp. 49-65.
45. Zhang, X., Paulley, N., Hudson, M. and Glyn, R. (2006) 'A method for the design of optimal transport strategies', Transport Policy, 13(4), pp. 329-338.
46. Emberger, G., Shepherd, S.P. and May, A.D. (2008) 'The Effects of Appraisal Methodology on the Specification of Optimal Urban Transport Strategies', International Journal of Sustainable Transportation, 2(1), pp. 58-75.
47. Powell, M.J.D. (1964) 'An efficient method for finding the minimum of a function of several variables without calculating derivatives', The Computer Journal, 7(2), pp. 155-162.
48. Brent, R.P. (1973) Algorithms for Minimization without Derivatives, Prentice-Hall, Toronto.
49. Press, W.H., Teukolsky, S.A., Vetterling, W.T. and Flannery, B.P. (2007) Numerical Recipes: The Art of Scientific Computing, Cambridge University Press, Cambridge.
50. Harberger, Arnold C. (1971). Three Basic Postulates for Applied Welfare Economics: An Interpretive Essay. Journal of Economic Literature, 9(3), pp. 785-97.
51. Souto Nieves, G. (2003) 'Tasas de descuento para la evaluation de inversiones publicas: estimaciones para Espana'. P. T. No. 8/03. Direction General de Investigation de la Generalitat de Catalunya. Barcelona : Institute de Estudios Fiscales, 2003. ISSN 1578-0252.
52. Souto Nieves, G. (2001) 'Tasa de descuento para la evaluation de inversiones publicas: Estimaciones para Espana: Papeles de Trabajo del Institute de Estudios Fiscales, 2001. pp. (8) 1-29.
53. Di Ciommo, F., Vassallo, Jose M. and Oliver, A. (2009) Private Funding Intermodal Exchange Stations in Urban Areas: the Case of Madrid. Washington D.C. Transportation Research Record Journal.
54. Monzon, A. and de la Hoz, D. (2009) 'Efectos sobre la movilidad dinamica territorial de Madrid', Urban, 14, pp. 58-71.
55. Leape, J. (2006) 'The London Congestion Charge', The Journal of Economic Perspectives, 20(4), pp. 157-176.
56. Eliasson, J. and Jonsson, L. (2011) 'The unexpected "yes": Explanatory factors behind the positive attitudes to congestion charges in Stockholm', Transport Policy, 18(4), pp. 636-647.
![FIGURE 2. PROJECTED SOCIOECONOMIC VARIABLES [2011=1.0]](https://thumb-us.123doks.com/thumbv2/123dok_es/6796204.832804/7.904.142.664.140.468/figure-projected-socioeconomic-variables.webp)

![TABLE 4. OPTIMIZED SCE] VARIOS](https://thumb-us.123doks.com/thumbv2/123dok_es/6796204.832804/12.904.99.824.229.399/table-optimized-sce-varios.webp)
![TABLE 5. SURPLUS ALTERNATIVE SCENARIO/REFERENCE SCENARIO OF THE MADRID R O A D C H A R G E SCHEME FOR THE OPTIMAL TOLL VALUE [NPV M€]](https://thumb-us.123doks.com/thumbv2/123dok_es/6796204.832804/13.904.99.818.198.708/surplus-alternative-scenario-reference-scenario-madrid-scheme-optimal.webp)